| Param | Original file | Final file |
|---|---|---|
| Filename | modeM0/AS1T02_068T01_9000002238cztM0_level2.fits | modeM0/AS1T02_068T01_9000002238cztM0_level2_quad_clean.evt |
| Size (bytes) | 1,120,023,360 | 1,017,624,960 |
| Size | 1.0 GB | 970.5 MB |
| Events in quadrant A | 6,827,148 | 6,042,246 |
| Events in quadrant B | 6,441,608 | 5,714,580 |
| Events in quadrant C | 6,709,296 | 5,648,991 |
| Events in quadrant D | 5,805,888 | 5,280,331 |
| Mode M9 | |||
|---|---|---|---|
| Quadrant | BADHDUFLAG | Total packets | Discarded packets |
| A | 0 | 162 | 0 |
| B | 0 | 162 | 0 |
| C | 0 | 162 | 0 |
| D | 0 | 163 | 0 |
| Mode SS | |||
|---|---|---|---|
| Quadrant | BADHDUFLAG | Total packets | Discarded packets |
| A | 0 | 2416 | 0 |
| B | 0 | 2416 | 0 |
| C | 0 | 2416 | 0 |
| D | 0 | 2416 | 0 |
| Mode M0 | |||
|---|---|---|---|
| Quadrant | BADHDUFLAG | Total packets | Discarded packets |
| A | 0 | 267072 | 0 |
| B | 0 | 285265 | 0 |
| C | 0 | 270036 | 0 |
| D | 0 | 266301 | 0 |
| Quadrant | Total seconds | Saturated seconds | Saturation percentage |
|---|---|---|---|
| A | 118663 | 2058 | 1.734323% |
| B | 118663 | 6864 | 5.784448% |
| C | 118663 | 1574 | 1.326445% |
| D | 118663 | 3375 | 2.844189% |
Noise dominated data is calculated using 1-second bins in cleaned event files. If a bin has >2000 counts, and if more than 50% of those come from <1% of pixels, then it is considered to be noise-dominated and hence unusable.
| Quadrant | # 1 sec bins | Bins with >0 counts | Bins with >2000 counts | High rate bins dominated by noise | Noise dominated (total time) | Noise dominated (detector-on time) | Marked lightcurve |
|---|---|---|---|---|---|---|---|
| A | 138879 | 118655 | 0 | 0 | 0.00% | 0.00% |  |
| B | 138879 | 118423 | 0 | 0 | 0.00% | 0.00% | 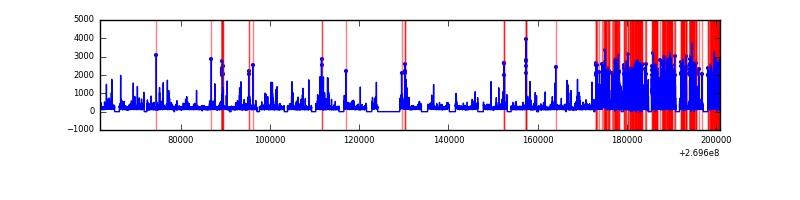 |
| C | 138879 | 118661 | 0 | 0 | 0.00% | 0.00% |  |
| D | 138879 | 118637 | 0 | 0 | 0.00% | 0.00% | 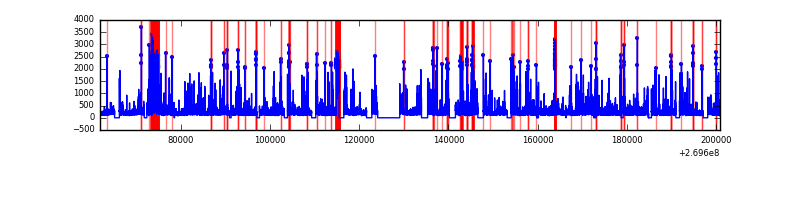 |
Top three noisy pixels from each quadrant. If the there are fewer than three noisy pixels in the level2.evt file, extra rows are filled as -1
| Pixel properties | Quadrant properties | ||||||
|---|---|---|---|---|---|---|---|
| Quadrant | DetID | PixID | Counts | Sigma | Mean | Median | Sigma |
| A | 0 | 29 | 6683 | 11.54 | 1773 | 1658 | 435.6 |
| A | 7 | 110 | 5406 | 8.6 | 1773 | 1658 | 435.6 |
| A | 15 | 236 | 5179 | 8.08 | 1773 | 1658 | 435.6 |
| B | 2 | 9 | 5577 | 11.82 | 1702 | 1618 | 334.9 |
| B | 3 | 17 | 4387 | 8.27 | 1702 | 1618 | 334.9 |
| B | 5 | 128 | 4337 | 8.12 | 1702 | 1618 | 334.9 |
| C | 12 | 241 | 4633 | 6.5 | 1773 | 1641 | 460.0 |
| C | 2 | 191 | 4450 | 6.11 | 1773 | 1641 | 460.0 |
| C | 3 | 126 | 4429 | 6.06 | 1773 | 1641 | 460.0 |
| D | 3 | 14 | 4265 | 6.19 | 1656 | 1501 | 446.8 |
| D | 6 | 231 | 4257 | 6.17 | 1656 | 1501 | 446.8 |
| D | 10 | 189 | 4013 | 5.62 | 1656 | 1501 | 446.8 |
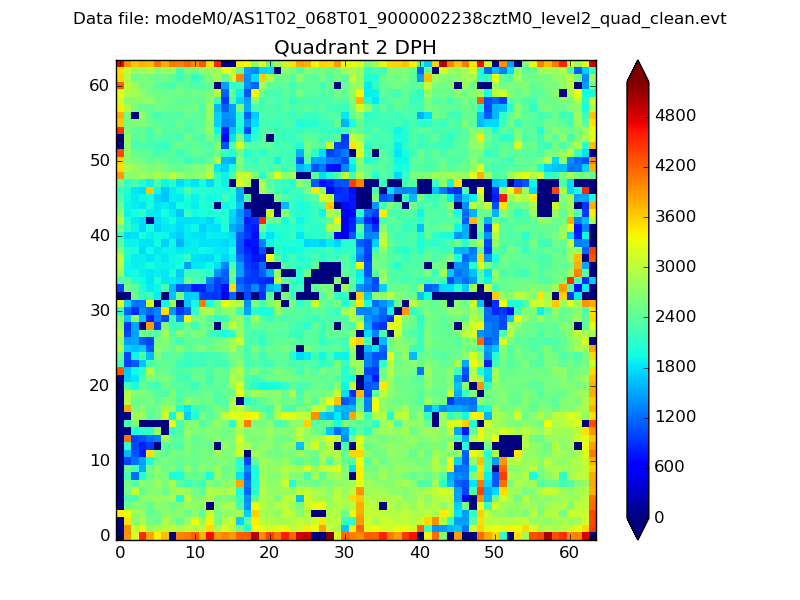
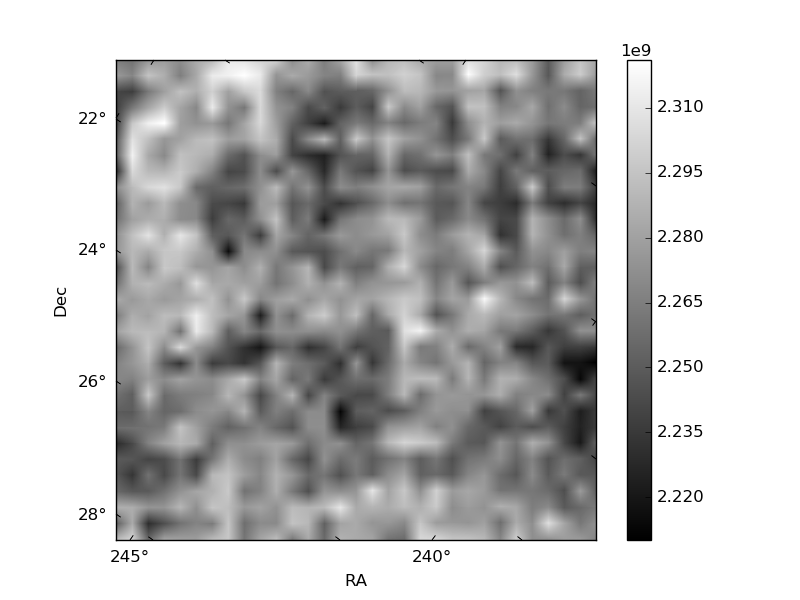
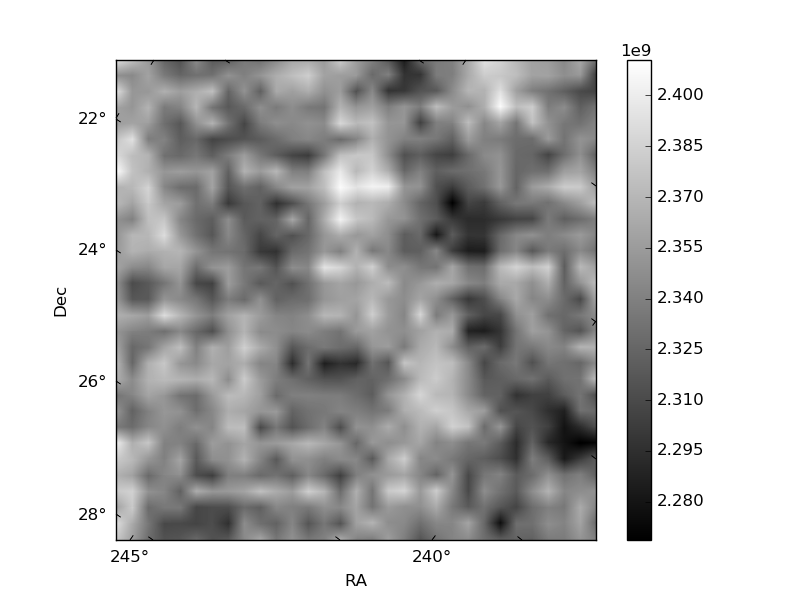
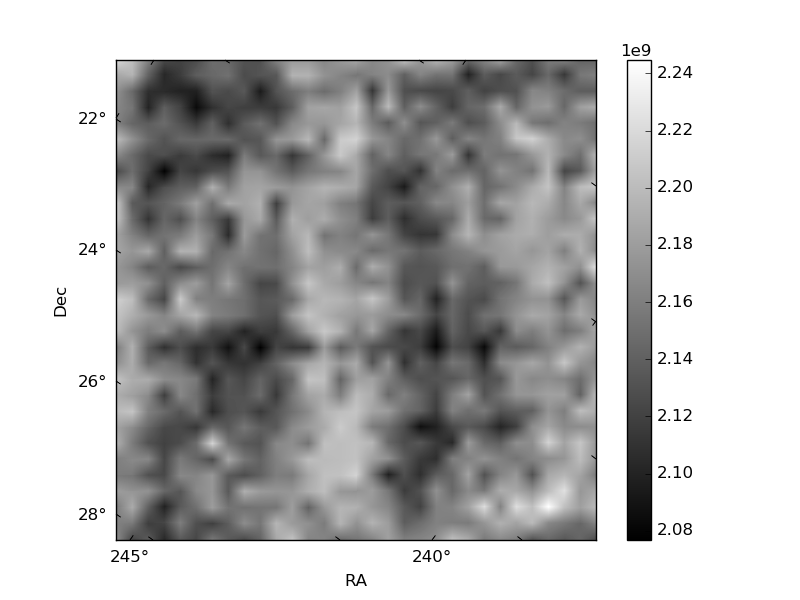
Histogram calculated using DETX and DETY for each event in the final _common_clean file
| Quadrant A | 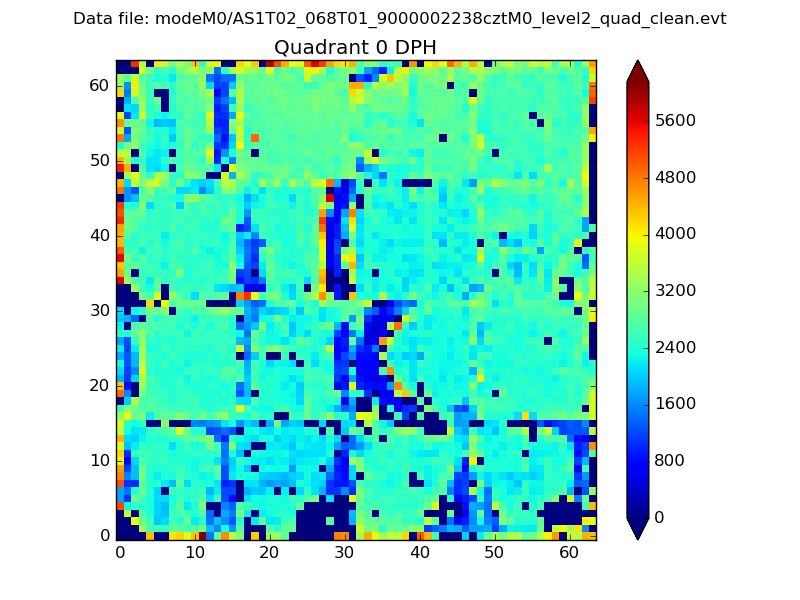 |
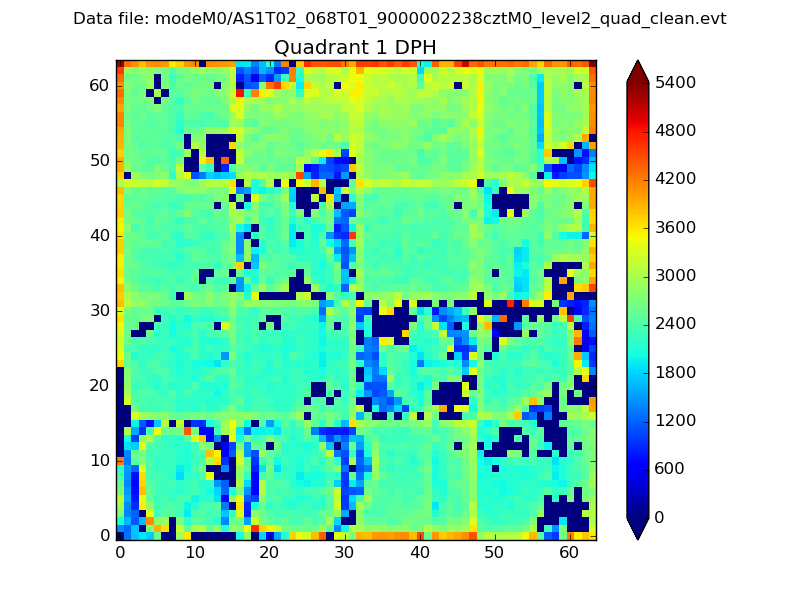 |
Quadrant B |
|---|---|---|---|
| Quadrant D | 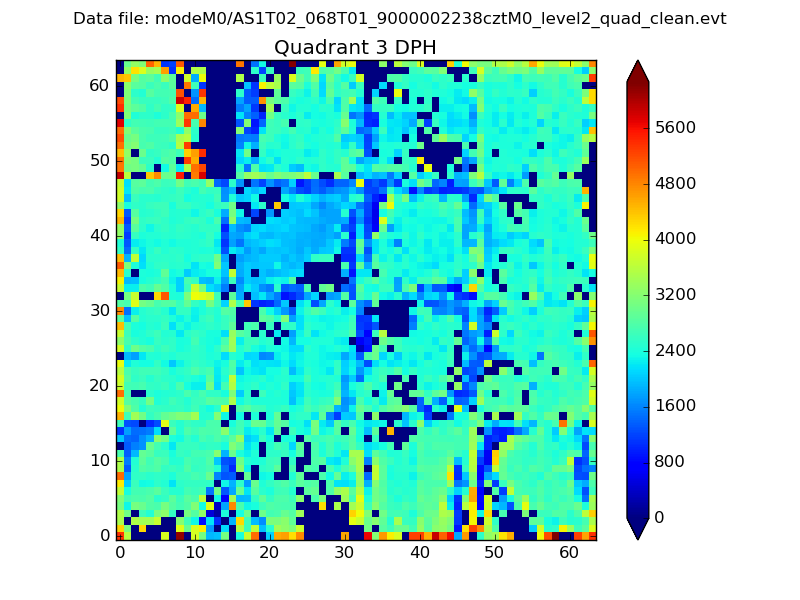 |
 |
Quadrant C |
| Plot type | Count rate plots | Images |
|---|---|---|
| Comparison with Poisson distribution Blue bars denote a histogram of data divided into 1 sec bins. Red curve is a Poisson curve with rate = median count rate of data. |
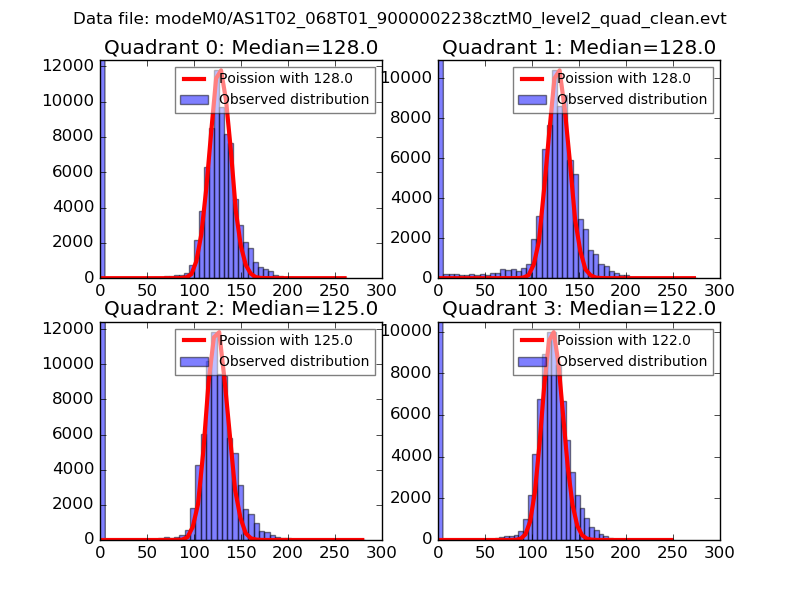 |
 |
| Quadrant-wise count rates Data is divided into 100 sec bins |
 |
|
| Module-wise count rates for Quadrant A Data is divided into 100 sec bins |
 |
 |
| Module-wise count rates for Quadrant B Data is divided into 100 sec bins |
 |
 |
| Module-wise count rates for Quadrant C Data is divided into 100 sec bins |
 |
 |
| Module-wise count rates for Quadrant D Data is divided into 100 sec bins |
 |
 |
| Parameter | Plot |
|---|---|
| CZT HV Monitor |  |
| D_VDD | 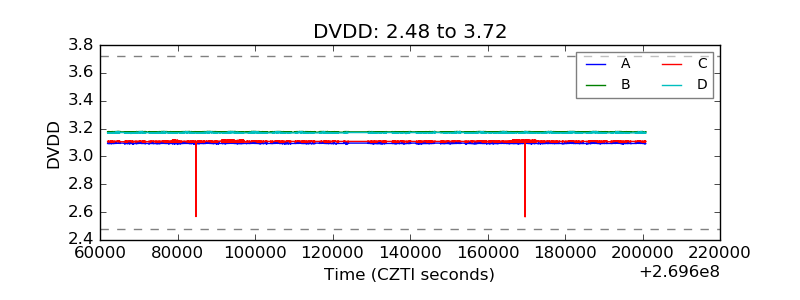 |
| Temperature 1 | 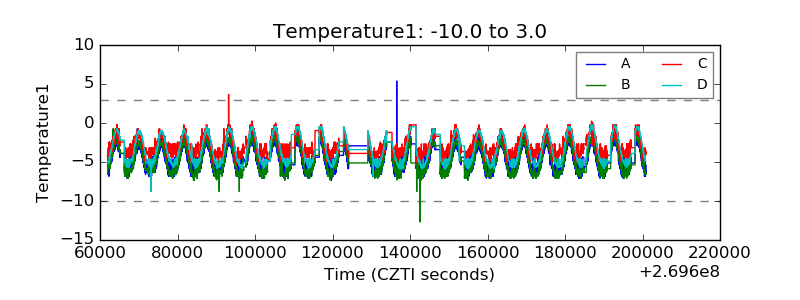 |
| Veto HV Monitor |  |
| Veto LLD |  |
| Alpha Counter | 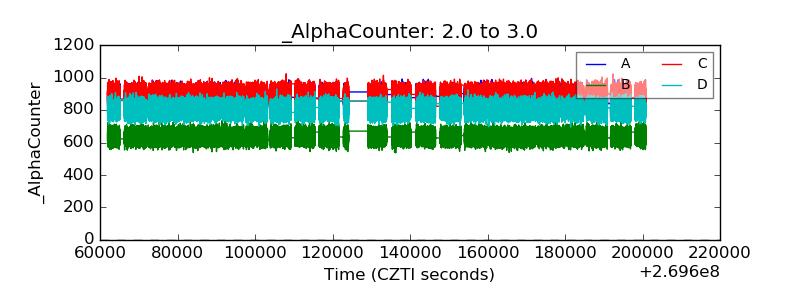 |
| _CPM_Rate |  |
| CZT Counter |  |
| +2.5 Volts monitor | 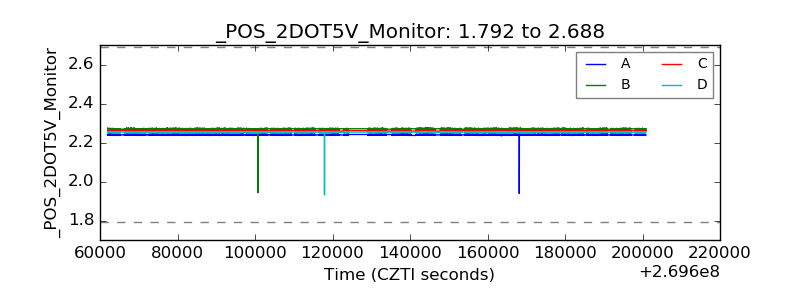 |
| +5 Volts monitor |  |
| _ROLL_ROT | 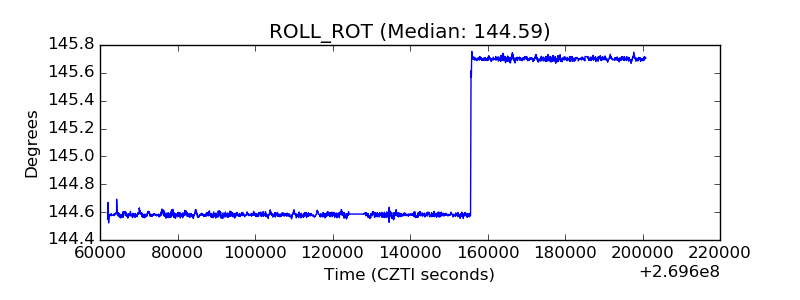 |
| _Roll_DEC | 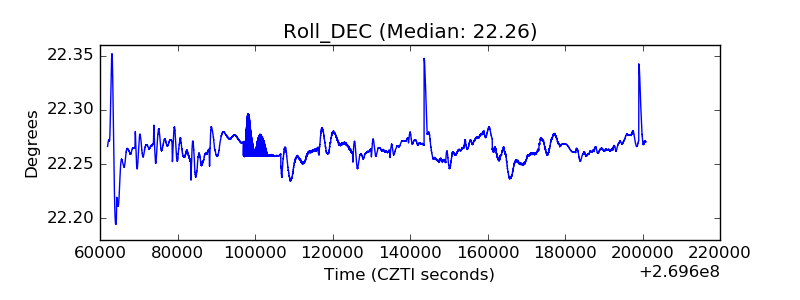 |
| _Roll_RA | 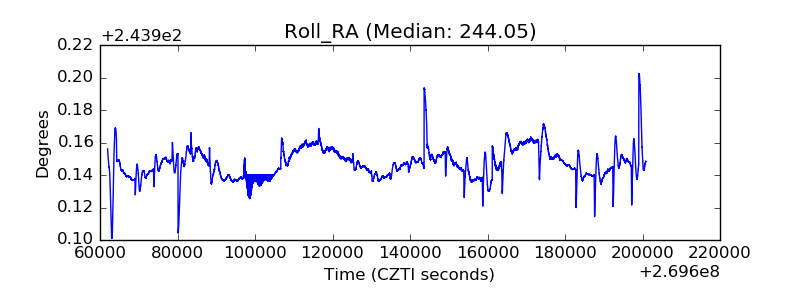 |
| Veto Counter |  |