| Param | Original file | Final file |
|---|---|---|
| Filename | modeM0/AS1T02_068T01_9000002238_15171cztM0_level2.evt | modeM0/AS1T02_068T01_9000002238_15171cztM0_level2_quad_clean.evt |
| Size (bytes) | 328,440,960 | 56,027,520 |
| Size | 313.2 MB | 53.4 MB |
| Events in quadrant A | 2,732,691 | 345,681 |
| Events in quadrant B | 2,440,745 | 347,782 |
| Events in quadrant C | 2,309,067 | 346,196 |
| Events in quadrant D | 2,149,056 | 331,594 |
| Mode M9 | |||
|---|---|---|---|
| Quadrant | BADHDUFLAG | Total packets | Discarded packets |
| A | 0 | 11 | 0 |
| B | 0 | 11 | 0 |
| C | 0 | 11 | 0 |
| D | 0 | 11 | 0 |
| Mode SS | |||
|---|---|---|---|
| Quadrant | BADHDUFLAG | Total packets | Discarded packets |
| A | 0 | 94 | 0 |
| B | 0 | 94 | 0 |
| C | 0 | 94 | 0 |
| D | 0 | 94 | 0 |
| Mode M0 | |||
|---|---|---|---|
| Quadrant | BADHDUFLAG | Total packets | Discarded packets |
| A | 0 | 11395 | 2 |
| B | 0 | 10087 | 1 |
| C | 0 | 9677 | 1 |
| D | 0 | 9551 | 1 |
| Quadrant | Total seconds | Saturated seconds | Saturation percentage |
|---|---|---|---|
| A | 4627 | 38 | 0.821266% |
| B | 4627 | 87 | 1.880268% |
| C | 4627 | 8 | 0.172898% |
| D | 4627 | 11 | 0.237735% |
Noise dominated data is calculated using 1-second bins in cleaned event files. If a bin has >2000 counts, and if more than 50% of those come from <1% of pixels, then it is considered to be noise-dominated and hence unusable.
| Quadrant | # 1 sec bins | Bins with >0 counts | Bins with >2000 counts | High rate bins dominated by noise | Noise dominated (total time) | Noise dominated (detector-on time) | Marked lightcurve |
|---|---|---|---|---|---|---|---|
| A | 5718 | 4629 | 10 | 10 | 0.17% | 0.22% | 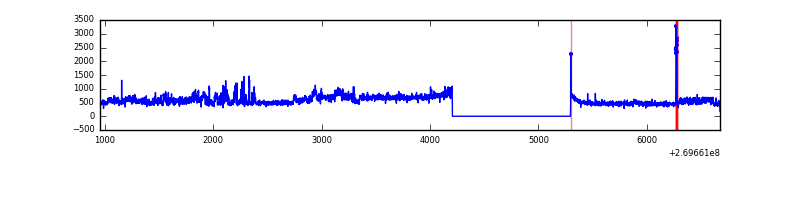 |
| B | 5718 | 4629 | 42 | 42 | 0.73% | 0.91% | 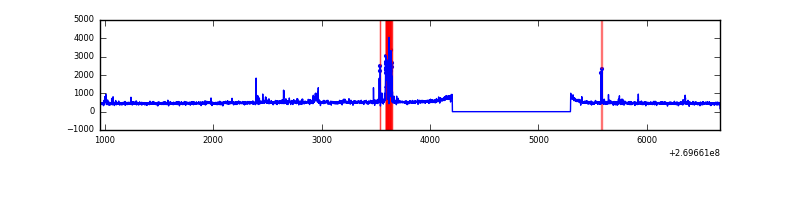 |
| C | 5718 | 4629 | 1 | 1 | 0.02% | 0.02% | 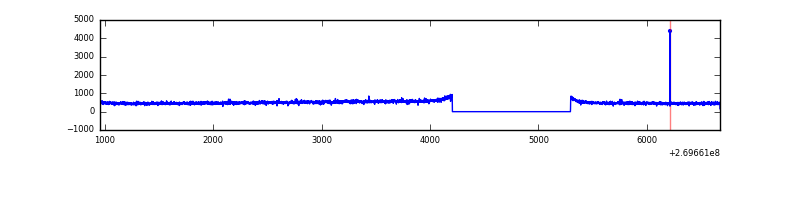 |
| D | 5718 | 4629 | 4 | 4 | 0.07% | 0.09% | 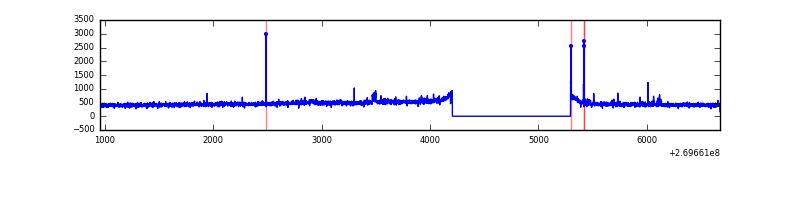 |
Top three noisy pixels from each quadrant. If the there are fewer than three noisy pixels in the level2.evt file, extra rows are filled as -1
| Pixel properties | Quadrant properties | ||||||
|---|---|---|---|---|---|---|---|
| Quadrant | DetID | PixID | Counts | Sigma | Mean | Median | Sigma |
| A | 15 | 239 | 222989 | 1914.44 | 570 | 558 | 116.2 |
| A | 0 | 253 | 191997 | 1647.7 | 570 | 558 | 116.2 |
| A | 15 | 233 | 108026 | 924.97 | 570 | 558 | 116.2 |
| B | 3 | 64 | 134561 | 1213.93 | 569 | 554 | 110.4 |
| B | 0 | 189 | 43903 | 392.68 | 569 | 554 | 110.4 |
| B | 12 | 111 | 12630 | 109.39 | 569 | 554 | 110.4 |
| C | 3 | 233 | 128506 | 987.61 | 557 | 560 | 129.6 |
| C | 14 | 234 | 5449 | 37.74 | 557 | 560 | 129.6 |
| C | 13 | 61 | 4026 | 26.75 | 557 | 560 | 129.6 |
| D | 2 | 16 | 29964 | 218.47 | 554 | 537 | 134.7 |
| D | 2 | 234 | 15466 | 110.84 | 554 | 537 | 134.7 |
| D | 13 | 172 | 8383 | 58.25 | 554 | 537 | 134.7 |
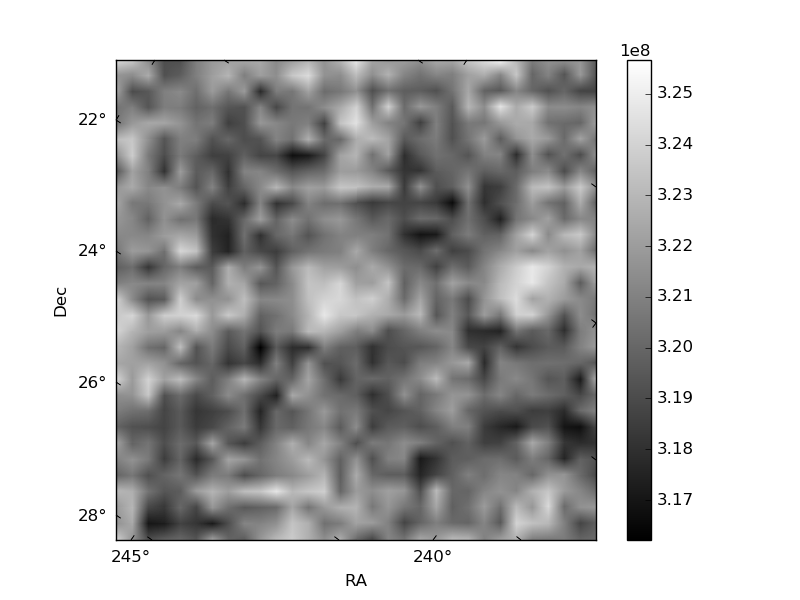
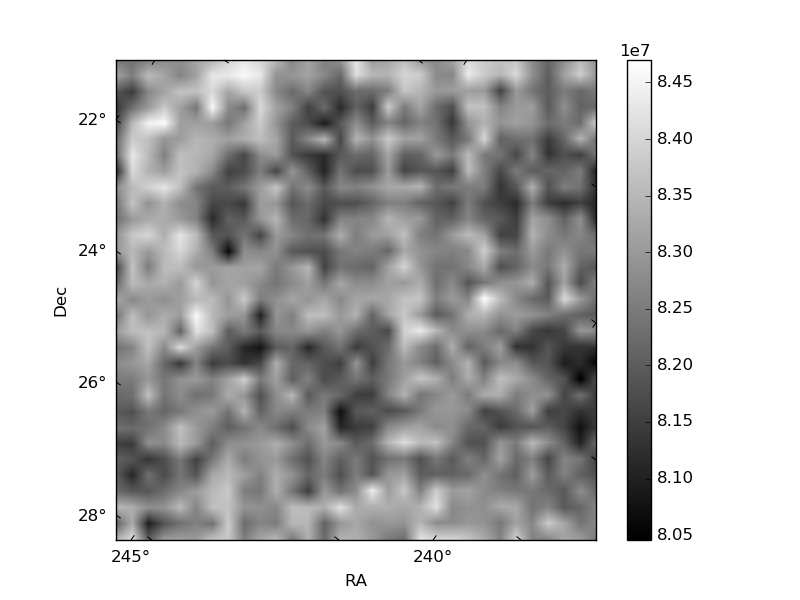
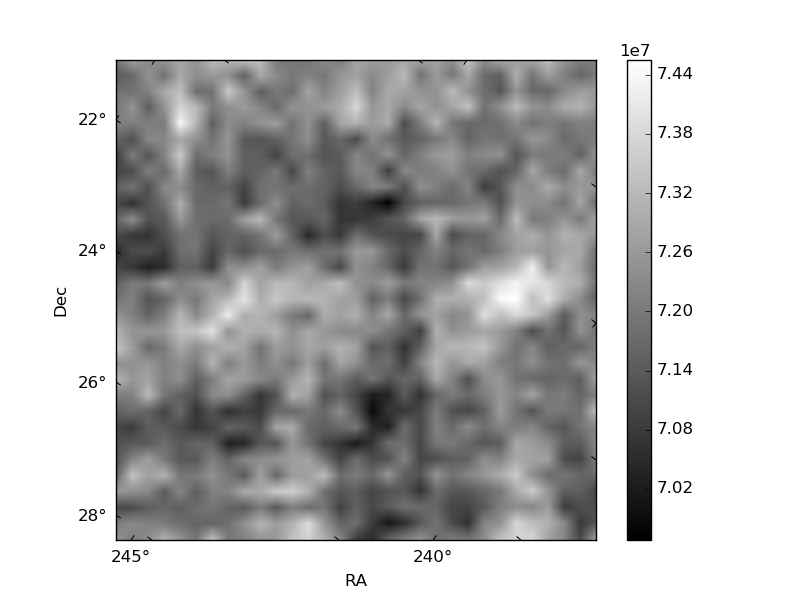
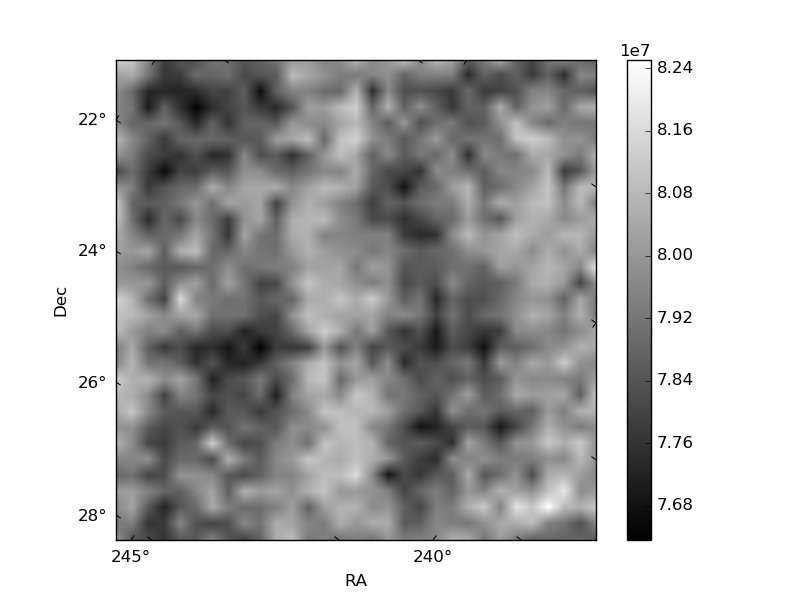
Histogram calculated using DETX and DETY for each event in the final _common_clean file
| Quadrant A | 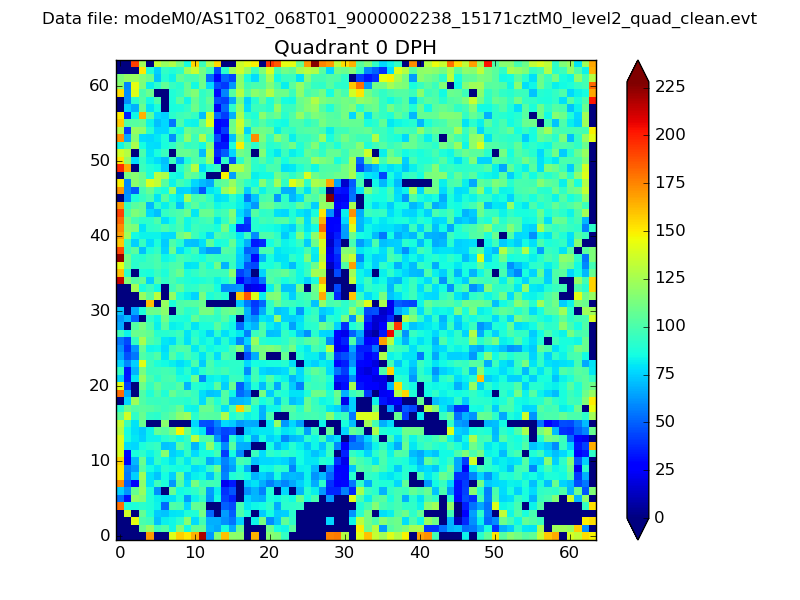 |
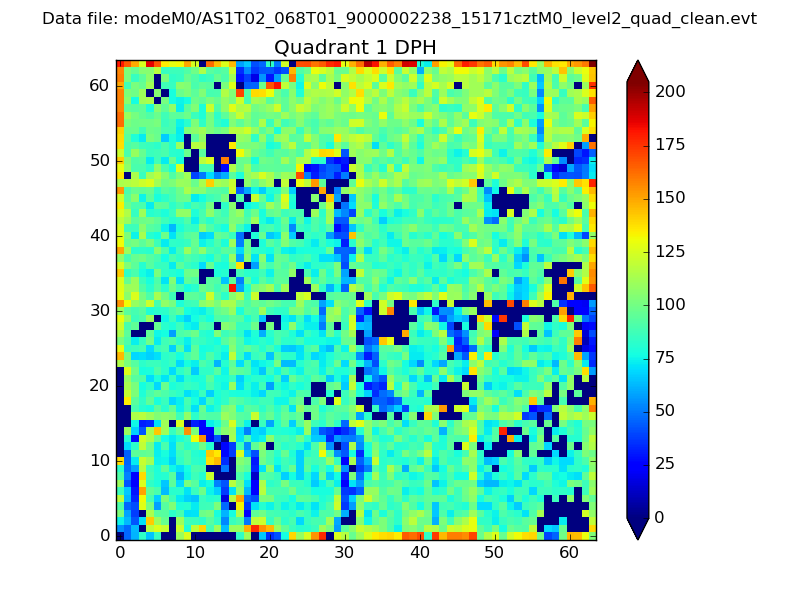 |
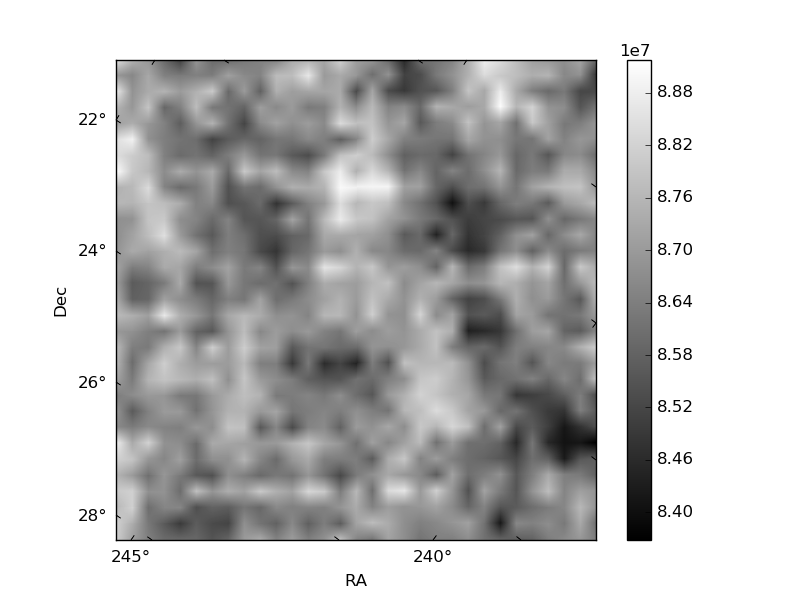
Quadrant B |
|---|---|---|---|
| Quadrant D | 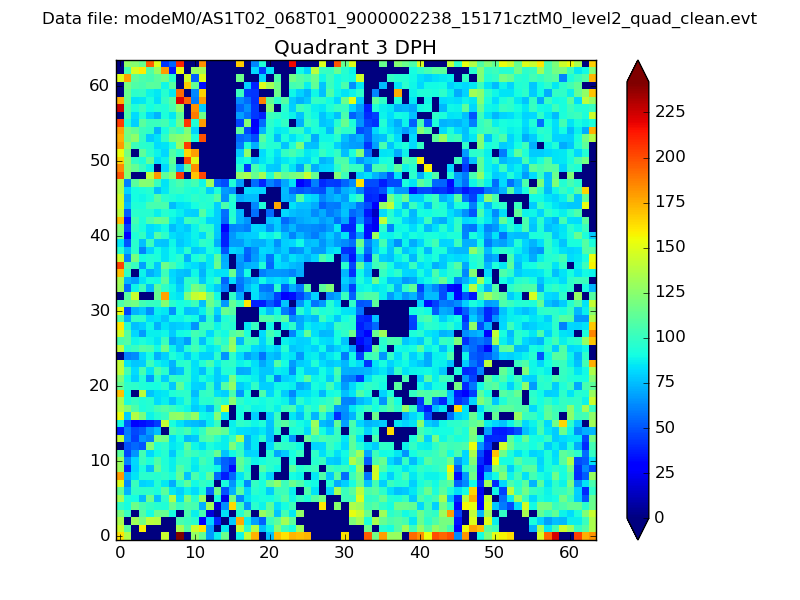 |
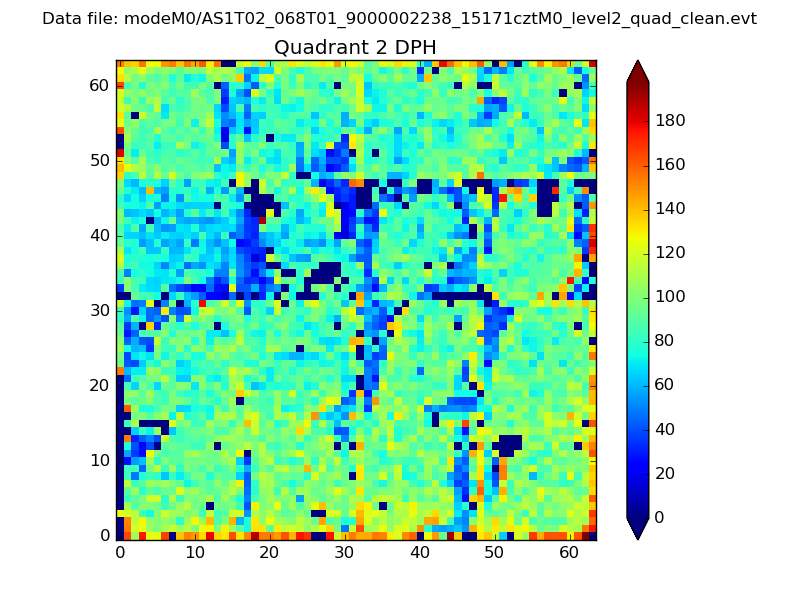 |
Quadrant C |
| Plot type | Count rate plots | Images |
|---|---|---|
| Comparison with Poisson distribution Blue bars denote a histogram of data divided into 1 sec bins. Red curve is a Poisson curve with rate = median count rate of data. |
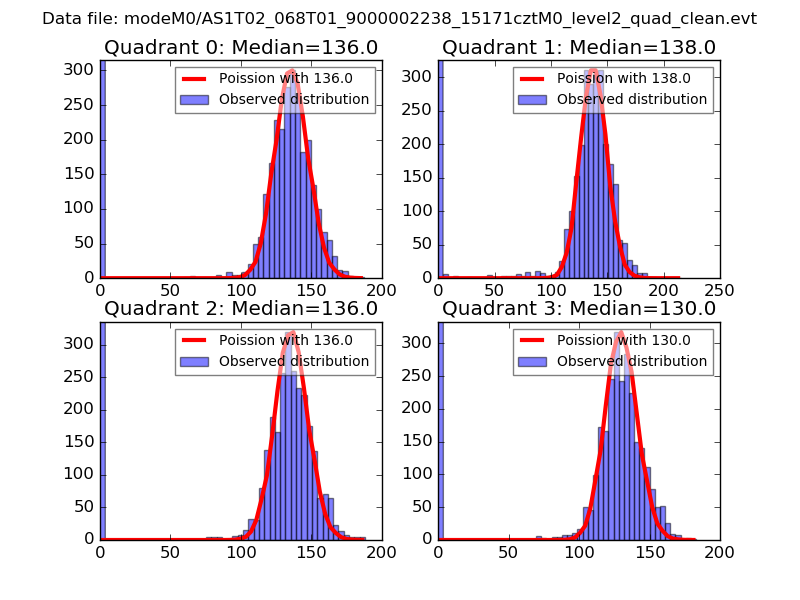 |
 |
| Quadrant-wise count rates Data is divided into 100 sec bins |
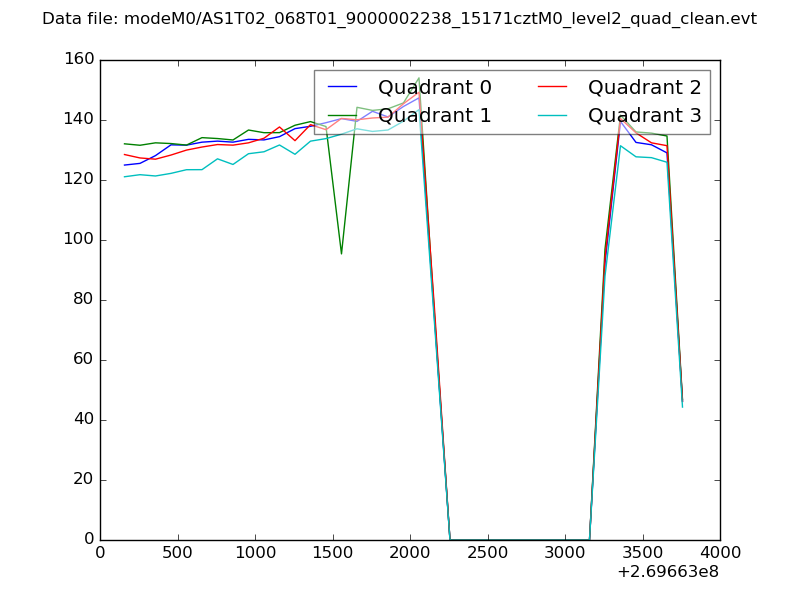 |
|
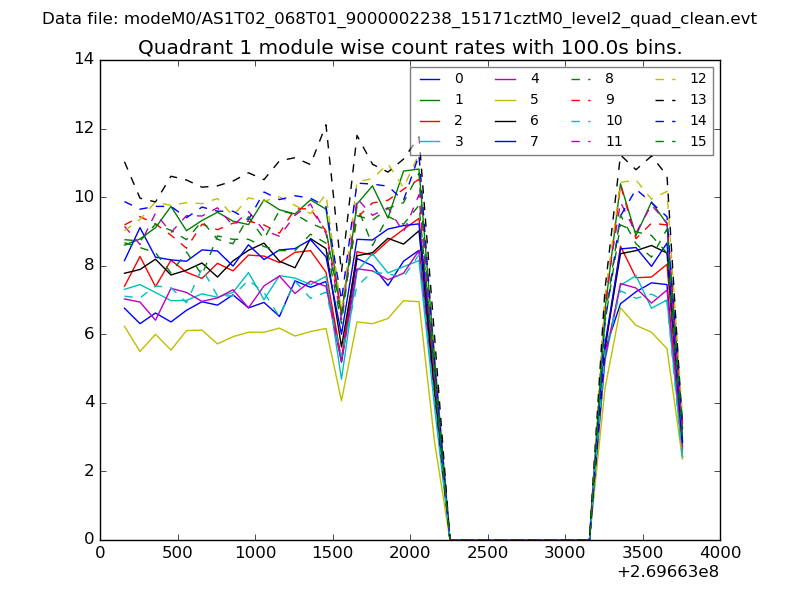
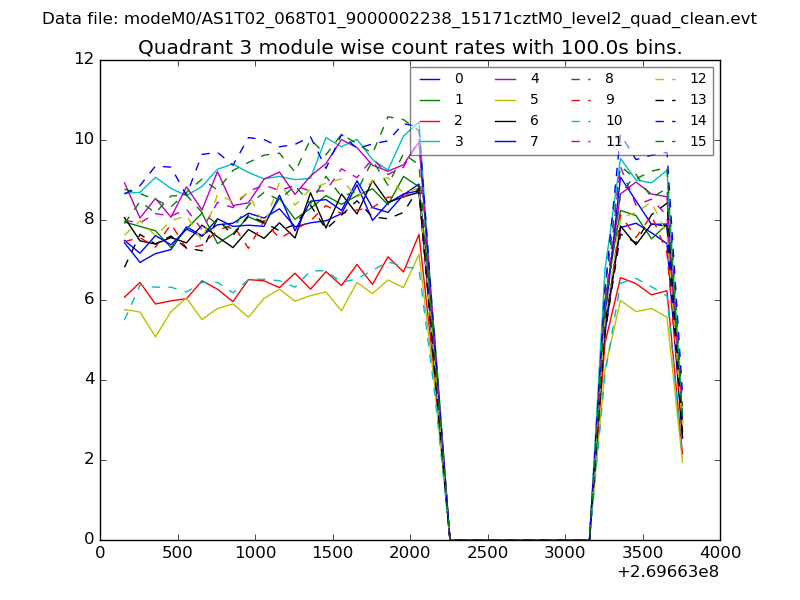
| Module-wise count rates for Quadrant A Data is divided into 100 sec bins |
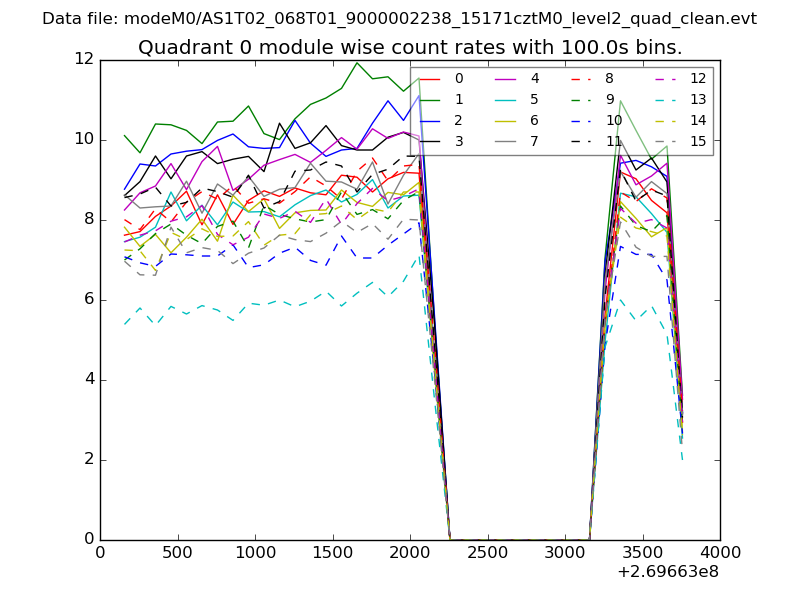 |
 |
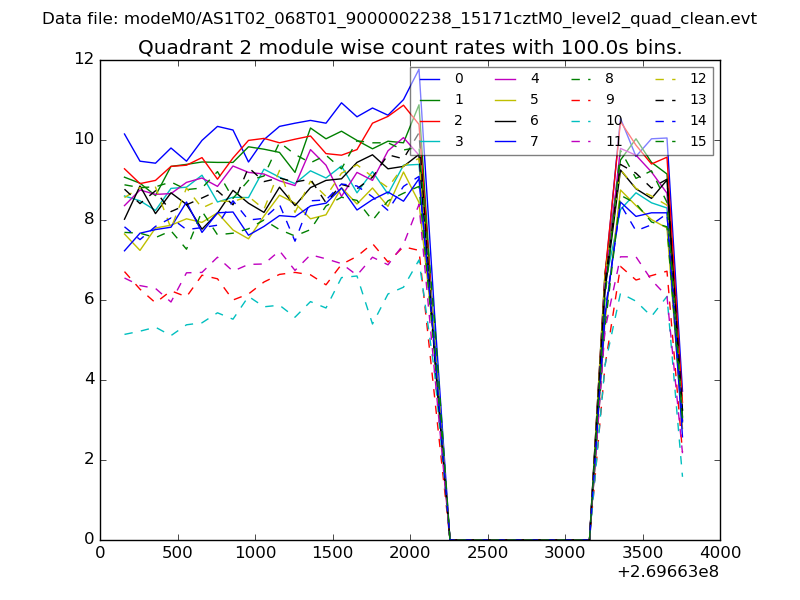
| Module-wise count rates for Quadrant B Data is divided into 100 sec bins |
 |
 |
| Module-wise count rates for Quadrant C Data is divided into 100 sec bins |
 |
 |
| Module-wise count rates for Quadrant D Data is divided into 100 sec bins |
 |
 |
| Parameter | Plot |
|---|---|
| CZT HV Monitor | 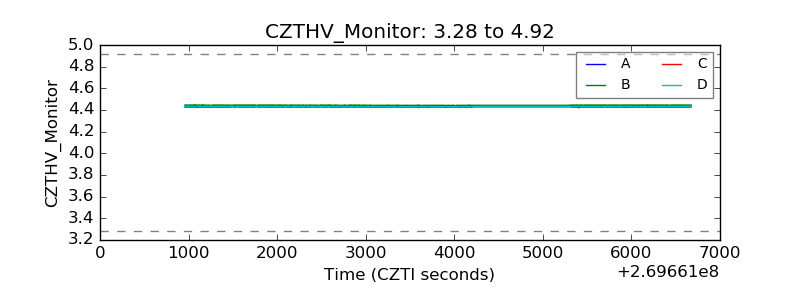 |
| D_VDD | 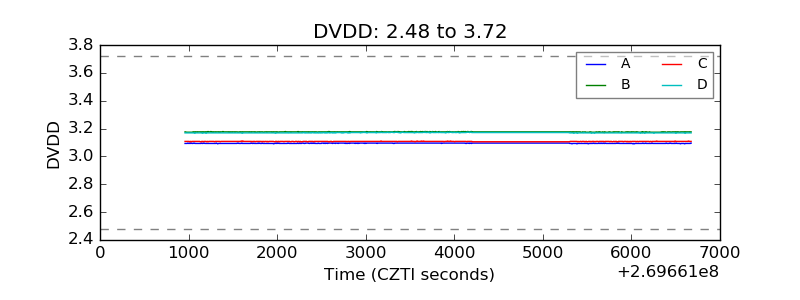 |
| Temperature 1 | 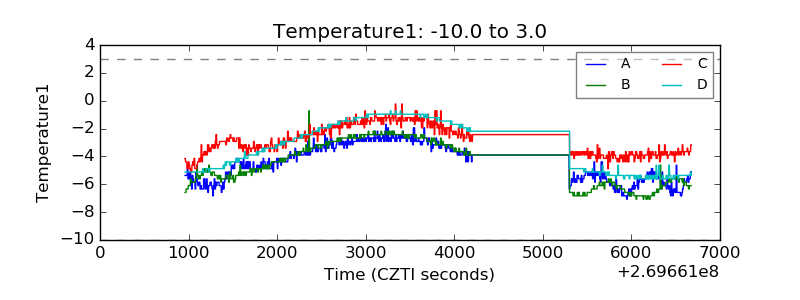 |
| Veto HV Monitor | 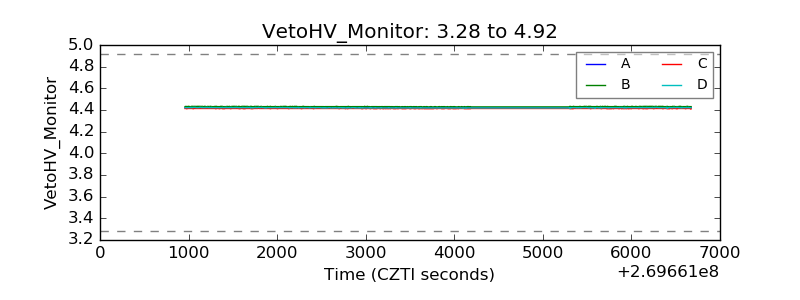 |
| Veto LLD | 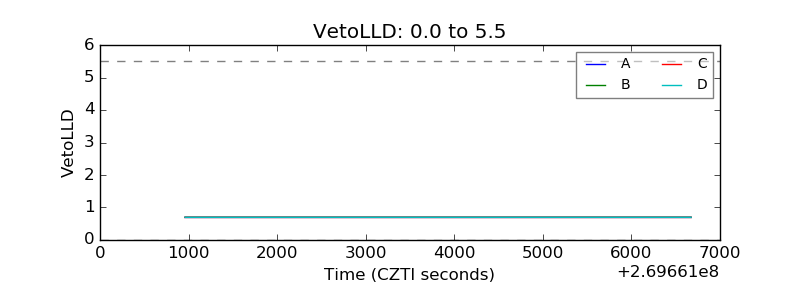 |
| Alpha Counter | 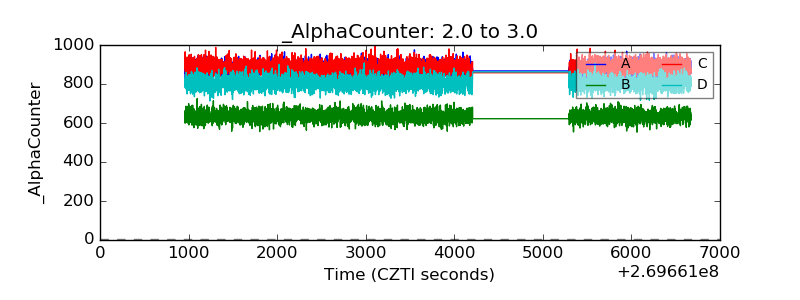 |
| _CPM_Rate | 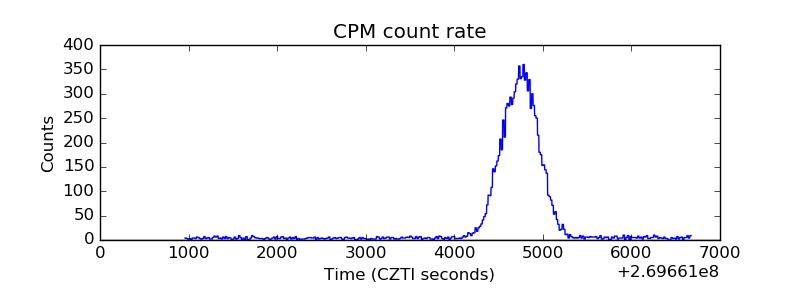 |
| CZT Counter | 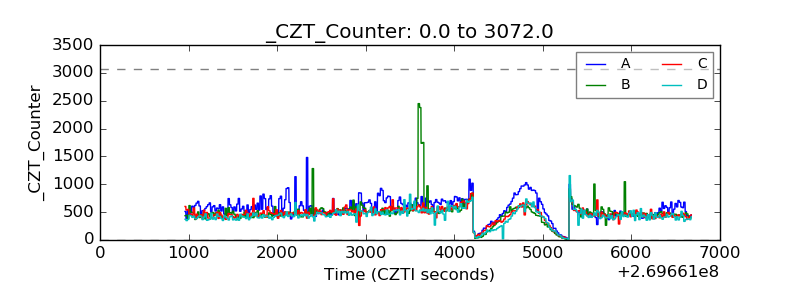 |
| +2.5 Volts monitor |  |
| +5 Volts monitor | 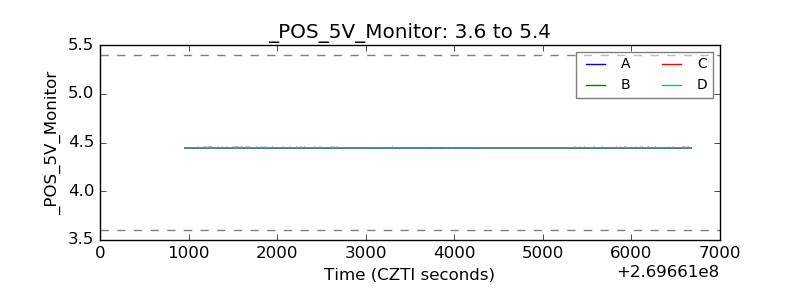 |
| _ROLL_ROT | 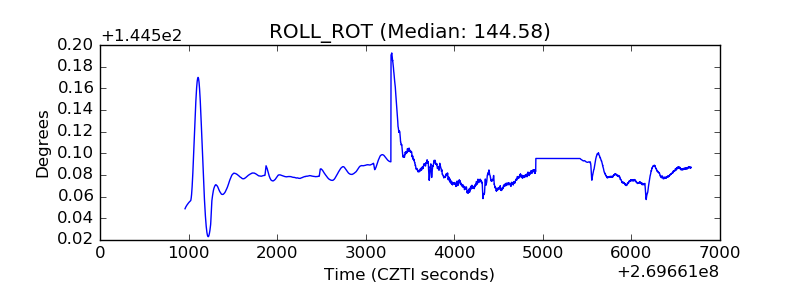 |
| _Roll_DEC | 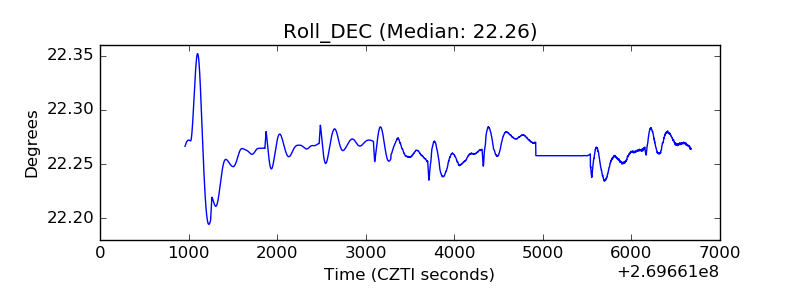 |
| _Roll_RA |  |
| Veto Counter | 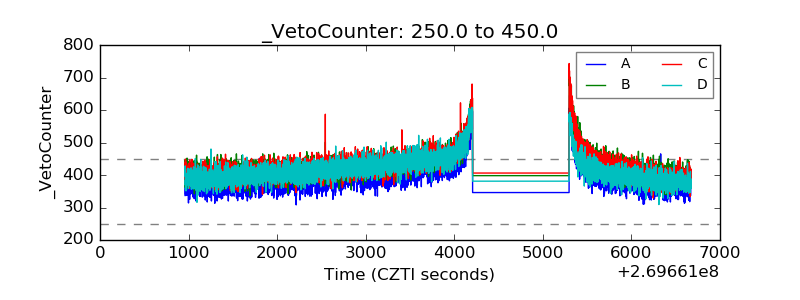 |