| Param | Original file | Final file |
|---|---|---|
| Filename | modeM0/AS1T02_068T01_9000002238_15172cztM0_level2.evt | modeM0/AS1T02_068T01_9000002238_15172cztM0_level2_quad_clean.evt |
| Size (bytes) | 506,168,640 | 77,394,240 |
| Size | 482.7 MB | 73.8 MB |
| Events in quadrant A | 3,831,883 | 467,293 |
| Events in quadrant B | 3,455,549 | 474,812 |
| Events in quadrant C | 3,530,503 | 465,494 |
| Events in quadrant D | 4,036,709 | 448,908 |
| Mode M9 | |||
|---|---|---|---|
| Quadrant | BADHDUFLAG | Total packets | Discarded packets |
| A | 0 | 15 | 0 |
| B | 0 | 15 | 0 |
| C | 0 | 15 | 0 |
| D | 0 | 16 | 0 |
| Mode SS | |||
|---|---|---|---|
| Quadrant | BADHDUFLAG | Total packets | Discarded packets |
| A | 0 | 140 | 0 |
| B | 0 | 140 | 0 |
| C | 0 | 140 | 0 |
| D | 0 | 140 | 0 |
| Mode M0 | |||
|---|---|---|---|
| Quadrant | BADHDUFLAG | Total packets | Discarded packets |
| A | 0 | 16101 | 3 |
| B | 0 | 14663 | 2 |
| C | 0 | 14907 | 2 |
| D | 0 | 16875 | 2 |
| Quadrant | Total seconds | Saturated seconds | Saturation percentage |
|---|---|---|---|
| A | 6998 | 139 | 1.986282% |
| B | 6998 | 140 | 2.000572% |
| C | 6998 | 78 | 1.114604% |
| D | 6998 | 294 | 4.201200% |
Noise dominated data is calculated using 1-second bins in cleaned event files. If a bin has >2000 counts, and if more than 50% of those come from <1% of pixels, then it is considered to be noise-dominated and hence unusable.
| Quadrant | # 1 sec bins | Bins with >0 counts | Bins with >2000 counts | High rate bins dominated by noise | Noise dominated (total time) | Noise dominated (detector-on time) | Marked lightcurve |
|---|---|---|---|---|---|---|---|
| A | 7594 | 7000 | 19 | 19 | 0.25% | 0.27% | 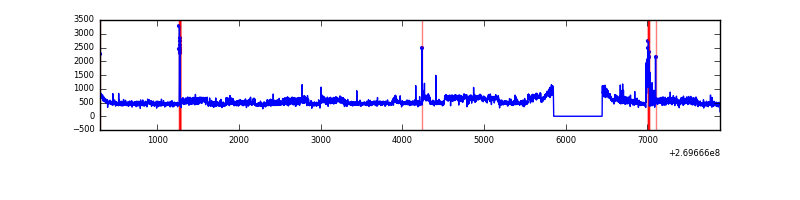 |
| B | 7594 | 7000 | 4 | 4 | 0.05% | 0.06% | 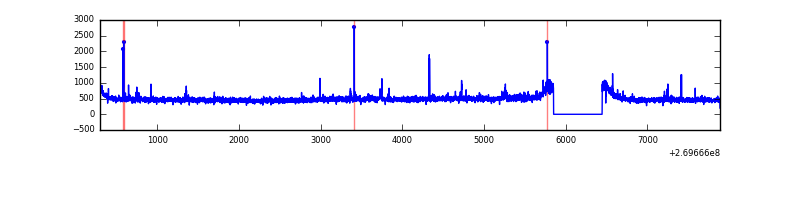 |
| C | 7594 | 7000 | 1 | 1 | 0.01% | 0.01% | 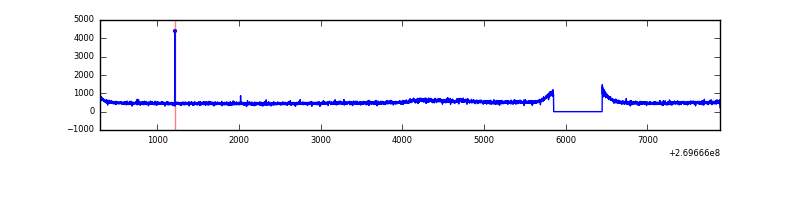 |
| D | 7594 | 7000 | 205 | 205 | 2.70% | 2.93% | 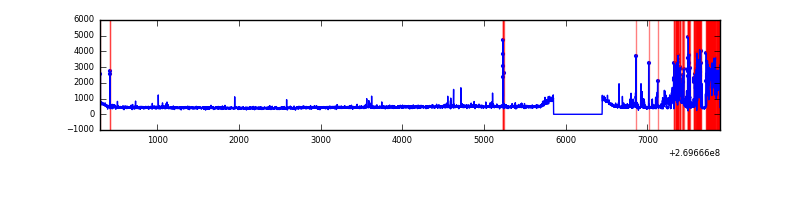 |
Top three noisy pixels from each quadrant. If the there are fewer than three noisy pixels in the level2.evt file, extra rows are filled as -1
| Pixel properties | Quadrant properties | ||||||
|---|---|---|---|---|---|---|---|
| Quadrant | DetID | PixID | Counts | Sigma | Mean | Median | Sigma |
| A | 15 | 239 | 420814 | 2429.86 | 852 | 832 | 172.8 |
| A | 9 | 143 | 76163 | 435.84 | 852 | 832 | 172.8 |
| A | 0 | 253 | 39593 | 224.26 | 852 | 832 | 172.8 |
| B | 3 | 64 | 40725 | 238.46 | 859 | 838 | 167.3 |
| B | 0 | 189 | 25428 | 147.01 | 859 | 838 | 167.3 |
| B | 12 | 111 | 20025 | 114.71 | 859 | 838 | 167.3 |
| C | 3 | 233 | 273686 | 1410.42 | 834 | 840 | 193.4 |
| C | 14 | 234 | 6243 | 27.93 | 834 | 840 | 193.4 |
| C | 13 | 61 | 5937 | 26.35 | 834 | 840 | 193.4 |
| D | 2 | 33 | 815346 | 4055.69 | 820 | 794 | 200.8 |
| D | 2 | 16 | 39680 | 193.62 | 820 | 794 | 200.8 |
| D | 12 | 222 | 36220 | 176.39 | 820 | 794 | 200.8 |
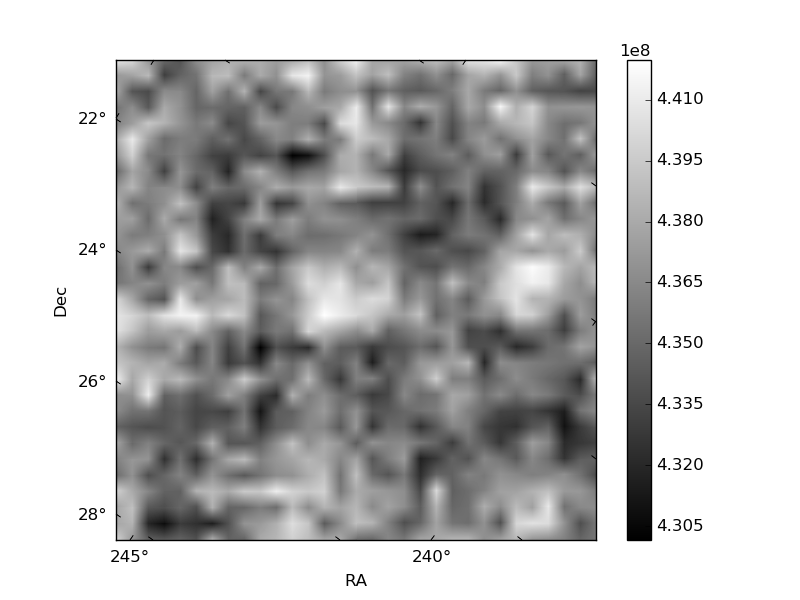
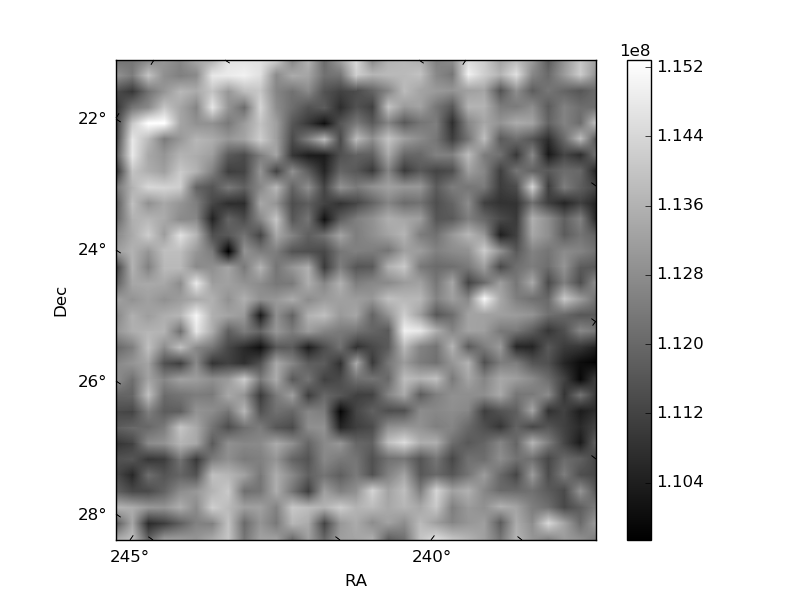
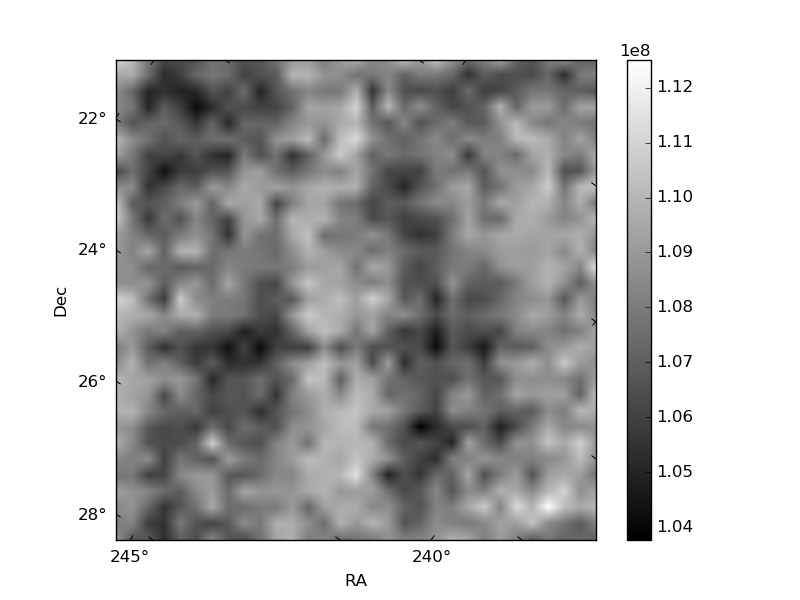
Histogram calculated using DETX and DETY for each event in the final _common_clean file
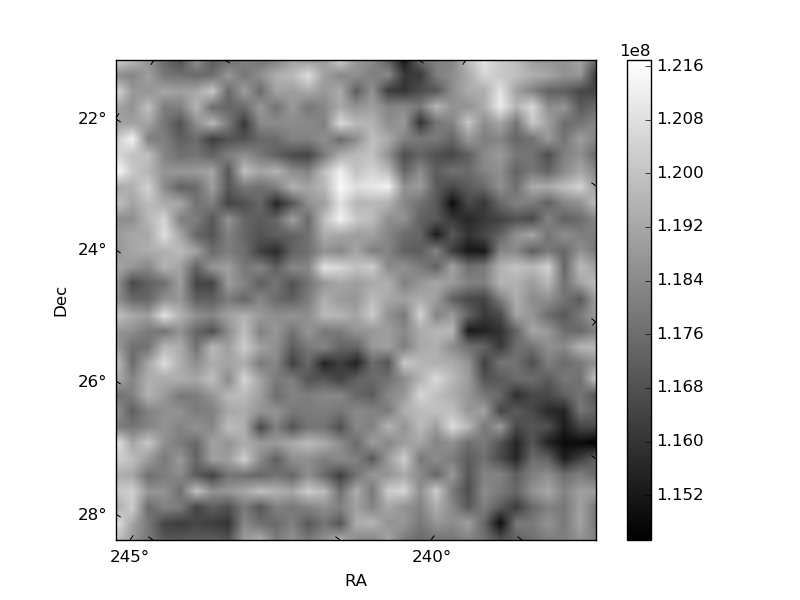
| Quadrant A | 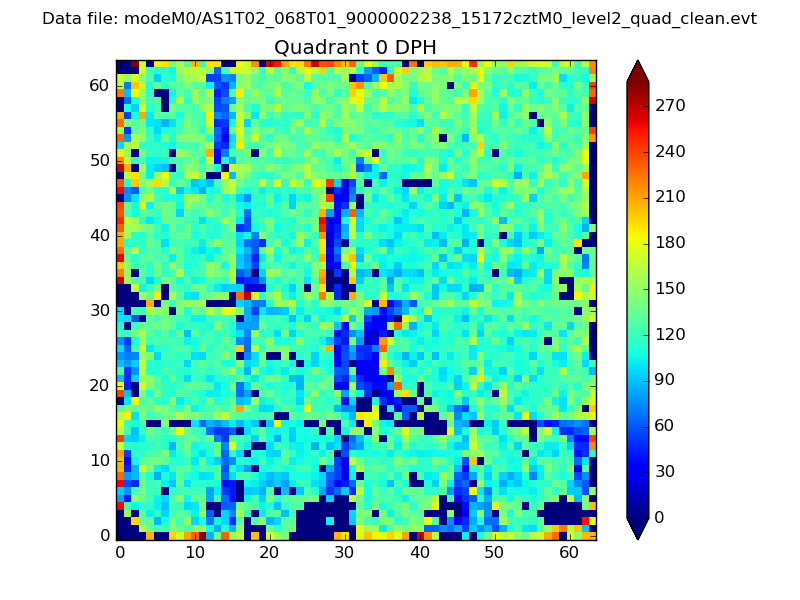 |
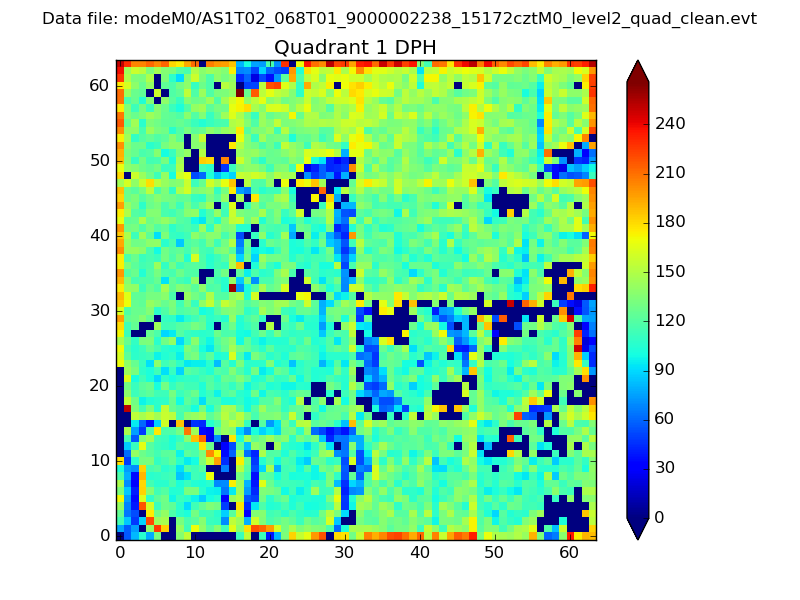 |
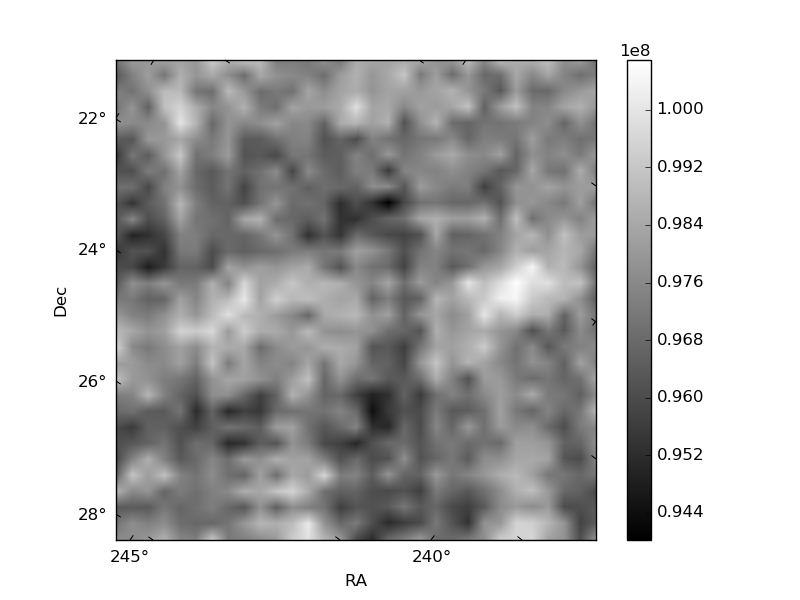
Quadrant B |
|---|---|---|---|
| Quadrant D | 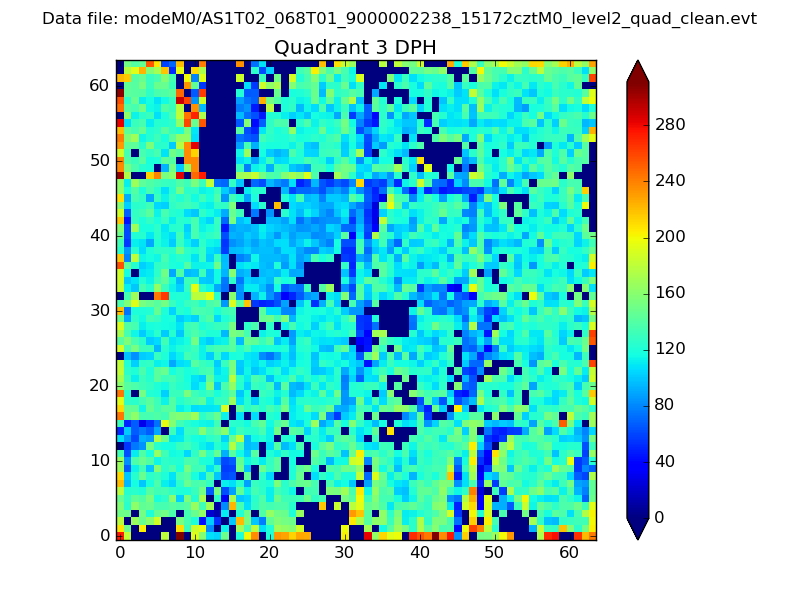 |
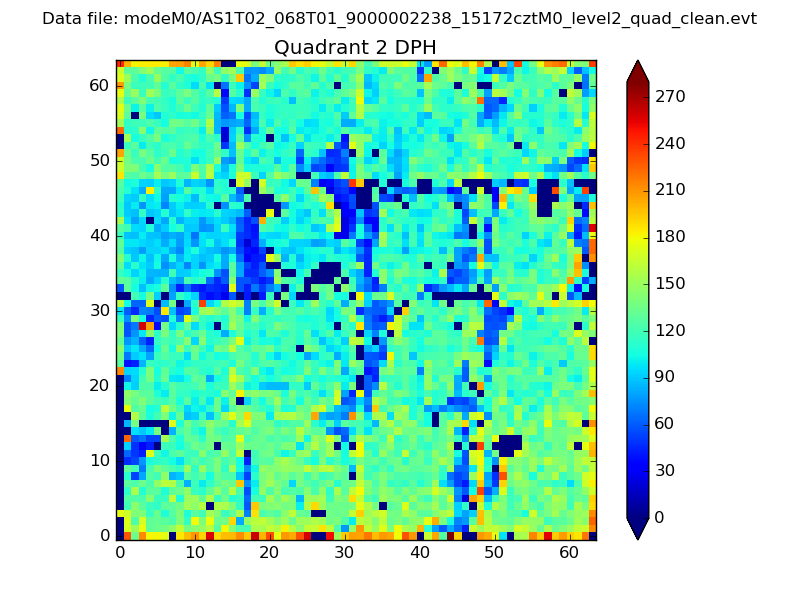 |
Quadrant C |
| Plot type | Count rate plots | Images |
|---|---|---|
| Comparison with Poisson distribution Blue bars denote a histogram of data divided into 1 sec bins. Red curve is a Poisson curve with rate = median count rate of data. |
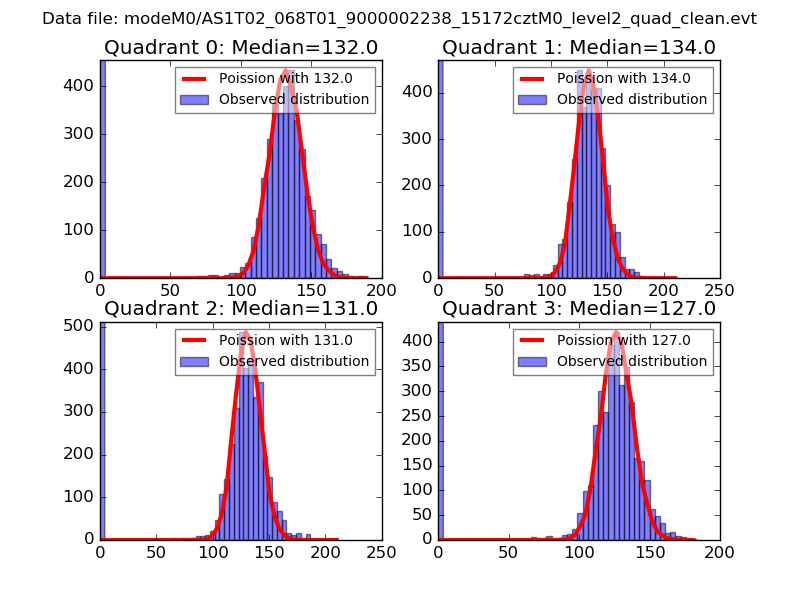 |
 |
| Quadrant-wise count rates Data is divided into 100 sec bins |
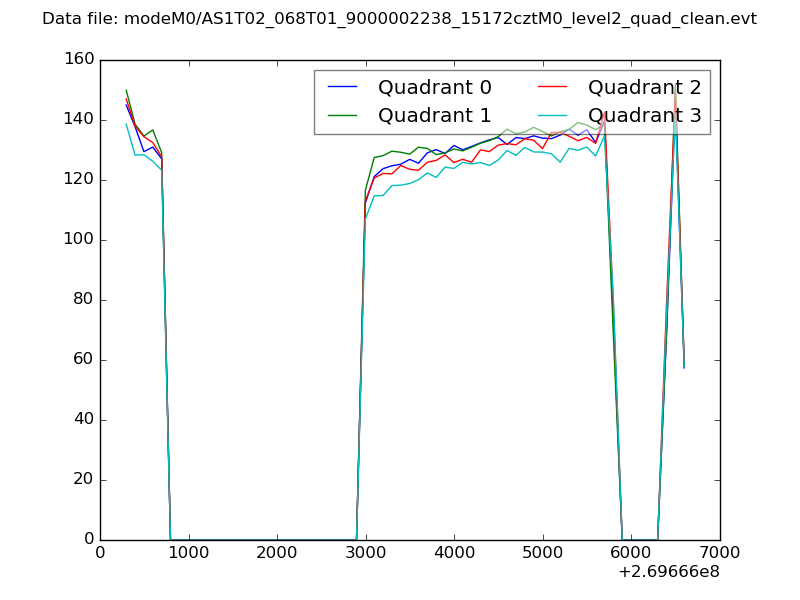 |
|
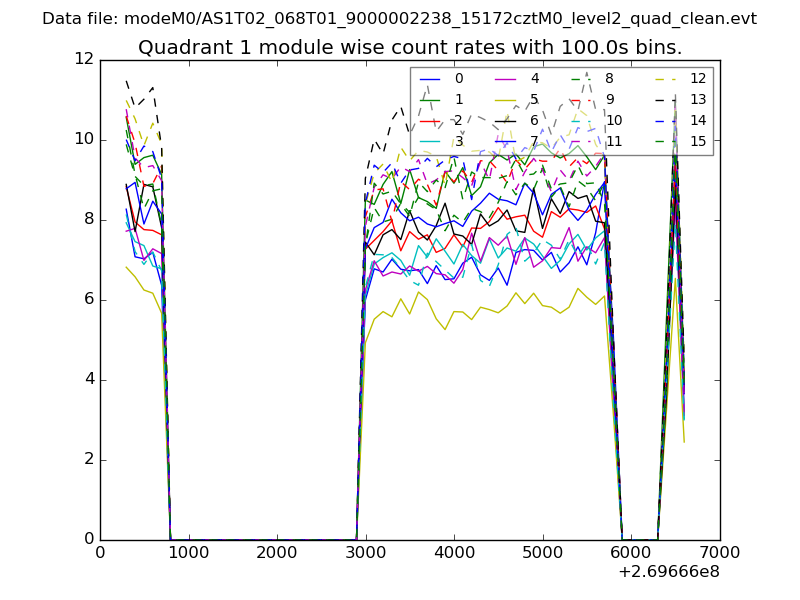
| Module-wise count rates for Quadrant A Data is divided into 100 sec bins |
 |
 |
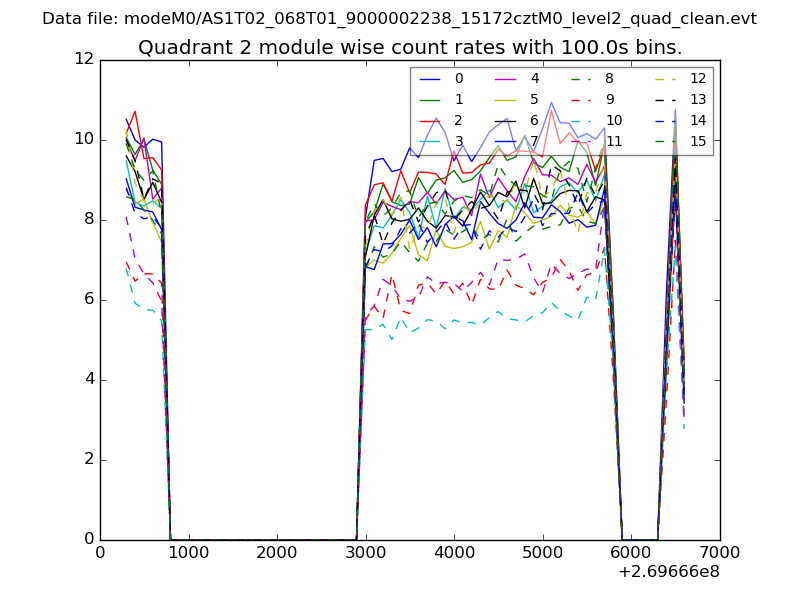
| Module-wise count rates for Quadrant B Data is divided into 100 sec bins |
 |
 |
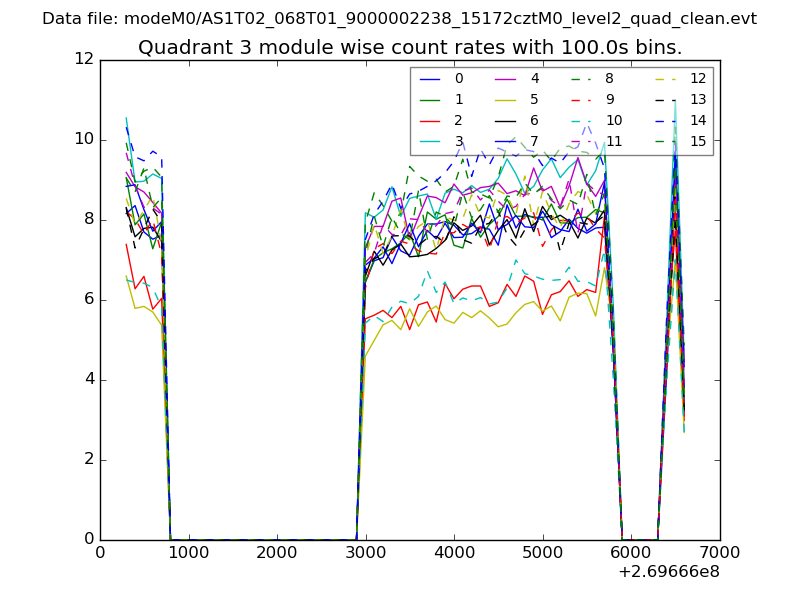
| Module-wise count rates for Quadrant C Data is divided into 100 sec bins |
 |
 |
| Module-wise count rates for Quadrant D Data is divided into 100 sec bins |
 |
 |
| Parameter | Plot |
|---|---|
| CZT HV Monitor | 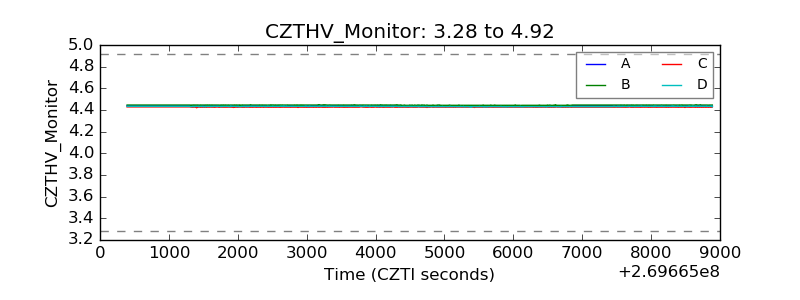 |
| D_VDD | 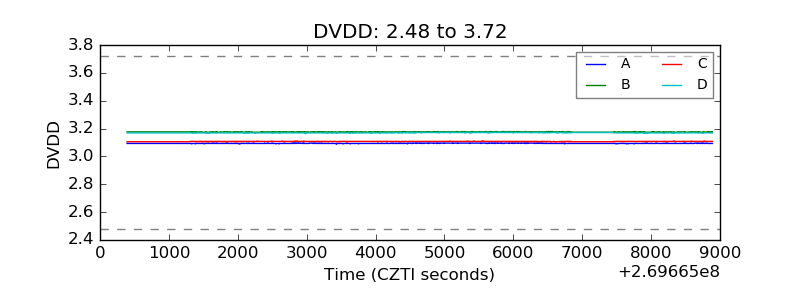 |
| Temperature 1 | 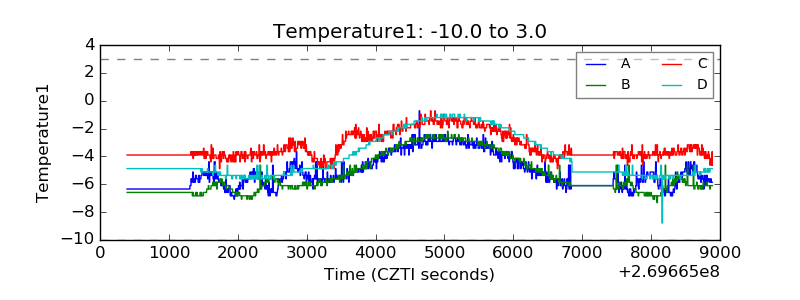 |
| Veto HV Monitor | 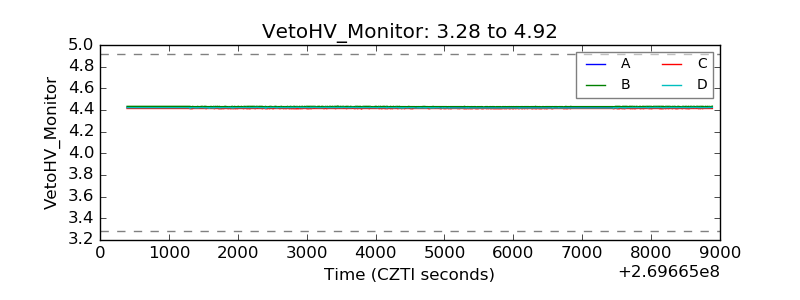 |
| Veto LLD | 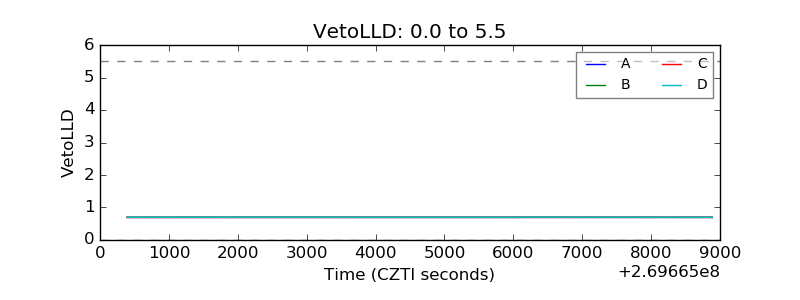 |
| Alpha Counter | 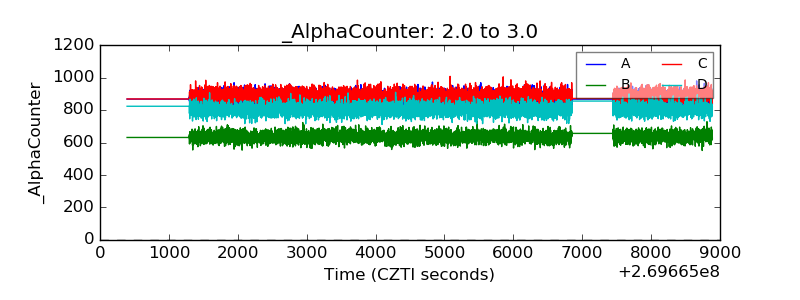 |
| _CPM_Rate | 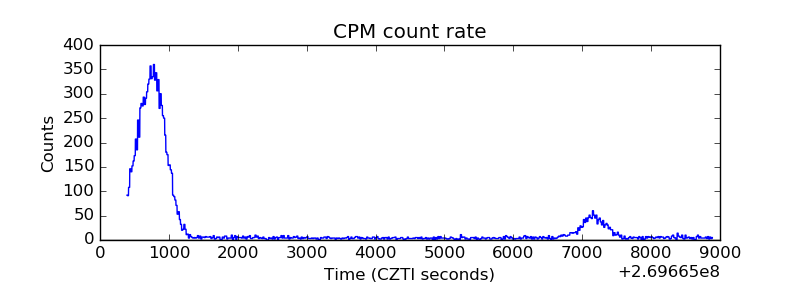 |
| CZT Counter | 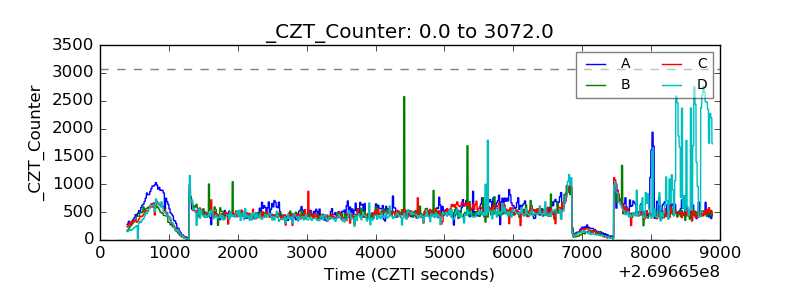 |
| +2.5 Volts monitor |  |
| +5 Volts monitor |  |
| _ROLL_ROT | 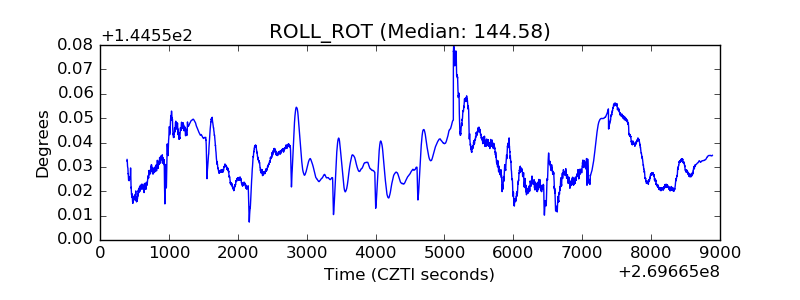 |
| _Roll_DEC | 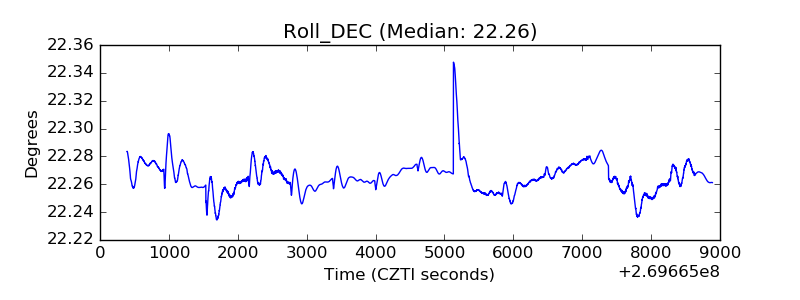 |
| _Roll_RA | 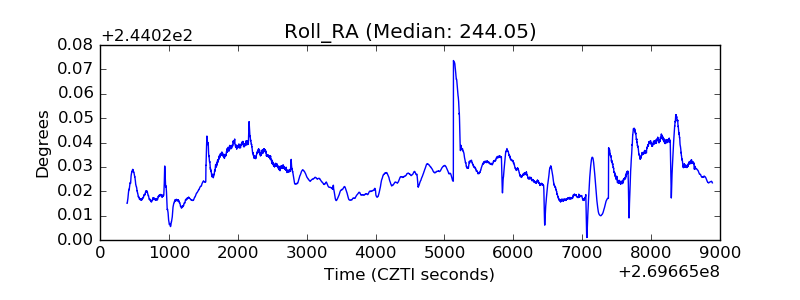 |
| Veto Counter |  |