| Param | Original file | Final file |
|---|---|---|
| Filename | modeM0/AS1T02_068T01_9000002238_15173cztM0_level2.evt | modeM0/AS1T02_068T01_9000002238_15173cztM0_level2_quad_clean.evt |
| Size (bytes) | 595,298,880 | 77,163,840 |
| Size | 567.7 MB | 73.6 MB |
| Events in quadrant A | 3,952,861 | 460,888 |
| Events in quadrant B | 3,632,310 | 467,931 |
| Events in quadrant C | 4,132,209 | 455,882 |
| Events in quadrant D | 5,810,560 | 437,908 |
| Mode M9 | |||
|---|---|---|---|
| Quadrant | BADHDUFLAG | Total packets | Discarded packets |
| A | 0 | 1 | 0 |
| B | 0 | 1 | 0 |
| C | 0 | 1 | 0 |
| D | 0 | 1 | 0 |
| Mode SS | |||
|---|---|---|---|
| Quadrant | BADHDUFLAG | Total packets | Discarded packets |
| A | 0 | 150 | 0 |
| B | 0 | 150 | 0 |
| C | 0 | 150 | 0 |
| D | 0 | 150 | 0 |
| Mode M0 | |||
|---|---|---|---|
| Quadrant | BADHDUFLAG | Total packets | Discarded packets |
| A | 0 | 16641 | 2 |
| B | 0 | 15468 | 1 |
| C | 0 | 16662 | 1 |
| D | 0 | 22364 | 1 |
| Quadrant | Total seconds | Saturated seconds | Saturation percentage |
|---|---|---|---|
| A | 7380 | 264 | 3.577236% |
| B | 7380 | 262 | 3.550136% |
| C | 7380 | 181 | 2.452575% |
| D | 7380 | 863 | 11.693767% |
Noise dominated data is calculated using 1-second bins in cleaned event files. If a bin has >2000 counts, and if more than 50% of those come from <1% of pixels, then it is considered to be noise-dominated and hence unusable.
| Quadrant | # 1 sec bins | Bins with >0 counts | Bins with >2000 counts | High rate bins dominated by noise | Noise dominated (total time) | Noise dominated (detector-on time) | Marked lightcurve |
|---|---|---|---|---|---|---|---|
| A | 7496 | 7382 | 8 | 8 | 0.11% | 0.11% | 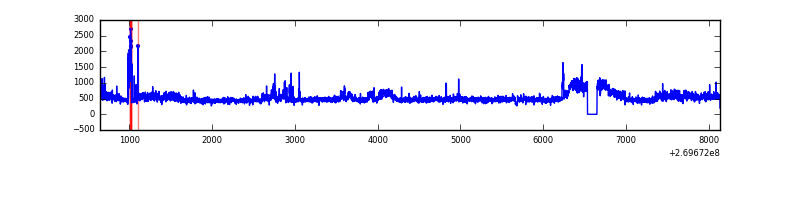 |
| B | 7496 | 7382 | 4 | 4 | 0.05% | 0.05% | 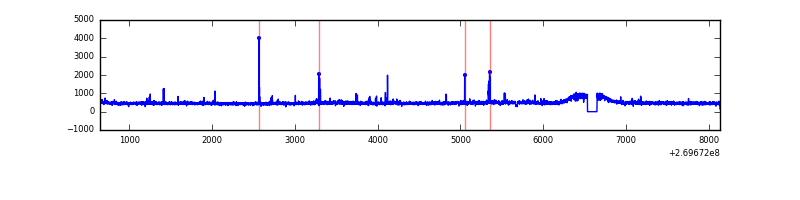 |
| C | 7496 | 7382 | 1 | 1 | 0.01% | 0.01% | 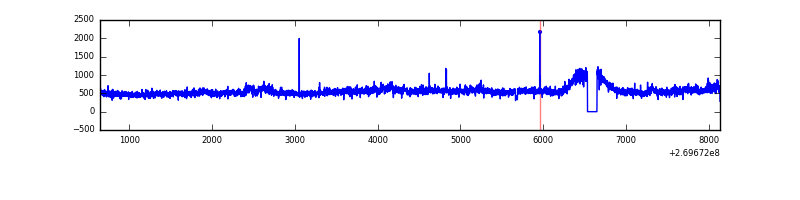 |
| D | 7496 | 7382 | 649 | 649 | 8.66% | 8.79% | 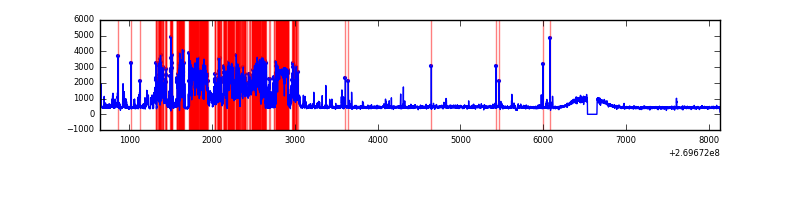 |
Top three noisy pixels from each quadrant. If the there are fewer than three noisy pixels in the level2.evt file, extra rows are filled as -1
| Pixel properties | Quadrant properties | ||||||
|---|---|---|---|---|---|---|---|
| Quadrant | DetID | PixID | Counts | Sigma | Mean | Median | Sigma |
| A | 15 | 239 | 330608 | 1790.72 | 899 | 877 | 184.1 |
| A | 9 | 143 | 89685 | 482.3 | 899 | 877 | 184.1 |
| A | 12 | 189 | 43795 | 233.08 | 899 | 877 | 184.1 |
| B | 3 | 64 | 34716 | 190.97 | 903 | 876 | 177.2 |
| B | 0 | 189 | 25991 | 141.73 | 903 | 876 | 177.2 |
| B | 12 | 111 | 21126 | 114.28 | 903 | 876 | 177.2 |
| C | 3 | 233 | 685868 | 3330.48 | 880 | 883 | 205.7 |
| C | 14 | 234 | 7042 | 29.95 | 880 | 883 | 205.7 |
| C | 13 | 61 | 6257 | 26.13 | 880 | 883 | 205.7 |
| D | 2 | 33 | 2486544 | 11963.25 | 851 | 826 | 207.8 |
| D | 12 | 222 | 30132 | 141.04 | 851 | 826 | 207.8 |
| D | 2 | 16 | 28650 | 133.91 | 851 | 826 | 207.8 |
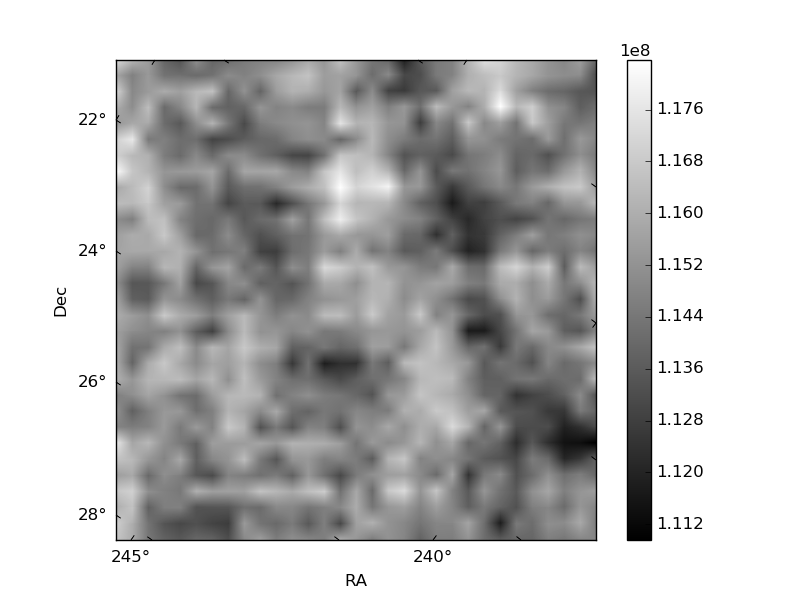
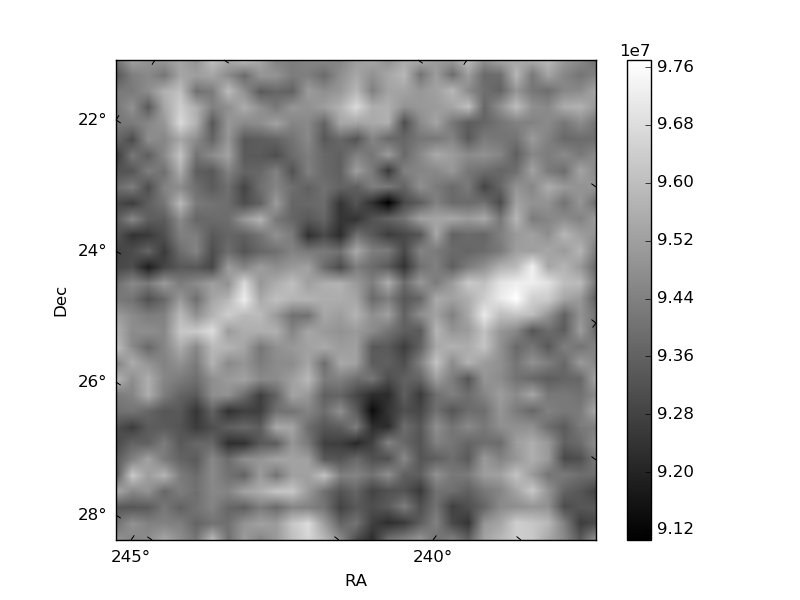
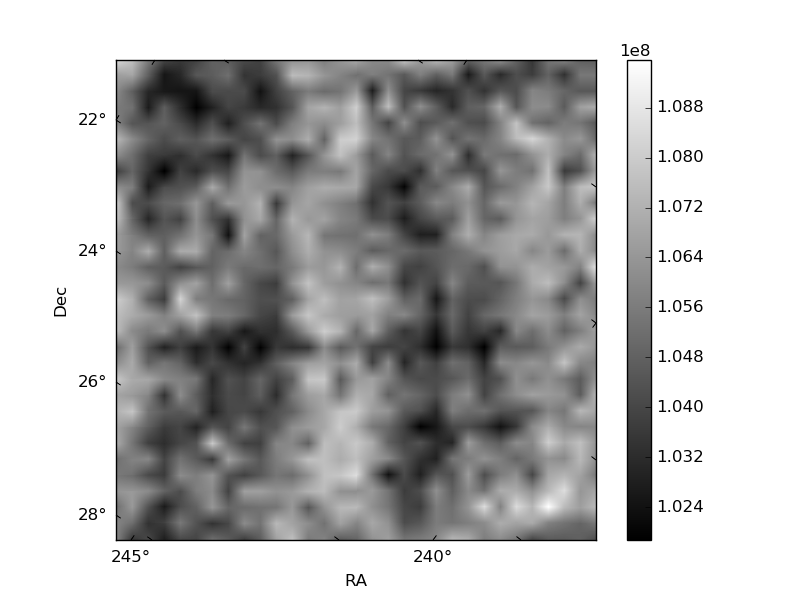
Histogram calculated using DETX and DETY for each event in the final _common_clean file
| Quadrant A | 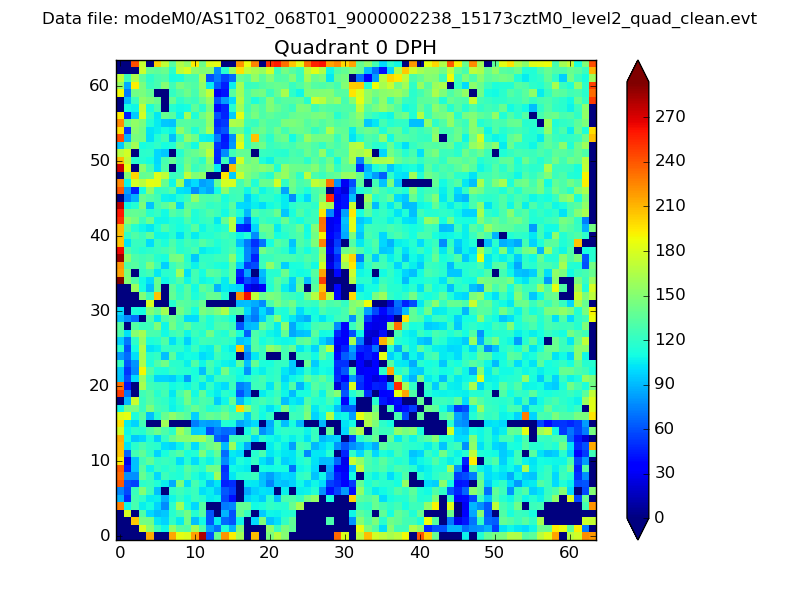 |
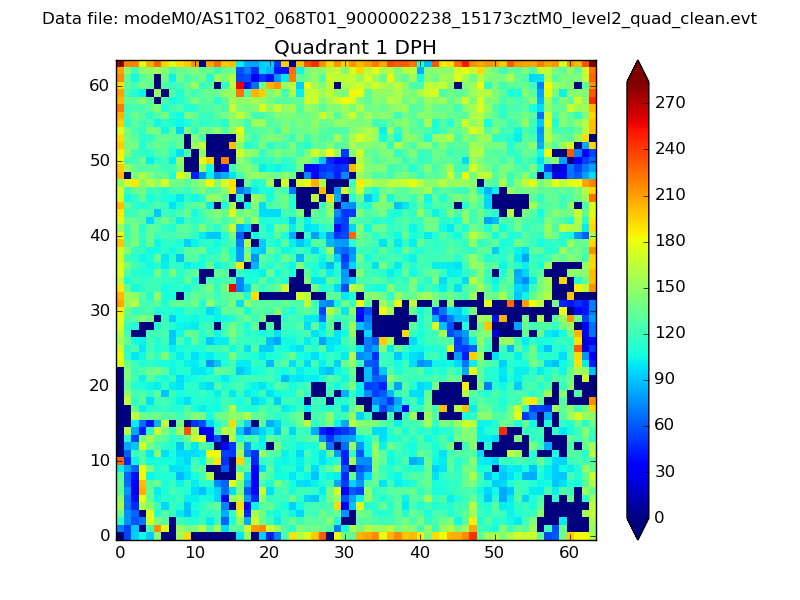 |
Quadrant B |
|---|---|---|---|
| Quadrant D | 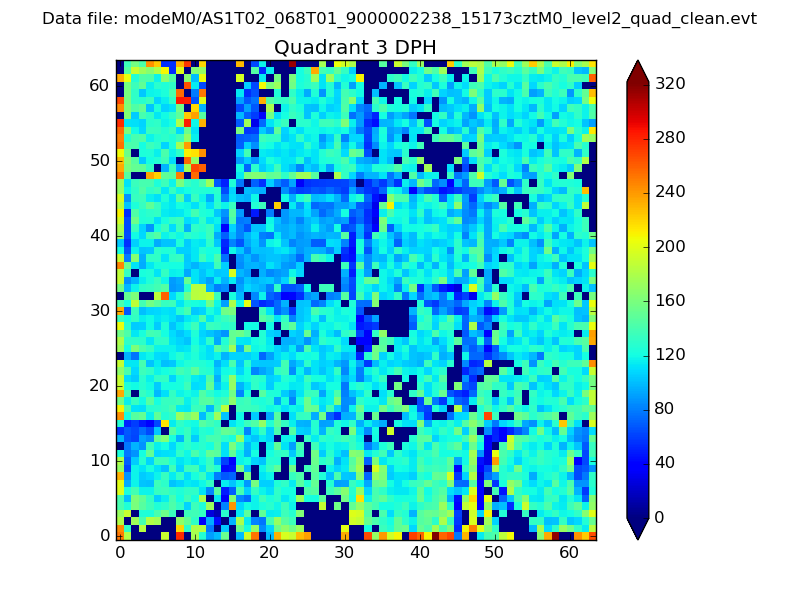 |
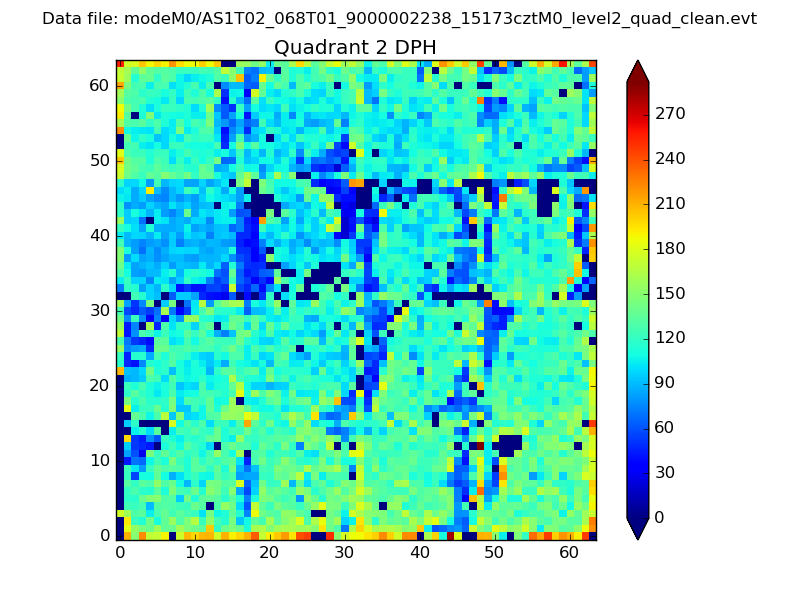 |
Quadrant C |
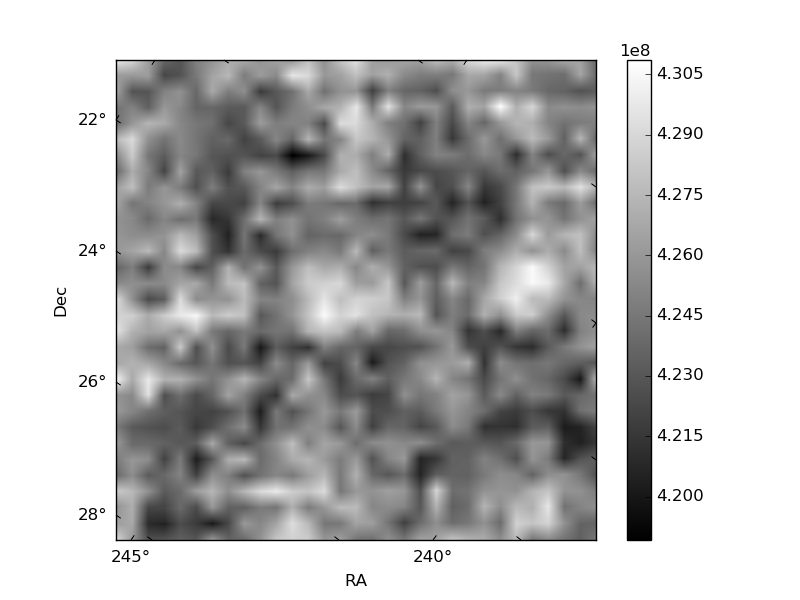
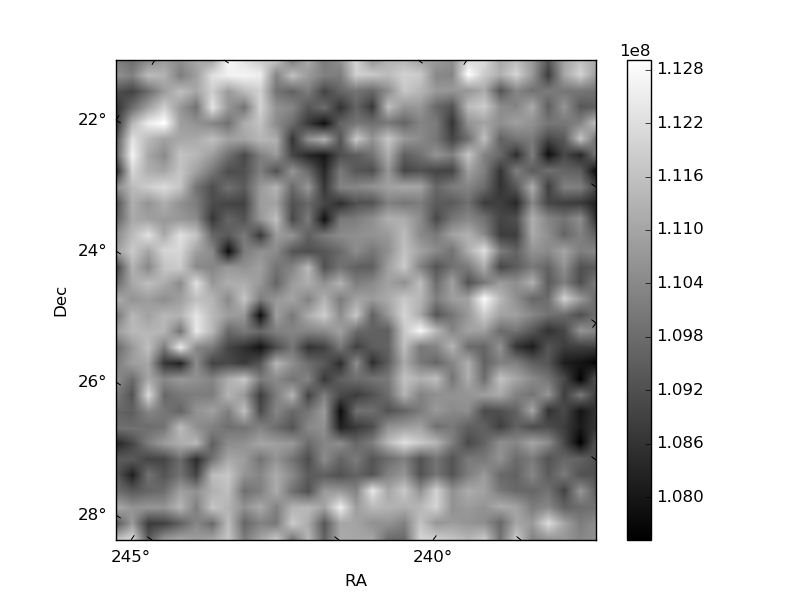
| Plot type | Count rate plots | Images |
|---|---|---|
| Comparison with Poisson distribution Blue bars denote a histogram of data divided into 1 sec bins. Red curve is a Poisson curve with rate = median count rate of data. |
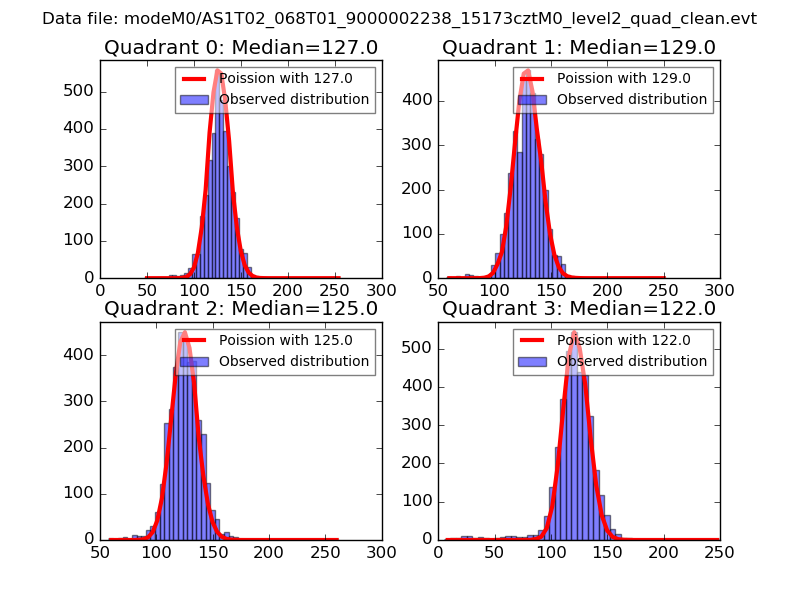 |
 |
| Quadrant-wise count rates Data is divided into 100 sec bins |
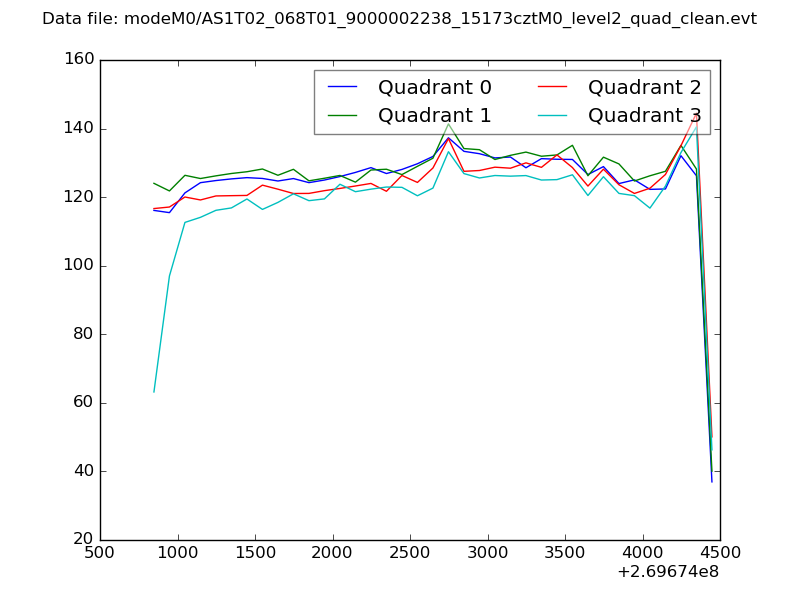 |
|
| Module-wise count rates for Quadrant A Data is divided into 100 sec bins |
 |
 |
| Module-wise count rates for Quadrant B Data is divided into 100 sec bins |
 |
 |
| Module-wise count rates for Quadrant C Data is divided into 100 sec bins |
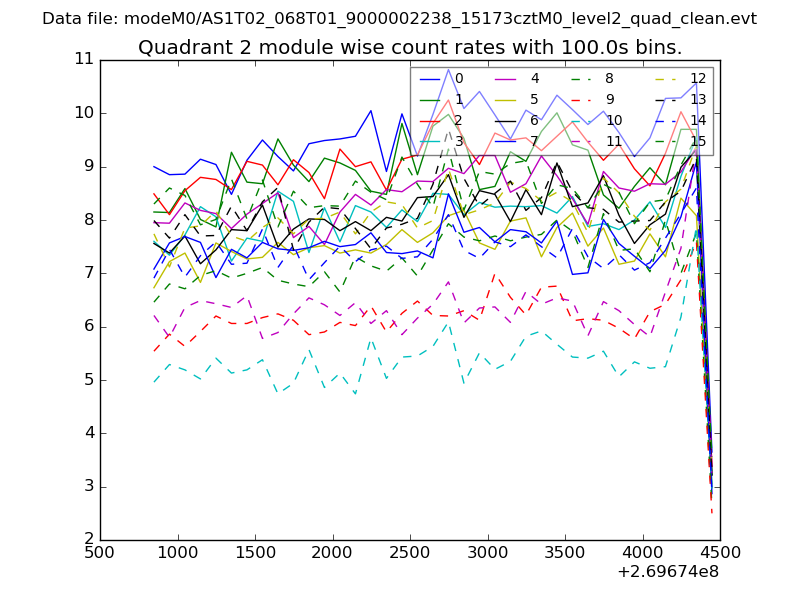 |
 |
| Module-wise count rates for Quadrant D Data is divided into 100 sec bins |
 |
 |
| Parameter | Plot |
|---|---|
| CZT HV Monitor |  |
| D_VDD | 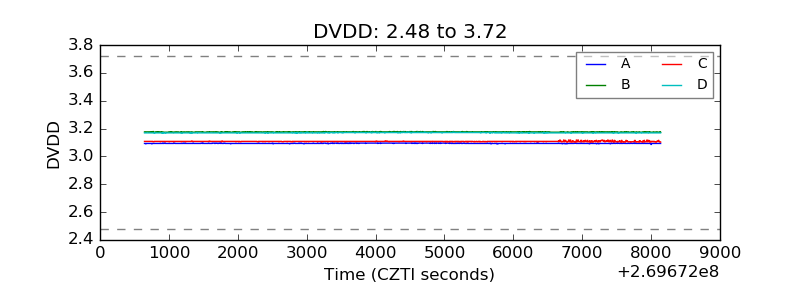 |
| Temperature 1 | 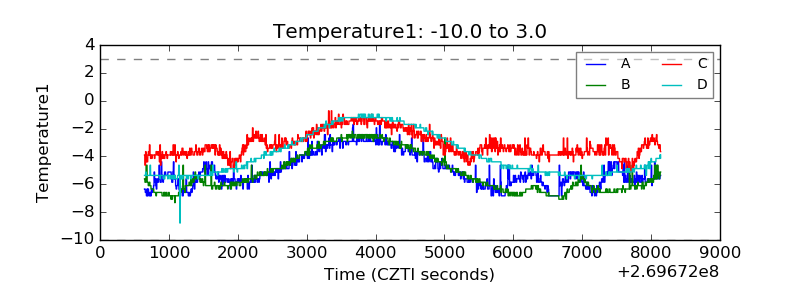 |
| Veto HV Monitor |  |
| Veto LLD | 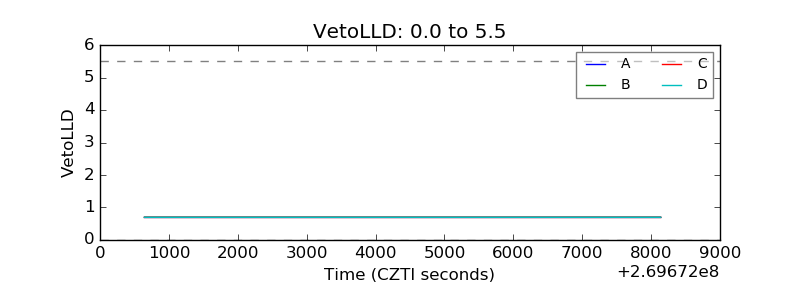 |
| Alpha Counter | 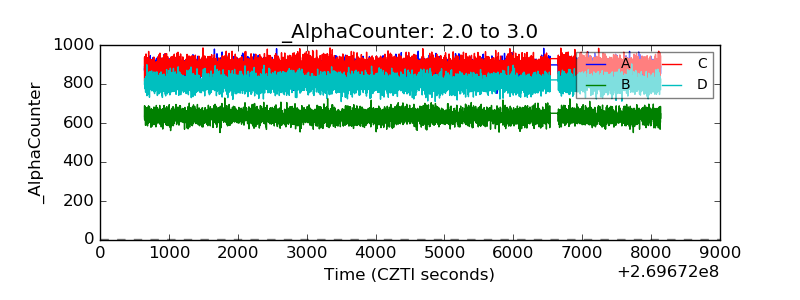 |
| _CPM_Rate | 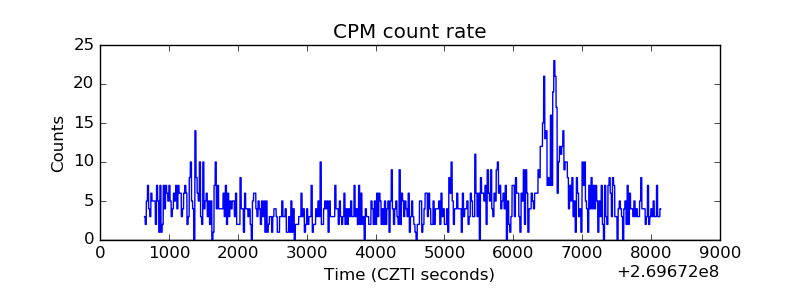 |
| CZT Counter | 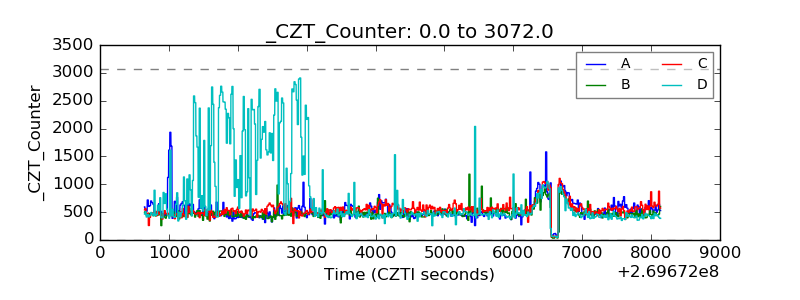 |
| +2.5 Volts monitor | 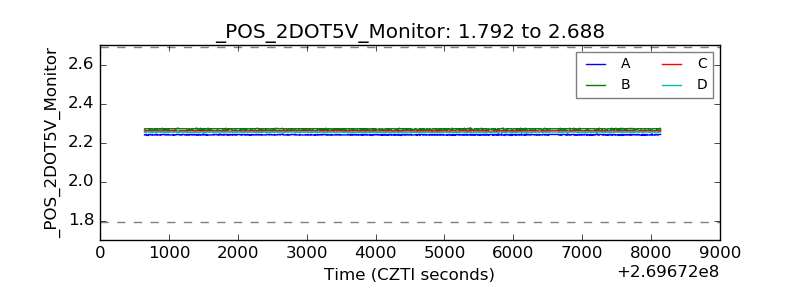 |
| +5 Volts monitor |  |
| _ROLL_ROT | 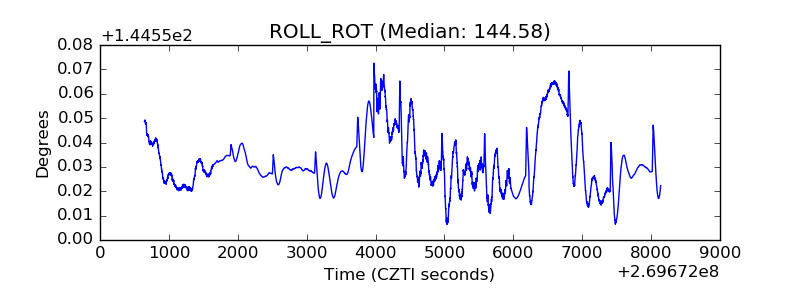 |
| _Roll_DEC | 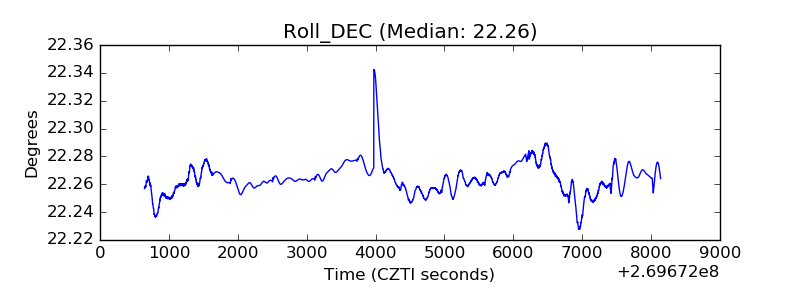 |
| _Roll_RA | 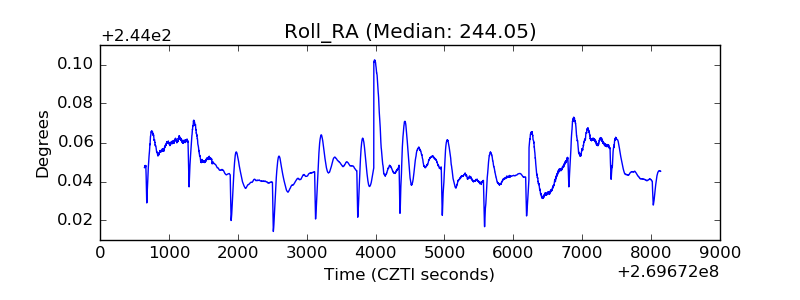 |
| Veto Counter |  |