| Param | Original file | Final file |
|---|---|---|
| Filename | modeM0/AS1T02_068T01_9000002238_15177cztM0_level2.evt | modeM0/AS1T02_068T01_9000002238_15177cztM0_level2_quad_clean.evt |
| Size (bytes) | 891,072,000 | 167,546,880 |
| Size | 849.8 MB | 159.8 MB |
| Events in quadrant A | 7,032,391 | 1,070,903 |
| Events in quadrant B | 6,083,759 | 1,081,468 |
| Events in quadrant C | 7,072,449 | 1,047,031 |
| Events in quadrant D | 5,965,963 | 1,025,221 |
| Mode M9 | |||
|---|---|---|---|
| Quadrant | BADHDUFLAG | Total packets | Discarded packets |
| A | 0 | 12 | 0 |
| B | 0 | 12 | 0 |
| C | 0 | 12 | 0 |
| D | 0 | 12 | 0 |
| Mode SS | |||
|---|---|---|---|
| Quadrant | BADHDUFLAG | Total packets | Discarded packets |
| A | 0 | 252 | 0 |
| B | 0 | 252 | 0 |
| C | 0 | 252 | 0 |
| D | 0 | 252 | 0 |
| Mode M0 | |||
|---|---|---|---|
| Quadrant | BADHDUFLAG | Total packets | Discarded packets |
| A | 0 | 29679 | 3 |
| B | 0 | 25879 | 2 |
| C | 0 | 28823 | 2 |
| D | 0 | 26377 | 2 |
| Quadrant | Total seconds | Saturated seconds | Saturation percentage |
|---|---|---|---|
| A | 12288 | 132 | 1.074219% |
| B | 12288 | 177 | 1.440430% |
| C | 12288 | 109 | 0.887044% |
| D | 12288 | 178 | 1.448568% |
Noise dominated data is calculated using 1-second bins in cleaned event files. If a bin has >2000 counts, and if more than 50% of those come from <1% of pixels, then it is considered to be noise-dominated and hence unusable.
| Quadrant | # 1 sec bins | Bins with >0 counts | Bins with >2000 counts | High rate bins dominated by noise | Noise dominated (total time) | Noise dominated (detector-on time) | Marked lightcurve |
|---|---|---|---|---|---|---|---|
| A | 13604 | 12289 | 0 | 0 | 0.00% | 0.00% | 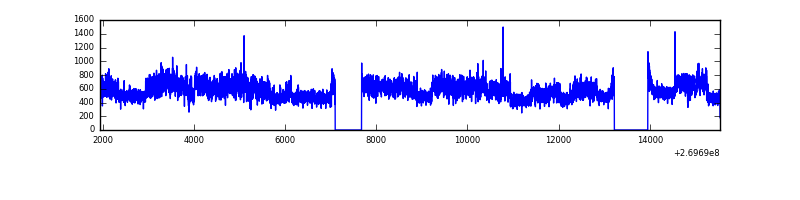 |
| B | 13604 | 12290 | 24 | 24 | 0.18% | 0.20% | 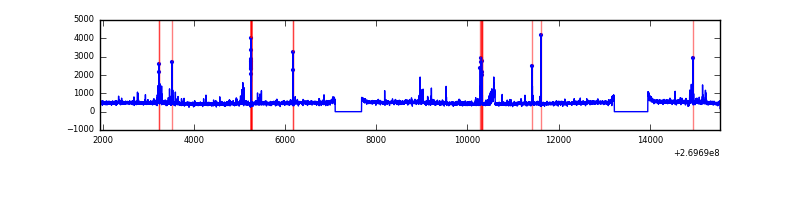 |
| C | 13604 | 12289 | 0 | 0 | 0.00% | 0.00% | 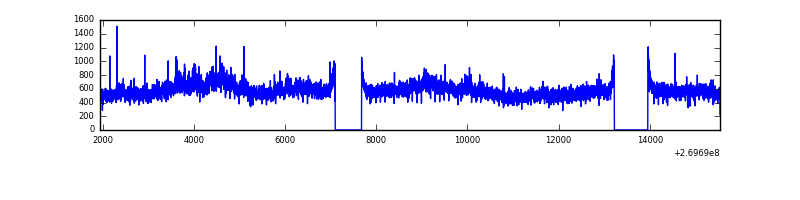 |
| D | 13604 | 12289 | 57 | 57 | 0.42% | 0.46% | 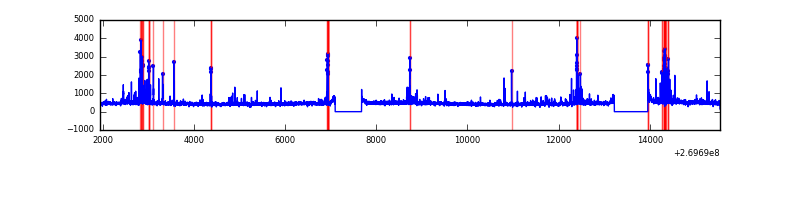 |
Top three noisy pixels from each quadrant. If the there are fewer than three noisy pixels in the level2.evt file, extra rows are filled as -1
| Pixel properties | Quadrant properties | ||||||
|---|---|---|---|---|---|---|---|
| Quadrant | DetID | PixID | Counts | Sigma | Mean | Median | Sigma |
| A | 15 | 239 | 1222423 | 4104.36 | 1468 | 1434 | 297.5 |
| A | 12 | 189 | 149962 | 499.28 | 1468 | 1434 | 297.5 |
| A | 0 | 226 | 12842 | 38.35 | 1468 | 1434 | 297.5 |
| B | 3 | 64 | 118663 | 420.68 | 1464 | 1427 | 278.7 |
| B | 4 | 48 | 88434 | 312.21 | 1464 | 1427 | 278.7 |
| B | 0 | 197 | 56359 | 197.11 | 1464 | 1427 | 278.7 |
| C | 3 | 233 | 1497269 | 4524.93 | 1425 | 1429 | 330.6 |
| C | 8 | 128 | 10420 | 27.2 | 1425 | 1429 | 330.6 |
| C | 13 | 61 | 10183 | 26.48 | 1425 | 1429 | 330.6 |
| D | 2 | 33 | 282197 | 806.01 | 1427 | 1385 | 348.4 |
| D | 5 | 222 | 83083 | 234.5 | 1427 | 1385 | 348.4 |
| D | 7 | 223 | 53104 | 148.45 | 1427 | 1385 | 348.4 |
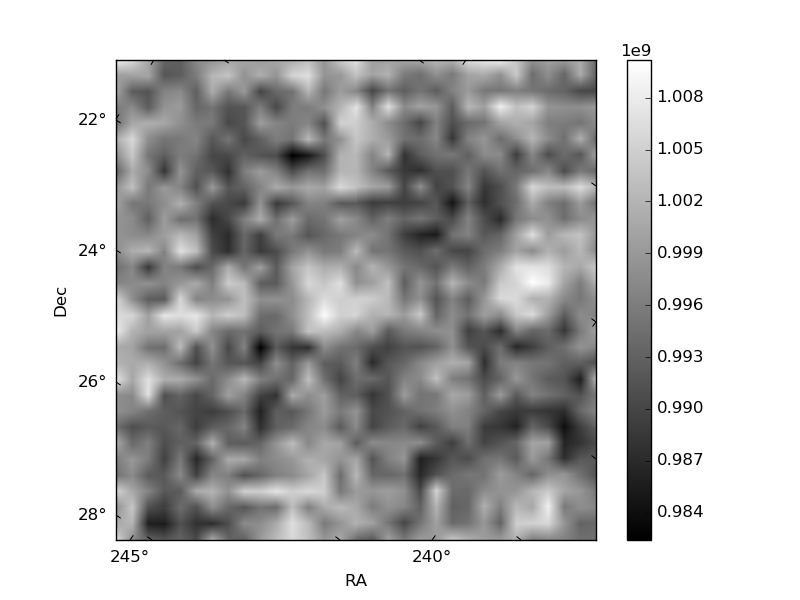
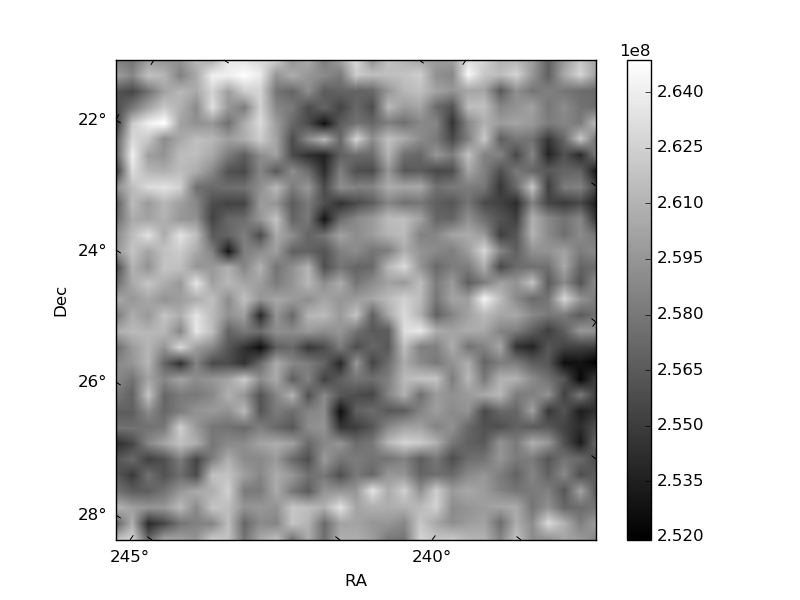
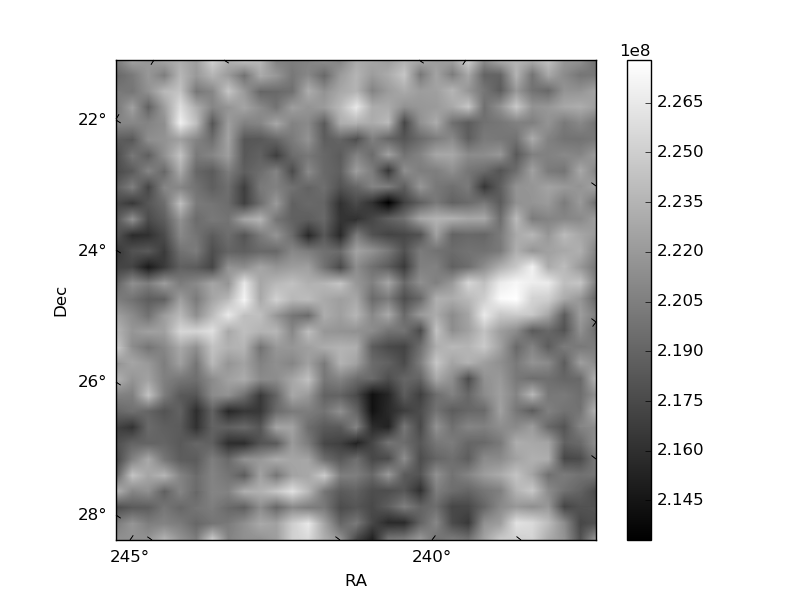
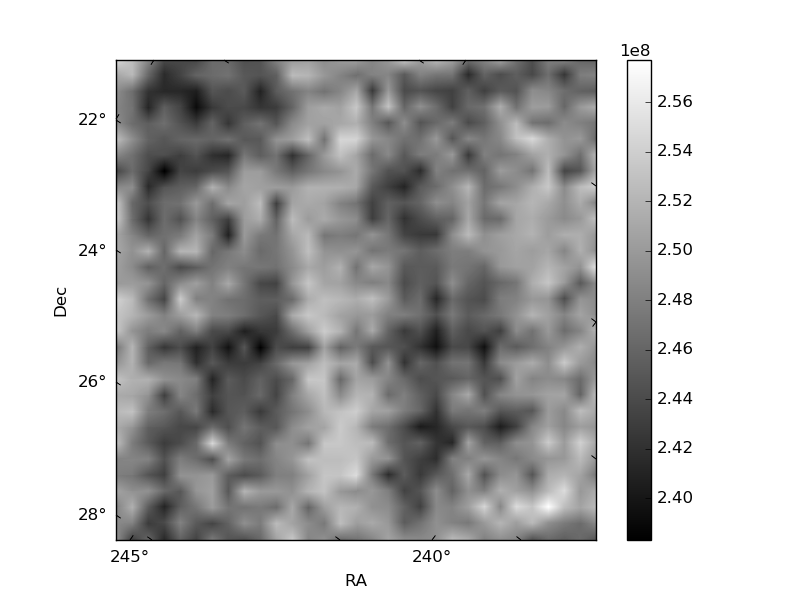
Histogram calculated using DETX and DETY for each event in the final _common_clean file
| Quadrant A | 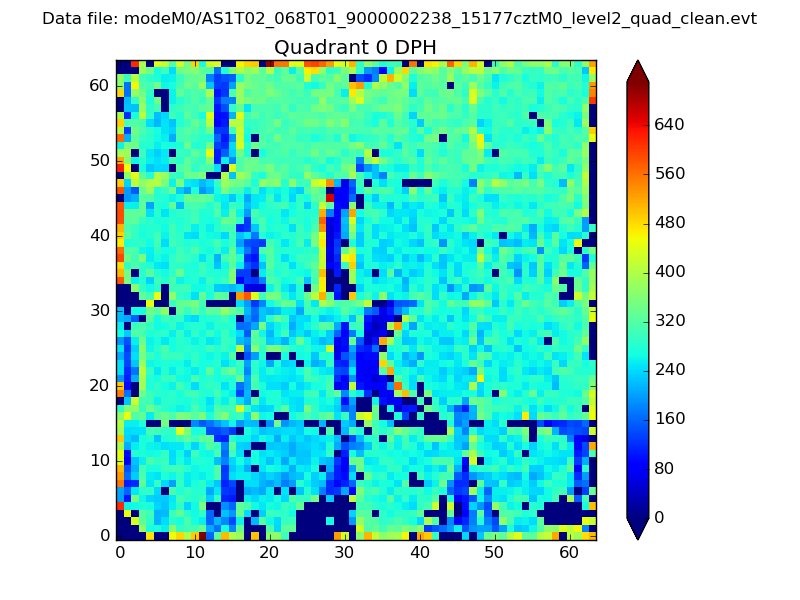 |
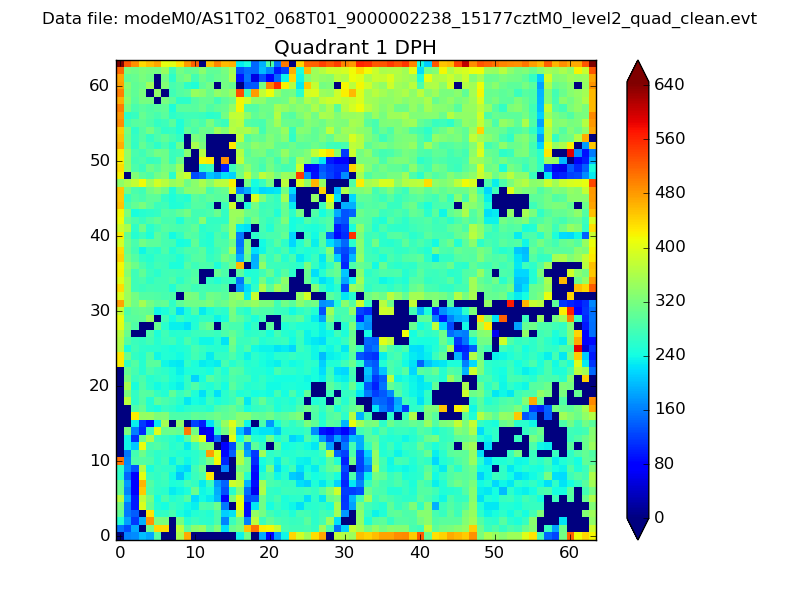 |
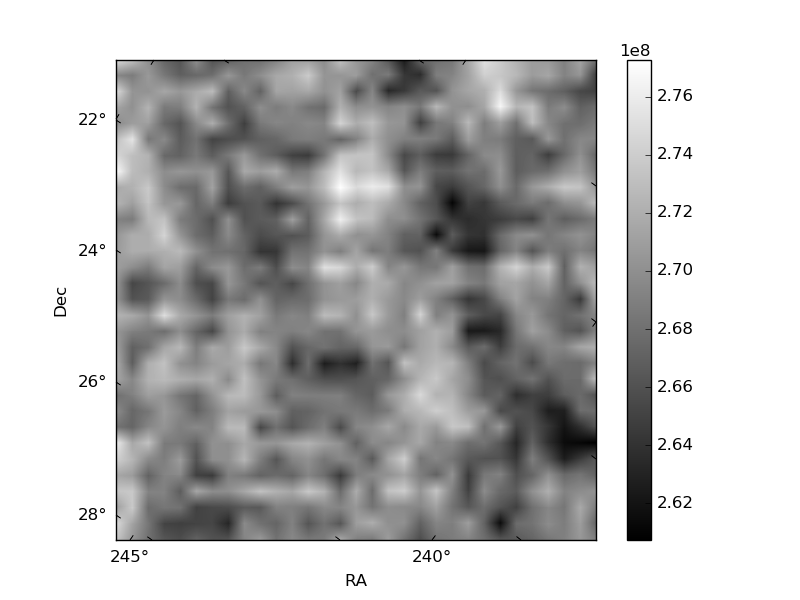
Quadrant B |
|---|---|---|---|
| Quadrant D | 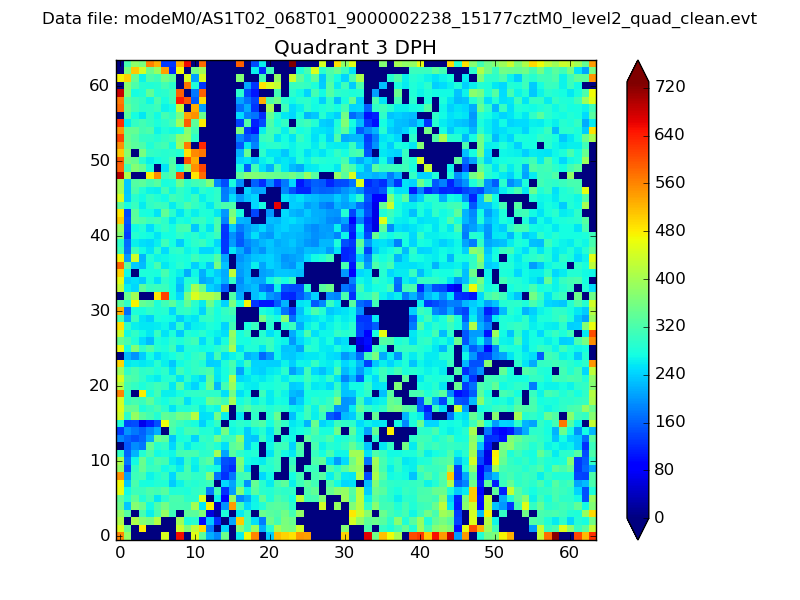 |
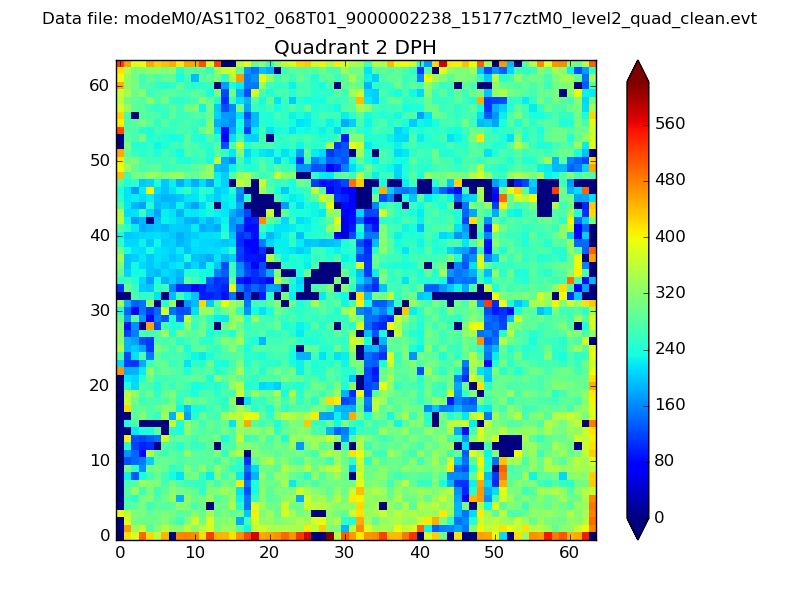 |
Quadrant C |
| Plot type | Count rate plots | Images |
|---|---|---|
| Comparison with Poisson distribution Blue bars denote a histogram of data divided into 1 sec bins. Red curve is a Poisson curve with rate = median count rate of data. |
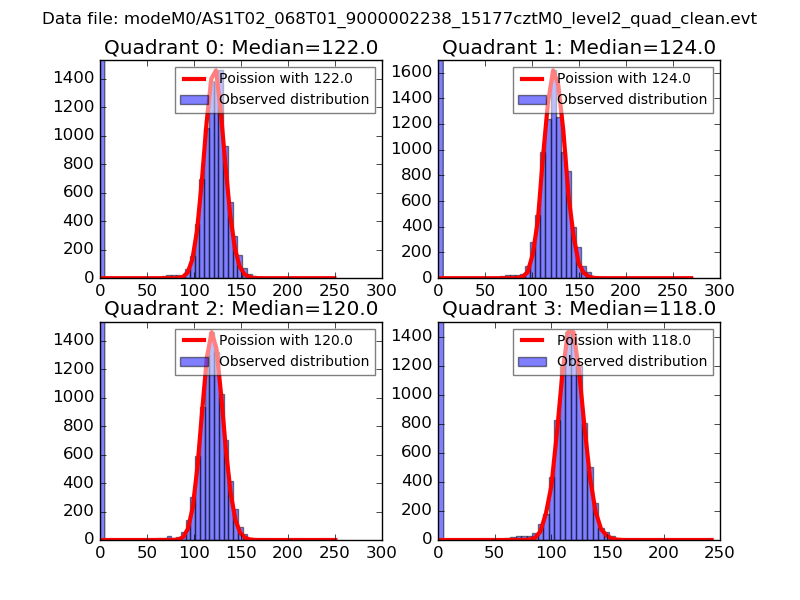 |
 |
| Quadrant-wise count rates Data is divided into 100 sec bins |
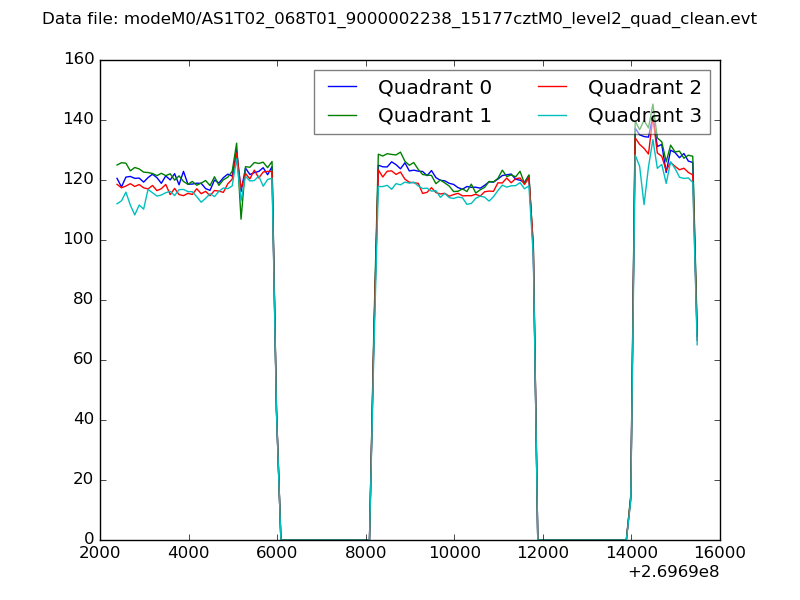 |
|
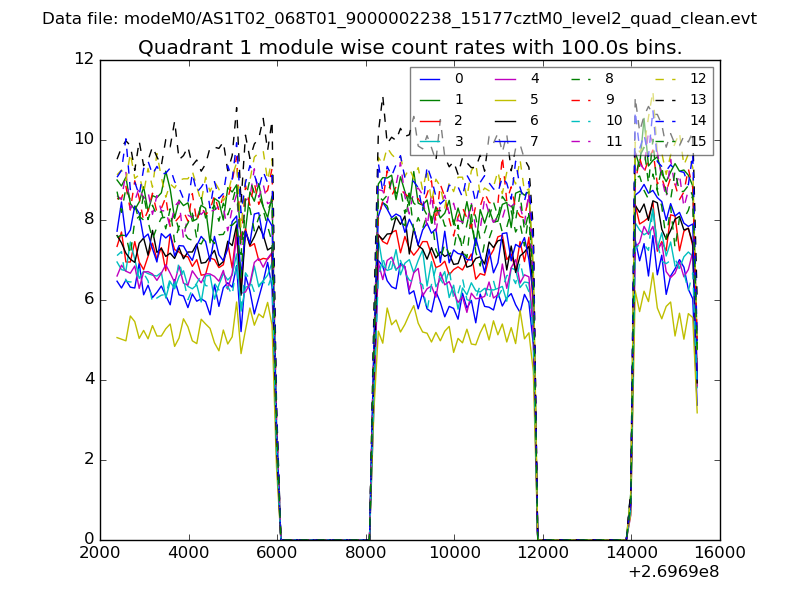
| Module-wise count rates for Quadrant A Data is divided into 100 sec bins |
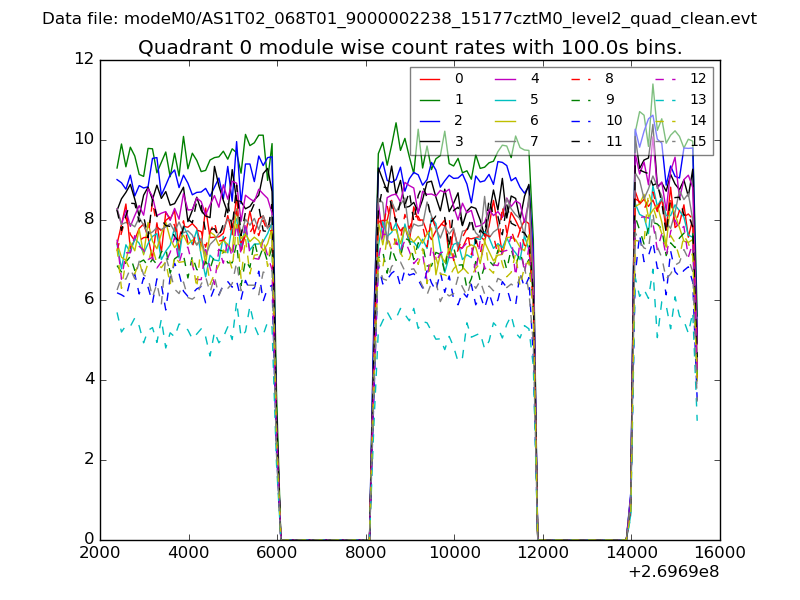 |
 |
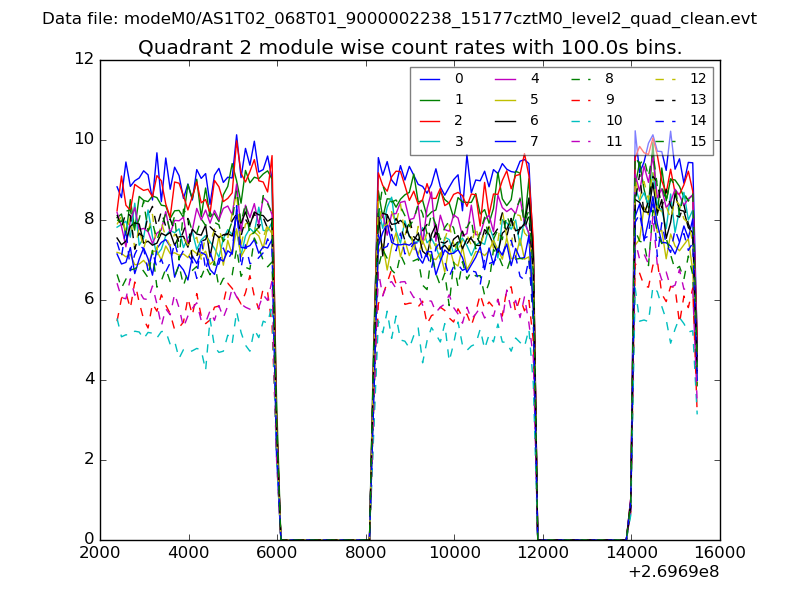
| Module-wise count rates for Quadrant B Data is divided into 100 sec bins |
 |
 |
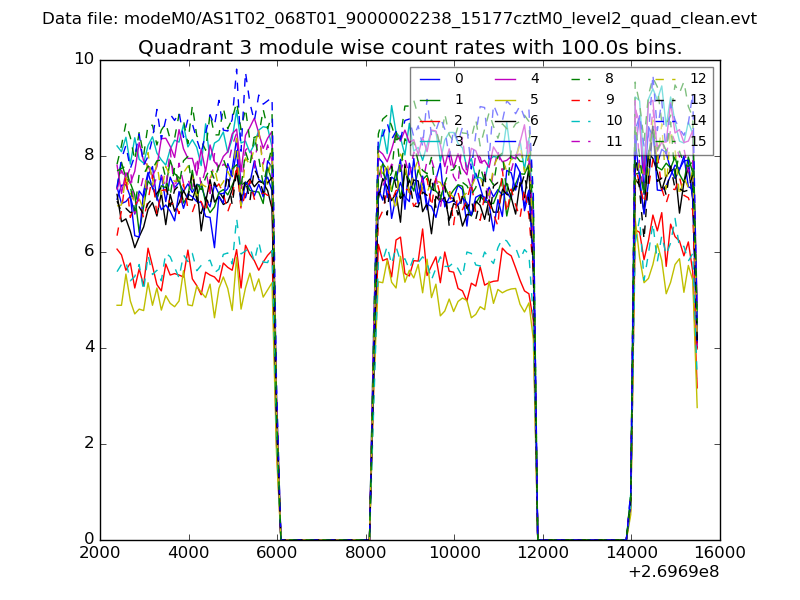
| Module-wise count rates for Quadrant C Data is divided into 100 sec bins |
 |
 |
| Module-wise count rates for Quadrant D Data is divided into 100 sec bins |
 |
 |
| Parameter | Plot |
|---|---|
| CZT HV Monitor | 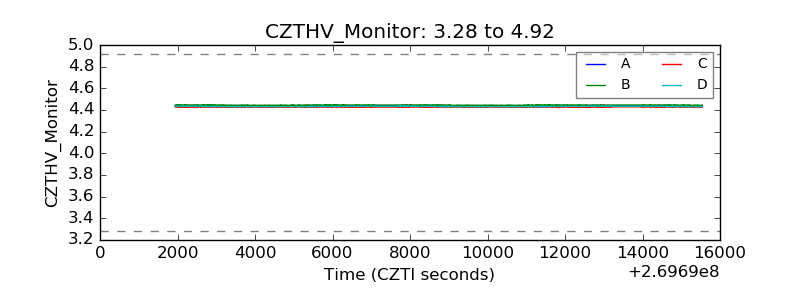 |
| D_VDD | 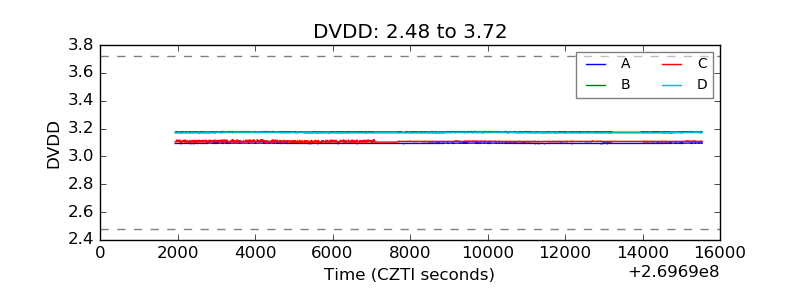 |
| Temperature 1 | 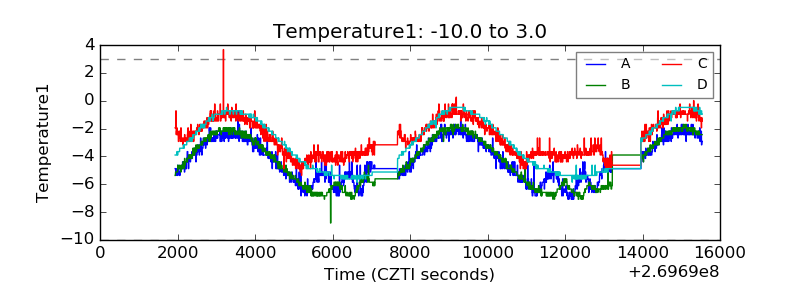 |
| Veto HV Monitor | 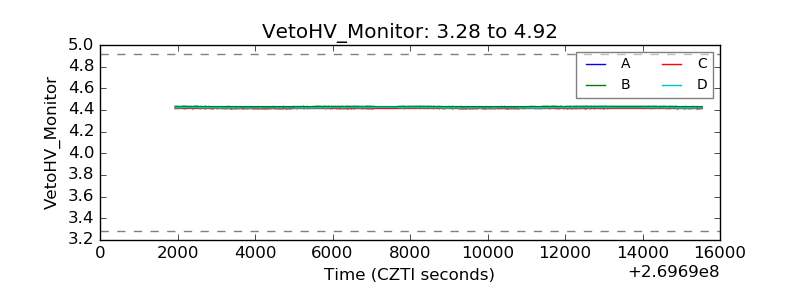 |
| Veto LLD |  |
| Alpha Counter | 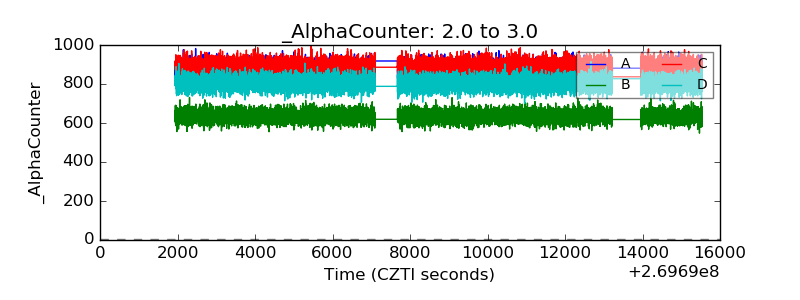 |
| _CPM_Rate | 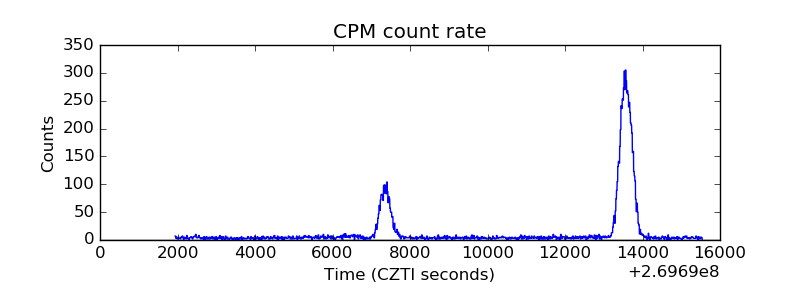 |
| CZT Counter | 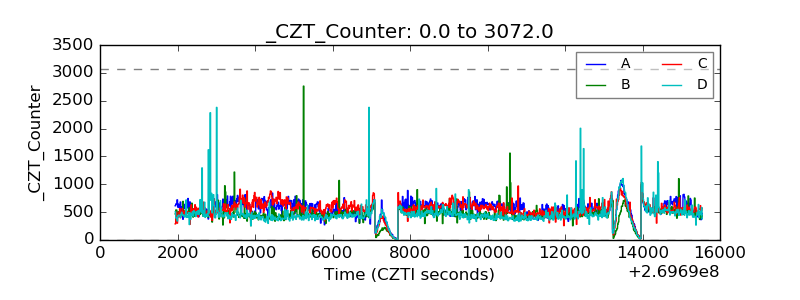 |
| +2.5 Volts monitor | 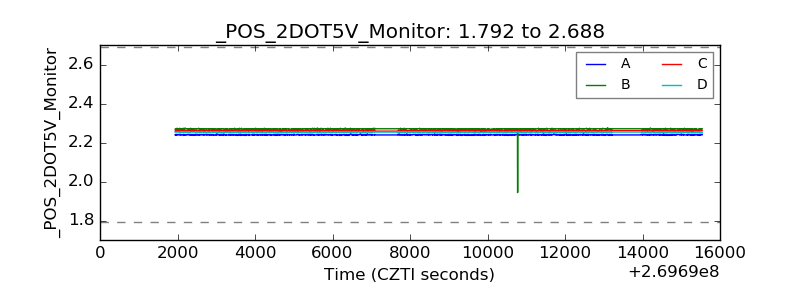 |
| +5 Volts monitor |  |
| _ROLL_ROT | 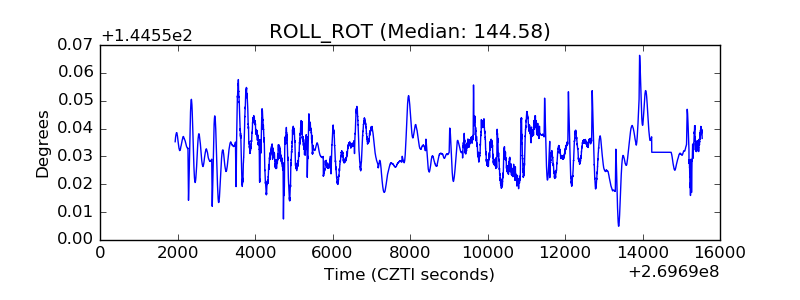 |
| _Roll_DEC | 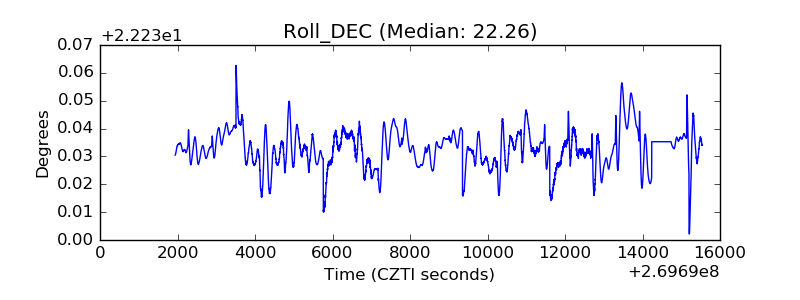 |
| _Roll_RA | 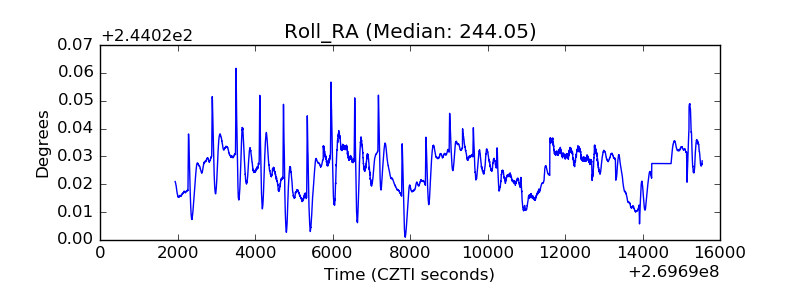 |
| Veto Counter | 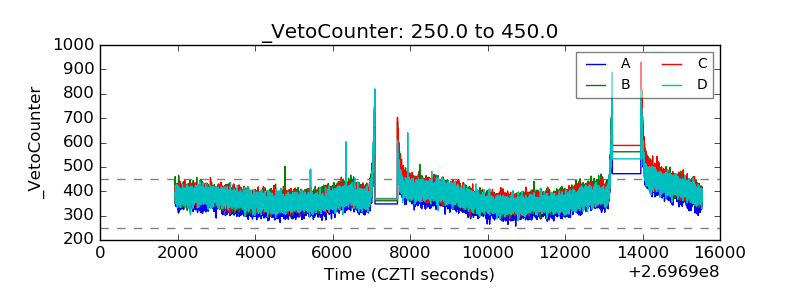 |