| Param | Original file | Final file |
|---|---|---|
| Filename | modeM0/AS1T02_068T01_9000002238_15179cztM0_level2.evt | modeM0/AS1T02_068T01_9000002238_15179cztM0_level2_quad_clean.evt |
| Size (bytes) | 486,414,720 | 89,268,480 |
| Size | 463.9 MB | 85.1 MB |
| Events in quadrant A | 3,849,750 | 572,335 |
| Events in quadrant B | 3,125,358 | 580,591 |
| Events in quadrant C | 3,264,622 | 567,910 |
| Events in quadrant D | 4,069,499 | 548,747 |
| Mode M9 | |||
|---|---|---|---|
| Quadrant | BADHDUFLAG | Total packets | Discarded packets |
| A | 0 | 11 | 0 |
| B | 0 | 11 | 0 |
| C | 0 | 11 | 0 |
| D | 0 | 11 | 0 |
| Mode SS | |||
|---|---|---|---|
| Quadrant | BADHDUFLAG | Total packets | Discarded packets |
| A | 0 | 126 | 0 |
| B | 0 | 126 | 0 |
| C | 0 | 126 | 0 |
| D | 0 | 126 | 0 |
| Mode M0 | |||
|---|---|---|---|
| Quadrant | BADHDUFLAG | Total packets | Discarded packets |
| A | 0 | 15969 | 2 |
| B | 0 | 13340 | 1 |
| C | 0 | 13529 | 1 |
| D | 0 | 16506 | 1 |
| Quadrant | Total seconds | Saturated seconds | Saturation percentage |
|---|---|---|---|
| A | 6215 | 43 | 0.691874% |
| B | 6215 | 61 | 0.981496% |
| C | 6215 | 33 | 0.530973% |
| D | 6215 | 596 | 9.589702% |
Noise dominated data is calculated using 1-second bins in cleaned event files. If a bin has >2000 counts, and if more than 50% of those come from <1% of pixels, then it is considered to be noise-dominated and hence unusable.
| Quadrant | # 1 sec bins | Bins with >0 counts | Bins with >2000 counts | High rate bins dominated by noise | Noise dominated (total time) | Noise dominated (detector-on time) | Marked lightcurve |
|---|---|---|---|---|---|---|---|
| A | 7316 | 6224 | 1 | 1 | 0.01% | 0.02% | 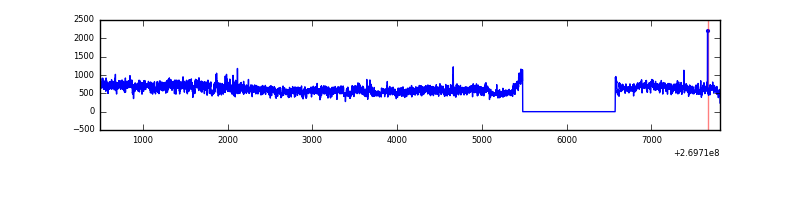 |
| B | 7316 | 6225 | 18 | 18 | 0.25% | 0.29% | 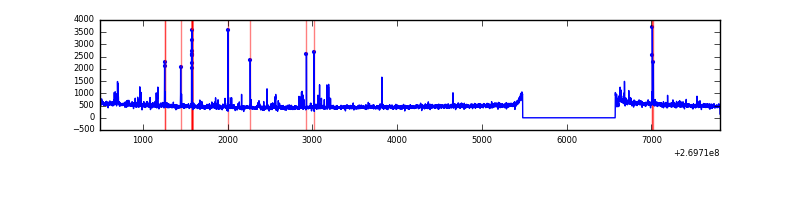 |
| C | 7316 | 6225 | 1 | 1 | 0.01% | 0.02% | 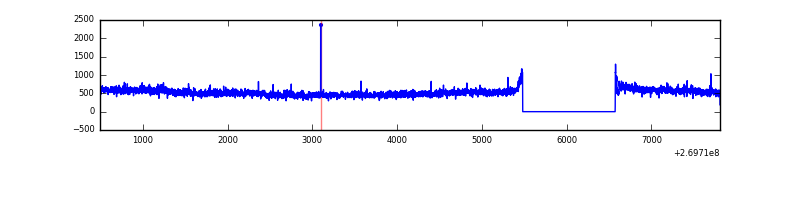 |
| D | 7316 | 6224 | 565 | 565 | 7.72% | 9.08% | 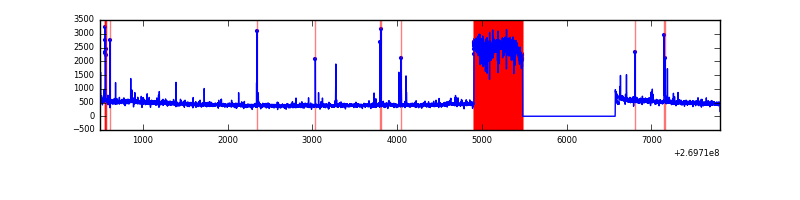 |
Top three noisy pixels from each quadrant. If the there are fewer than three noisy pixels in the level2.evt file, extra rows are filled as -1
| Pixel properties | Quadrant properties | ||||||
|---|---|---|---|---|---|---|---|
| Quadrant | DetID | PixID | Counts | Sigma | Mean | Median | Sigma |
| A | 15 | 239 | 886256 | 5749.19 | 757 | 741 | 154.0 |
| A | 12 | 189 | 40581 | 258.66 | 757 | 741 | 154.0 |
| A | 0 | 226 | 6909 | 40.05 | 757 | 741 | 154.0 |
| B | 3 | 64 | 72071 | 495.9 | 757 | 738 | 143.8 |
| B | 4 | 48 | 26989 | 182.49 | 757 | 738 | 143.8 |
| B | 0 | 189 | 26191 | 176.95 | 757 | 738 | 143.8 |
| C | 3 | 233 | 382452 | 2226.81 | 737 | 741 | 171.4 |
| C | 13 | 61 | 5275 | 26.45 | 737 | 741 | 171.4 |
| C | 14 | 234 | 3554 | 16.41 | 737 | 741 | 171.4 |
| D | 2 | 33 | 1345919 | 7939.54 | 696 | 674 | 169.4 |
| D | 10 | 70 | 41914 | 243.4 | 696 | 674 | 169.4 |
| D | 2 | 234 | 22576 | 129.26 | 696 | 674 | 169.4 |
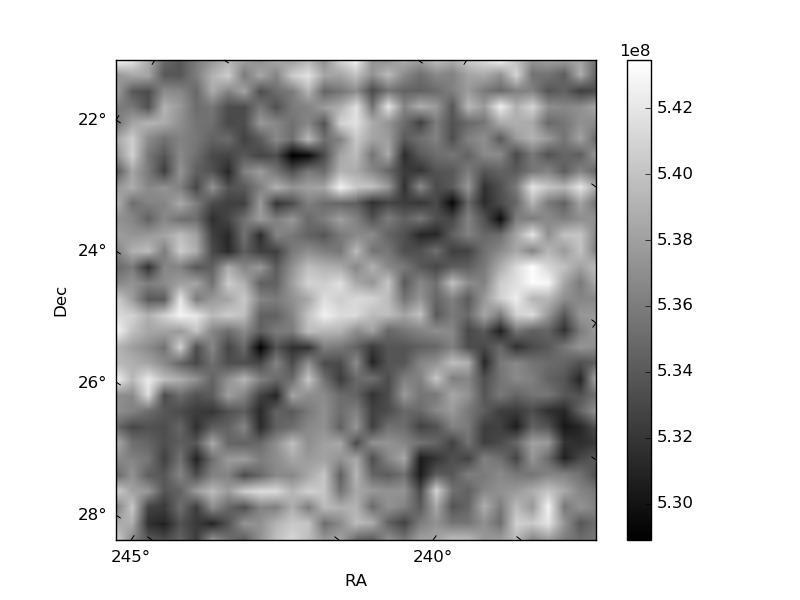
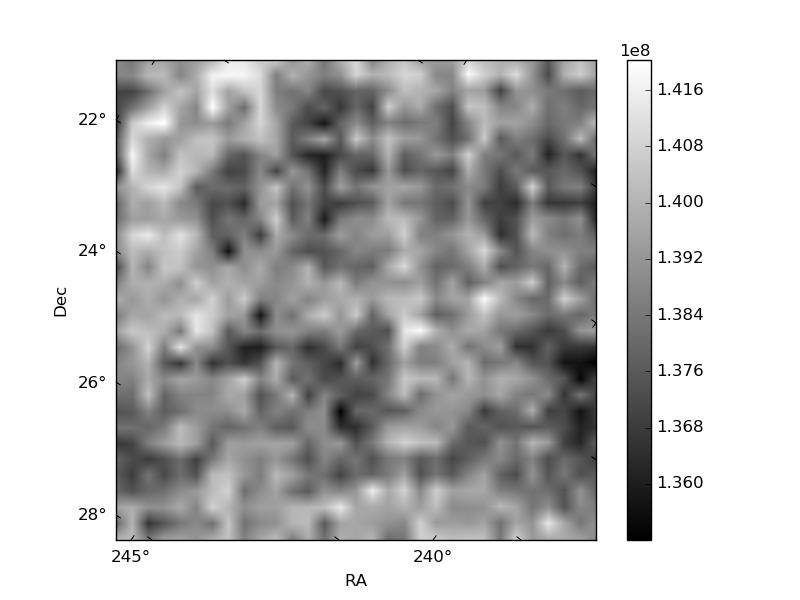
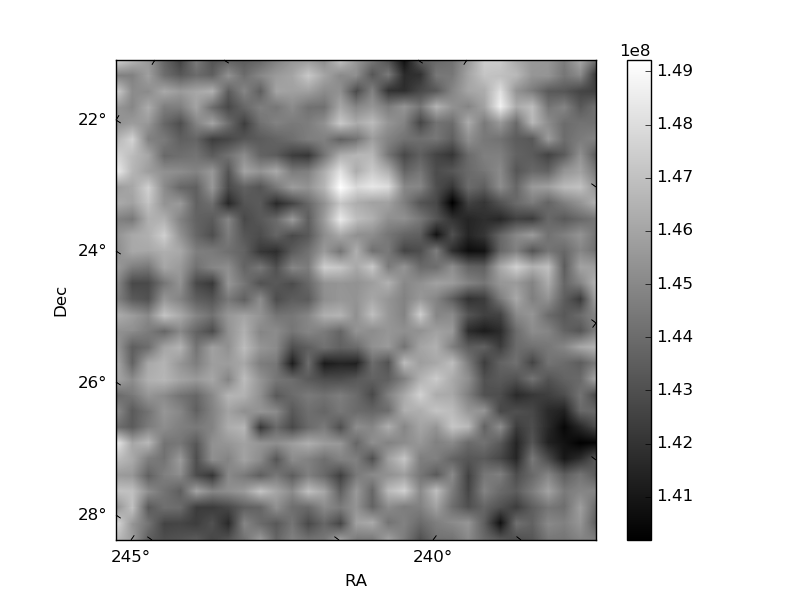
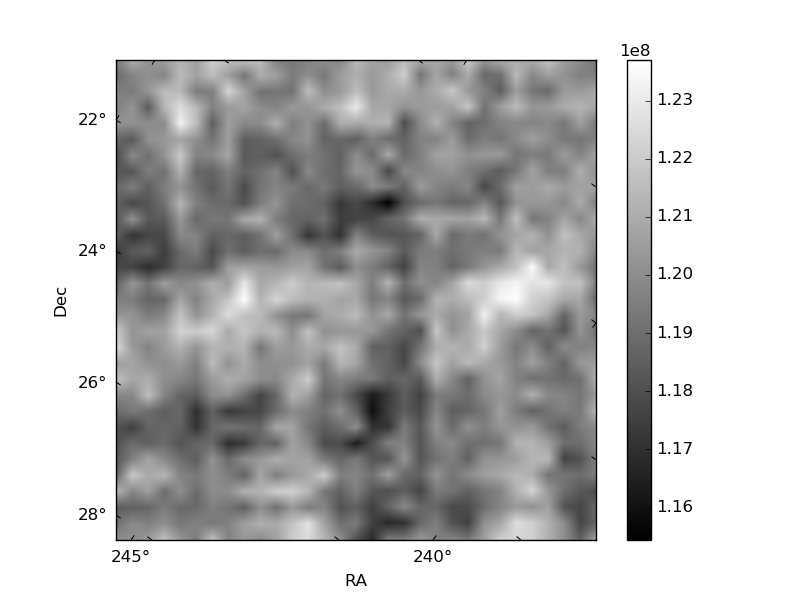
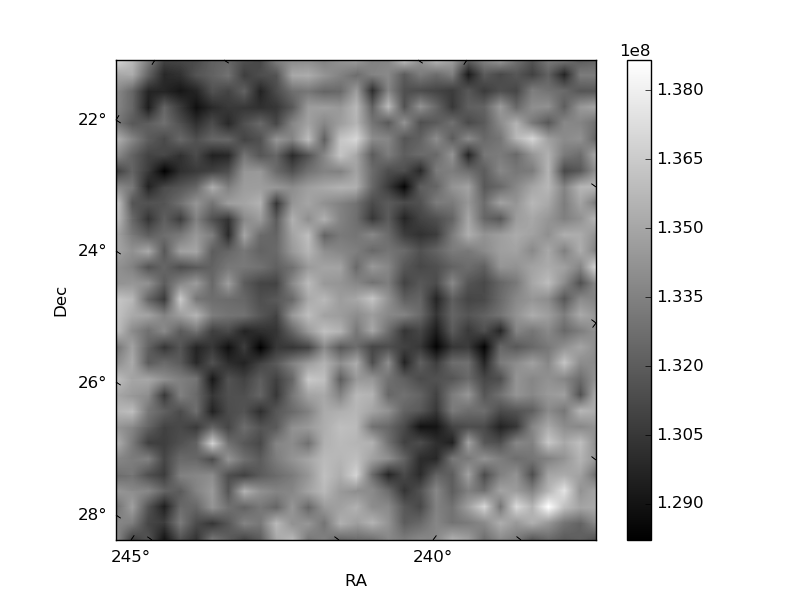
Histogram calculated using DETX and DETY for each event in the final _common_clean file
| Quadrant A | 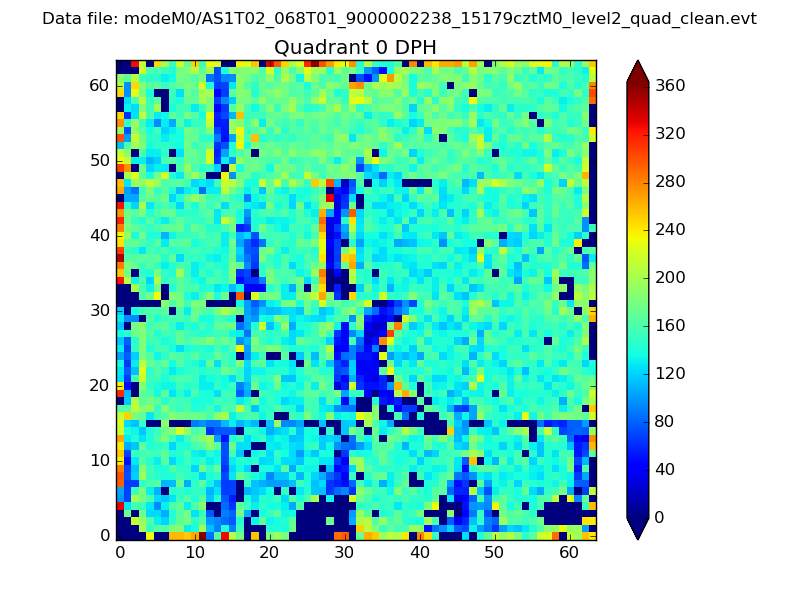 |
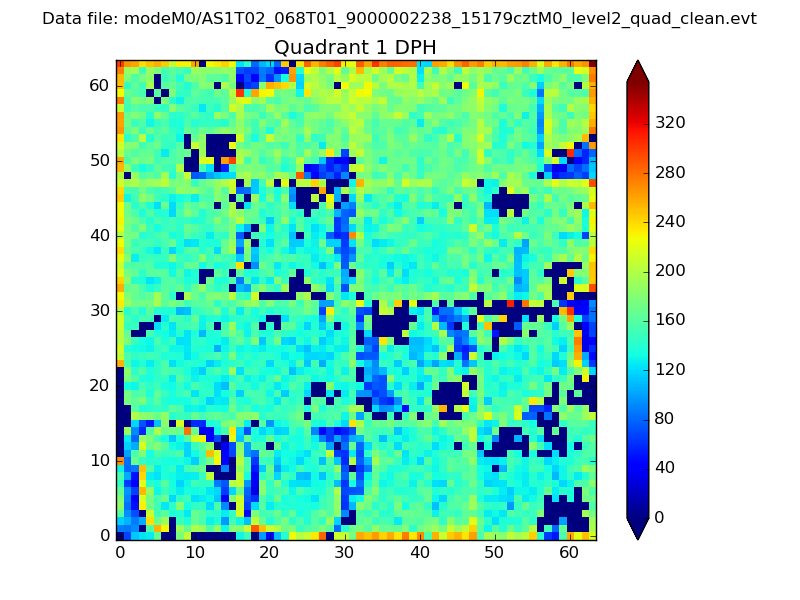 |
Quadrant B |
|---|---|---|---|
| Quadrant D | 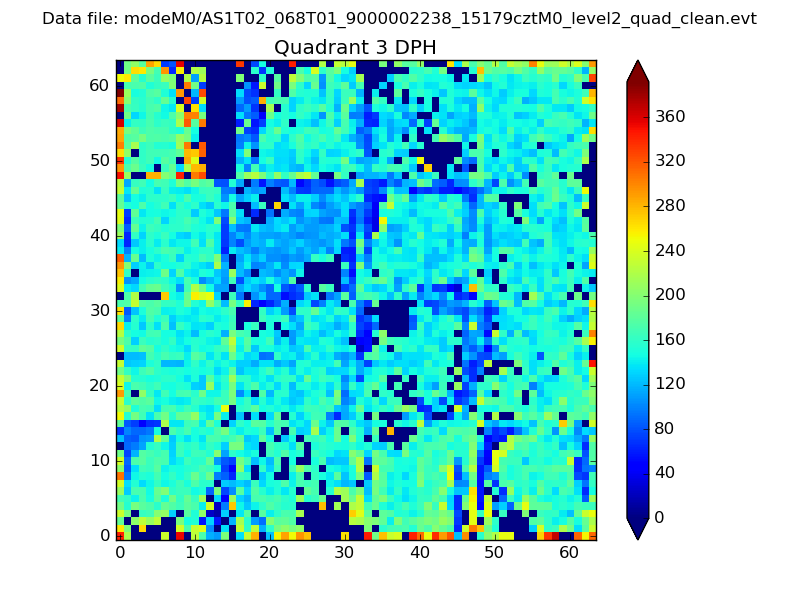 |
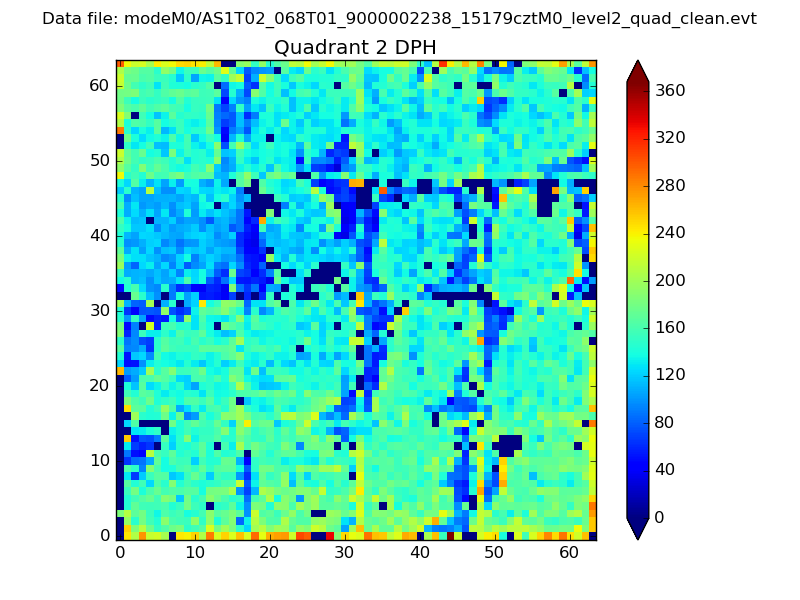 |
Quadrant C |
| Plot type | Count rate plots | Images |
|---|---|---|
| Comparison with Poisson distribution Blue bars denote a histogram of data divided into 1 sec bins. Red curve is a Poisson curve with rate = median count rate of data. |
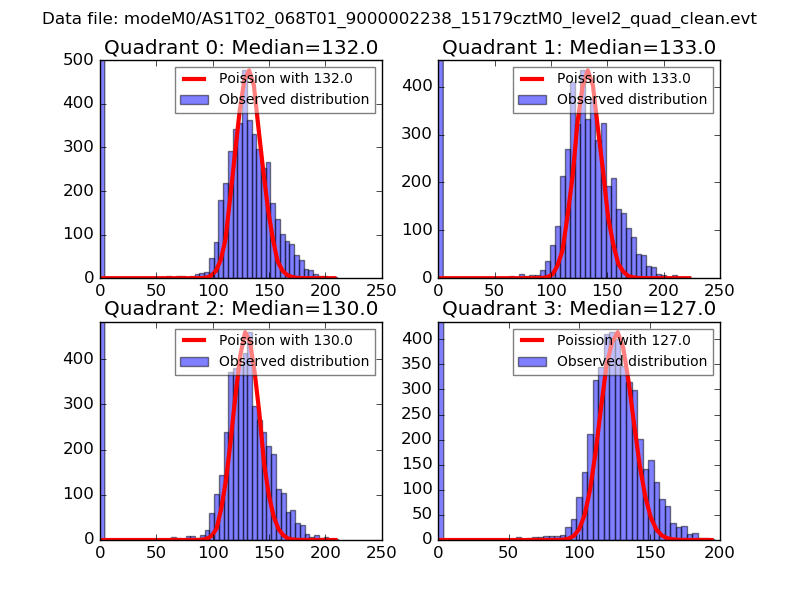 |
 |
| Quadrant-wise count rates Data is divided into 100 sec bins |
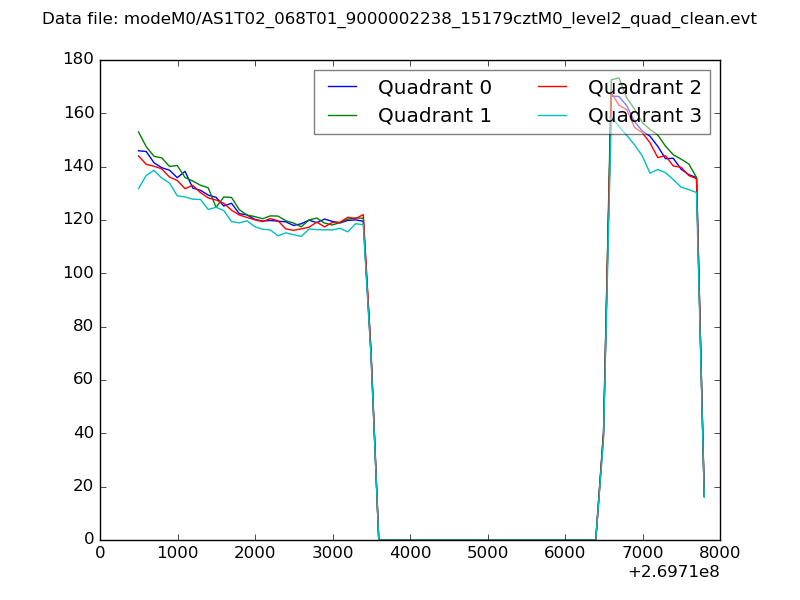 |
|
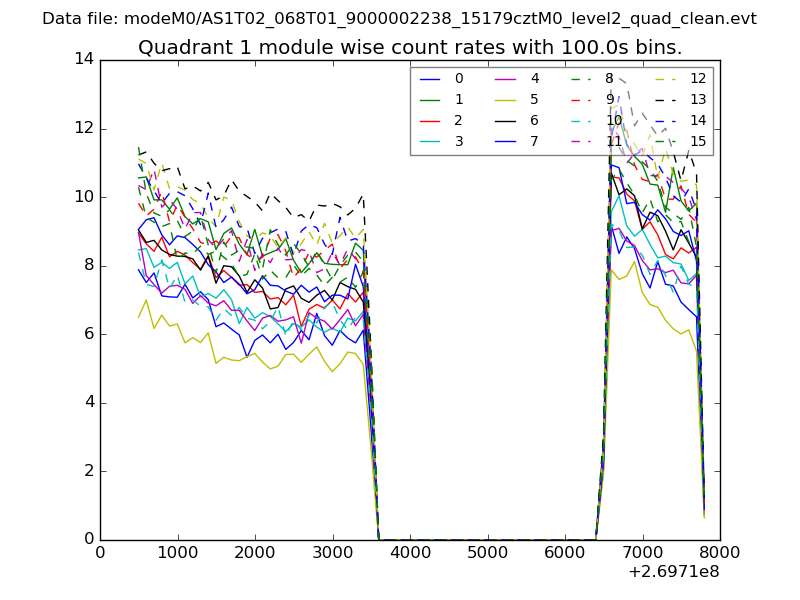
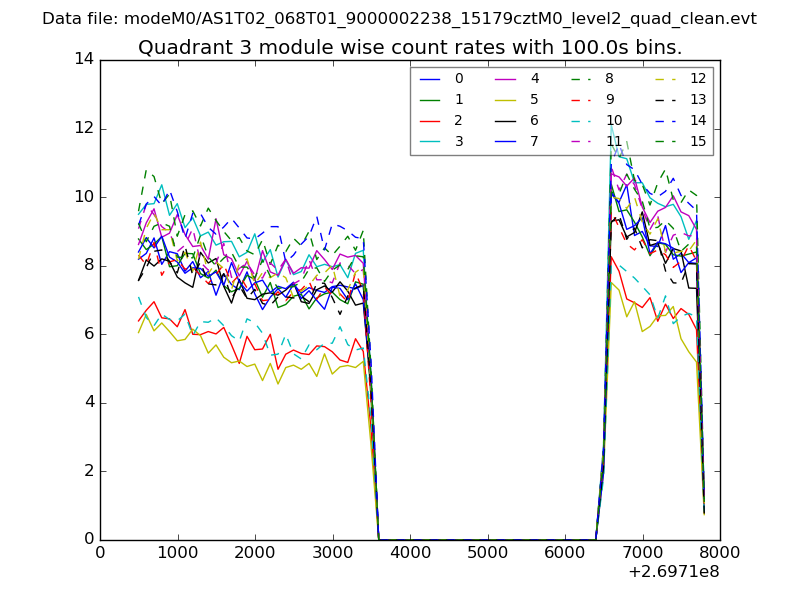
| Module-wise count rates for Quadrant A Data is divided into 100 sec bins |
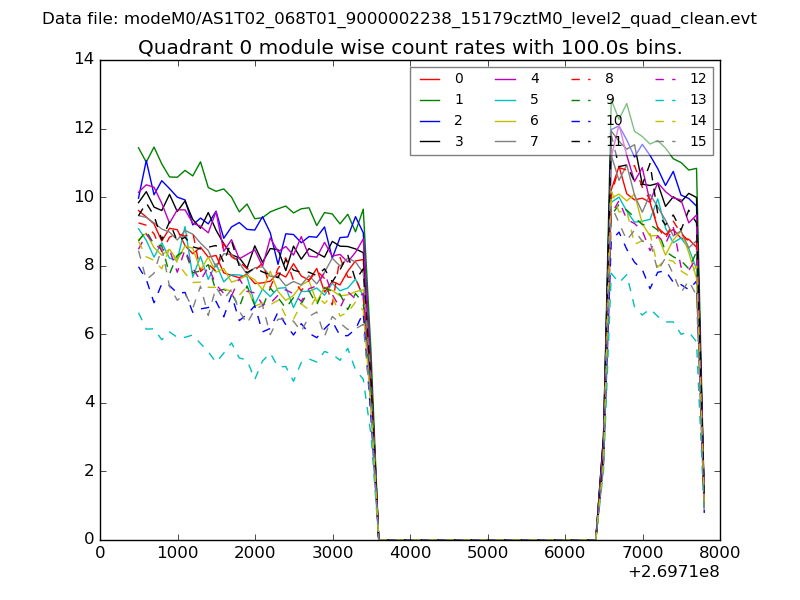 |
 |
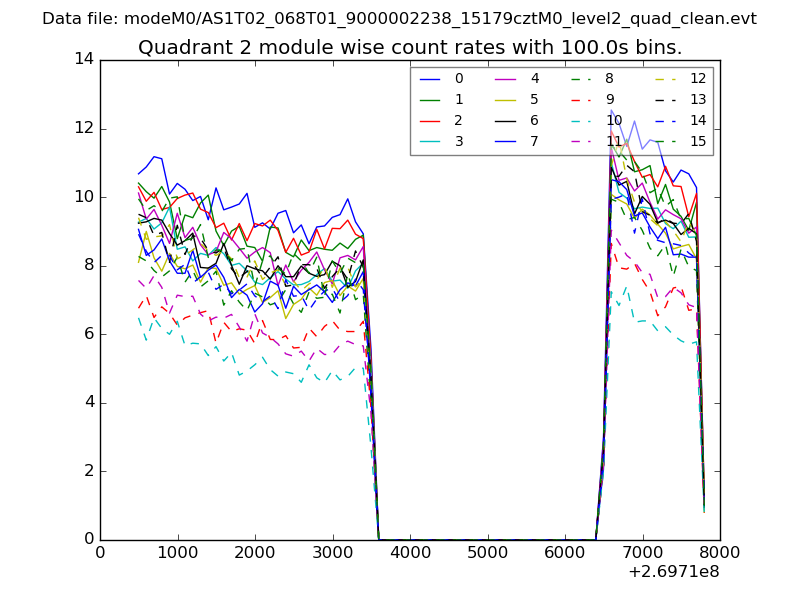
| Module-wise count rates for Quadrant B Data is divided into 100 sec bins |
 |
 |
| Module-wise count rates for Quadrant C Data is divided into 100 sec bins |
 |
 |
| Module-wise count rates for Quadrant D Data is divided into 100 sec bins |
 |
 |
| Parameter | Plot |
|---|---|
| CZT HV Monitor | 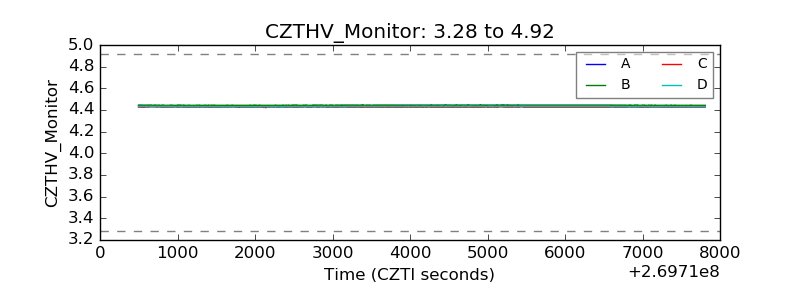 |
| D_VDD | 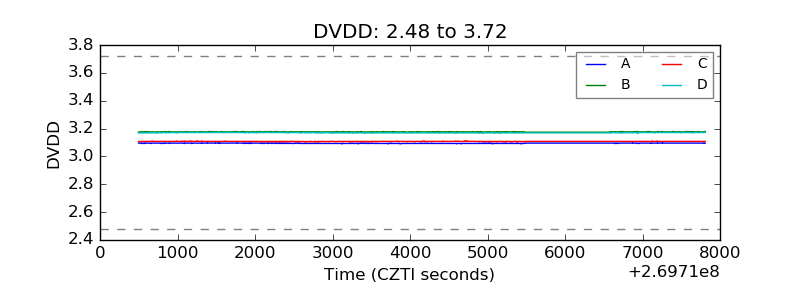 |
| Temperature 1 | 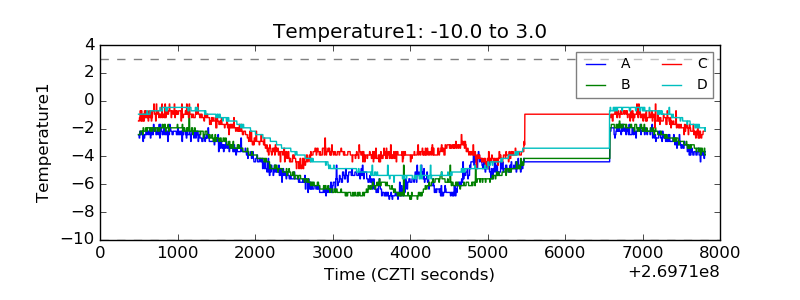 |
| Veto HV Monitor | 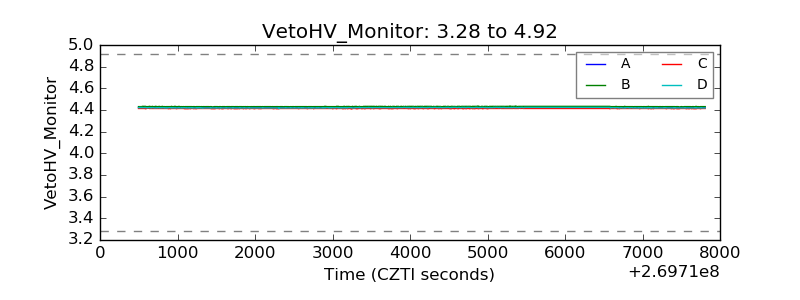 |
| Veto LLD | 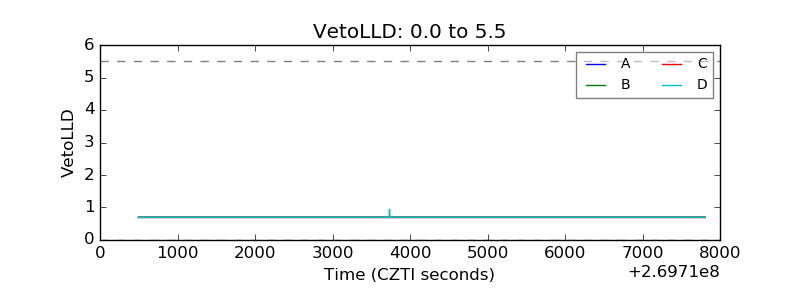 |
| Alpha Counter | 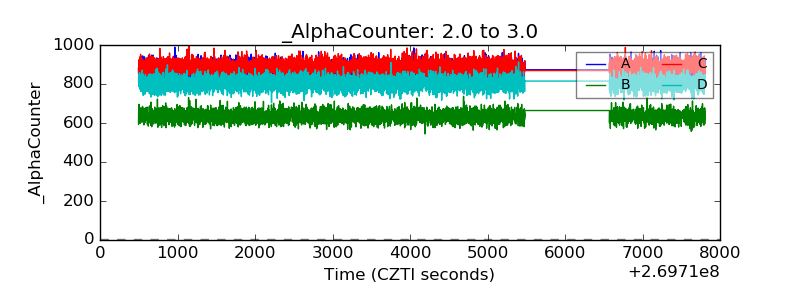 |
| _CPM_Rate | 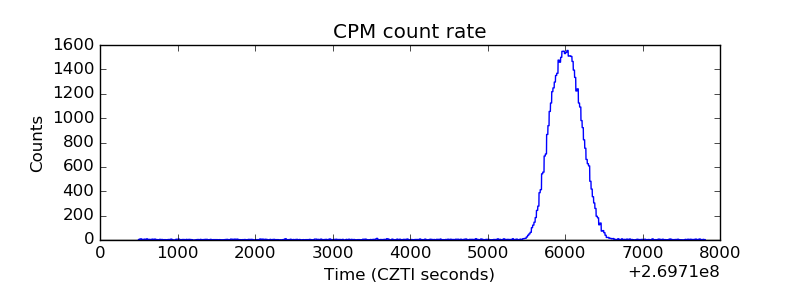 |
| CZT Counter | 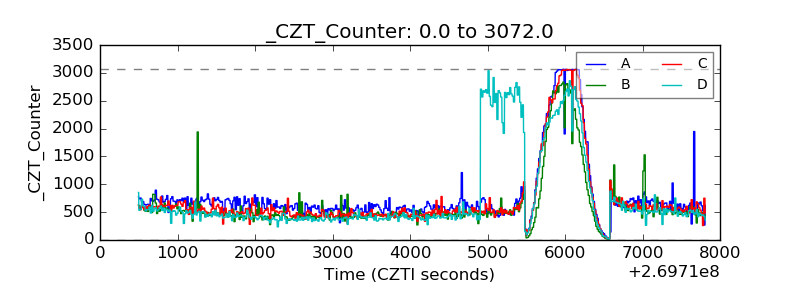 |
| +2.5 Volts monitor |  |
| +5 Volts monitor |  |
| _ROLL_ROT | 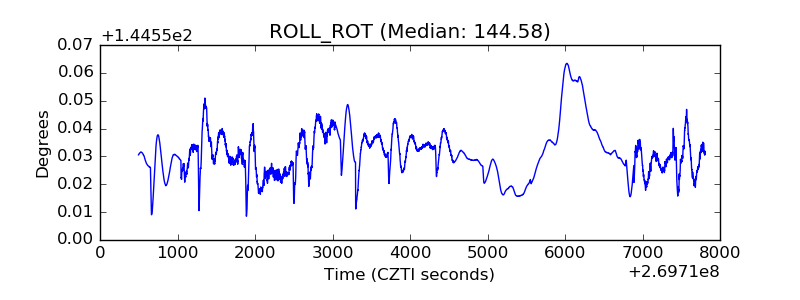 |
| _Roll_DEC | 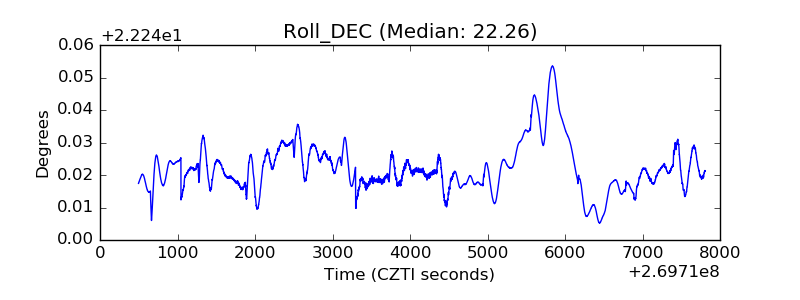 |
| _Roll_RA | 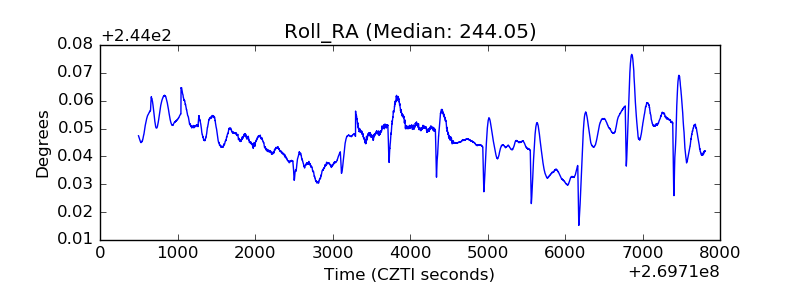 |
| Veto Counter | 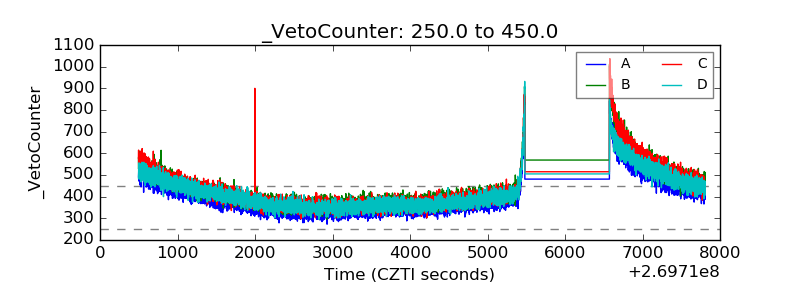 |