| Param | Original file | Final file |
|---|---|---|
| Filename | modeM0/AS1T02_068T01_9000002238_15181cztM0_level2.evt | modeM0/AS1T02_068T01_9000002238_15181cztM0_level2_quad_clean.evt |
| Size (bytes) | 463,838,400 | 92,805,120 |
| Size | 442.4 MB | 88.5 MB |
| Events in quadrant A | 3,717,378 | 595,603 |
| Events in quadrant B | 3,248,904 | 609,075 |
| Events in quadrant C | 3,527,051 | 591,482 |
| Events in quadrant D | 3,122,028 | 570,451 |
| Mode M9 | |||
|---|---|---|---|
| Quadrant | BADHDUFLAG | Total packets | Discarded packets |
| A | 0 | 17 | 0 |
| B | 0 | 17 | 0 |
| C | 0 | 17 | 0 |
| D | 0 | 18 | 0 |
| Mode SS | |||
|---|---|---|---|
| Quadrant | BADHDUFLAG | Total packets | Discarded packets |
| A | 0 | 130 | 0 |
| B | 0 | 130 | 0 |
| C | 0 | 130 | 0 |
| D | 0 | 130 | 0 |
| Mode M0 | |||
|---|---|---|---|
| Quadrant | BADHDUFLAG | Total packets | Discarded packets |
| A | 0 | 15472 | 3 |
| B | 0 | 13754 | 2 |
| C | 0 | 14700 | 2 |
| D | 0 | 13713 | 2 |
| Quadrant | Total seconds | Saturated seconds | Saturation percentage |
|---|---|---|---|
| A | 6360 | 64 | 1.006289% |
| B | 6360 | 63 | 0.990566% |
| C | 6360 | 51 | 0.801887% |
| D | 6360 | 52 | 0.817610% |
Noise dominated data is calculated using 1-second bins in cleaned event files. If a bin has >2000 counts, and if more than 50% of those come from <1% of pixels, then it is considered to be noise-dominated and hence unusable.
| Quadrant | # 1 sec bins | Bins with >0 counts | Bins with >2000 counts | High rate bins dominated by noise | Noise dominated (total time) | Noise dominated (detector-on time) | Marked lightcurve |
|---|---|---|---|---|---|---|---|
| A | 7569 | 6370 | 4 | 4 | 0.05% | 0.06% | 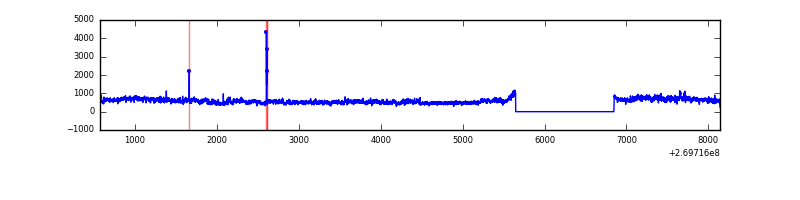 |
| B | 7569 | 6369 | 5 | 5 | 0.07% | 0.08% | 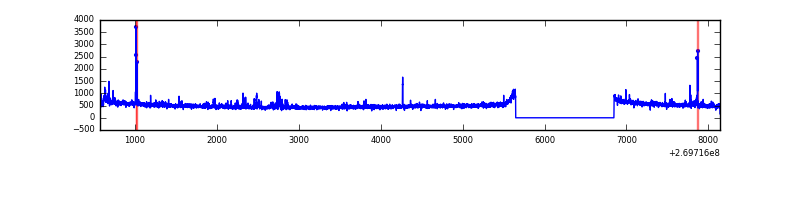 |
| C | 7569 | 6369 | 1 | 1 | 0.01% | 0.02% | 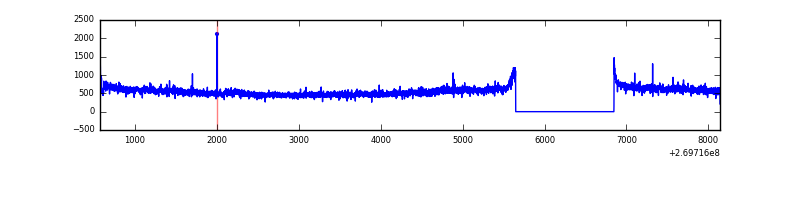 |
| D | 7569 | 6370 | 9 | 9 | 0.12% | 0.14% | 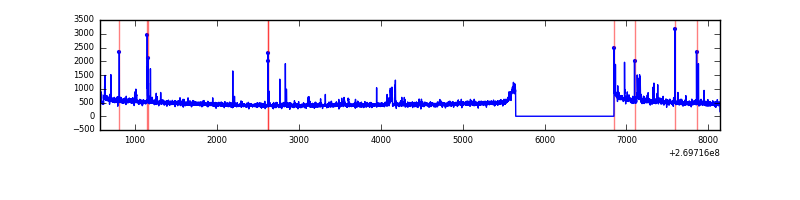 |
Top three noisy pixels from each quadrant. If the there are fewer than three noisy pixels in the level2.evt file, extra rows are filled as -1
| Pixel properties | Quadrant properties | ||||||
|---|---|---|---|---|---|---|---|
| Quadrant | DetID | PixID | Counts | Sigma | Mean | Median | Sigma |
| A | 15 | 239 | 598746 | 3711.88 | 799 | 782 | 161.1 |
| A | 12 | 189 | 23801 | 142.89 | 799 | 782 | 161.1 |
| A | 13 | 248 | 13656 | 79.92 | 799 | 782 | 161.1 |
| B | 0 | 189 | 39305 | 255.0 | 803 | 782 | 151.1 |
| B | 3 | 64 | 21464 | 136.9 | 803 | 782 | 151.1 |
| B | 0 | 190 | 19043 | 120.87 | 803 | 782 | 151.1 |
| C | 3 | 233 | 471163 | 2585.69 | 783 | 787 | 181.9 |
| C | 13 | 61 | 5456 | 25.67 | 783 | 787 | 181.9 |
| C | 14 | 234 | 2886 | 11.54 | 783 | 787 | 181.9 |
| D | 10 | 70 | 61173 | 321.48 | 780 | 759 | 187.9 |
| D | 2 | 33 | 28151 | 145.76 | 780 | 759 | 187.9 |
| D | 2 | 234 | 23372 | 120.33 | 780 | 759 | 187.9 |
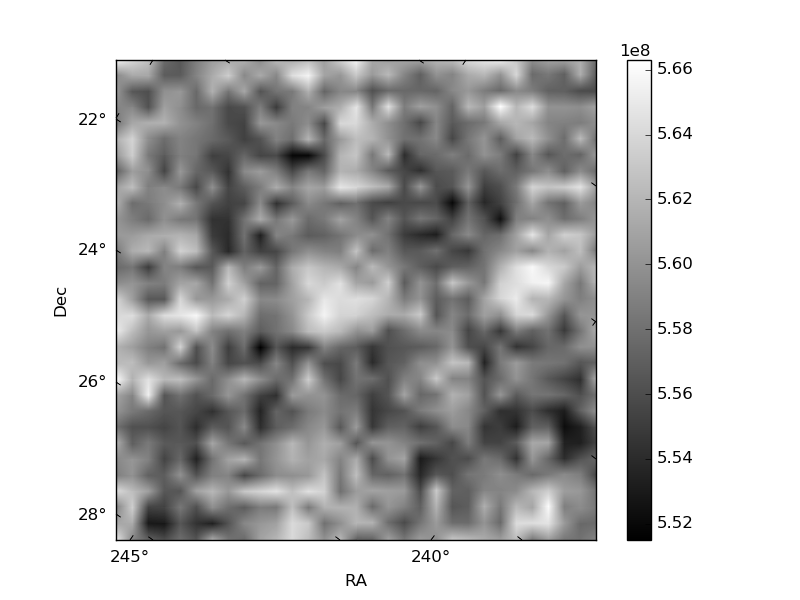
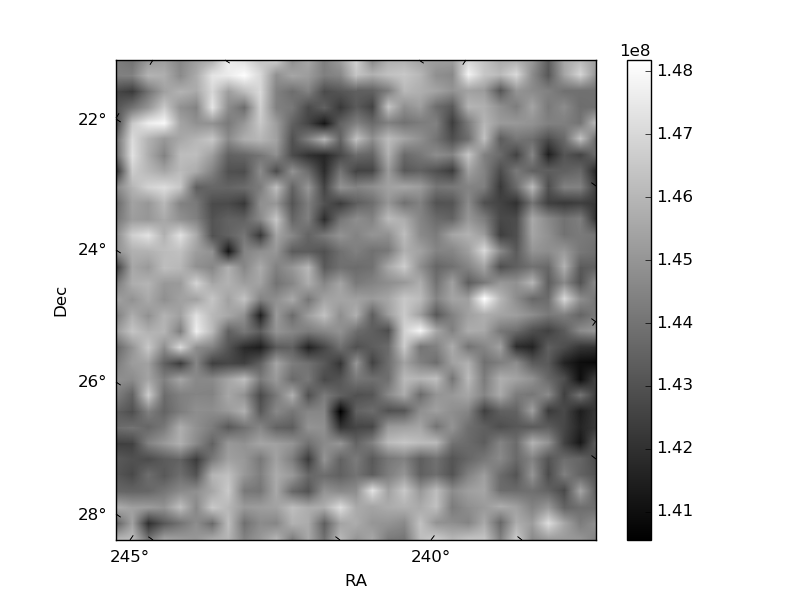
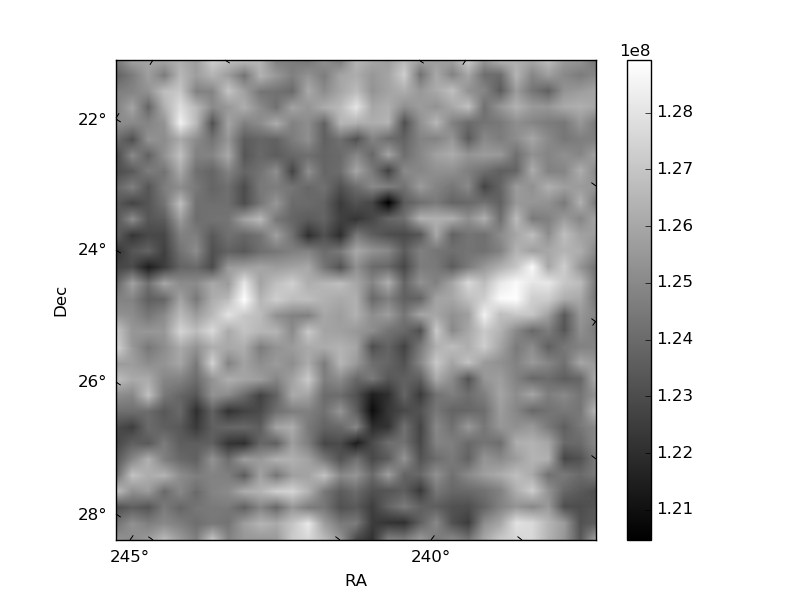
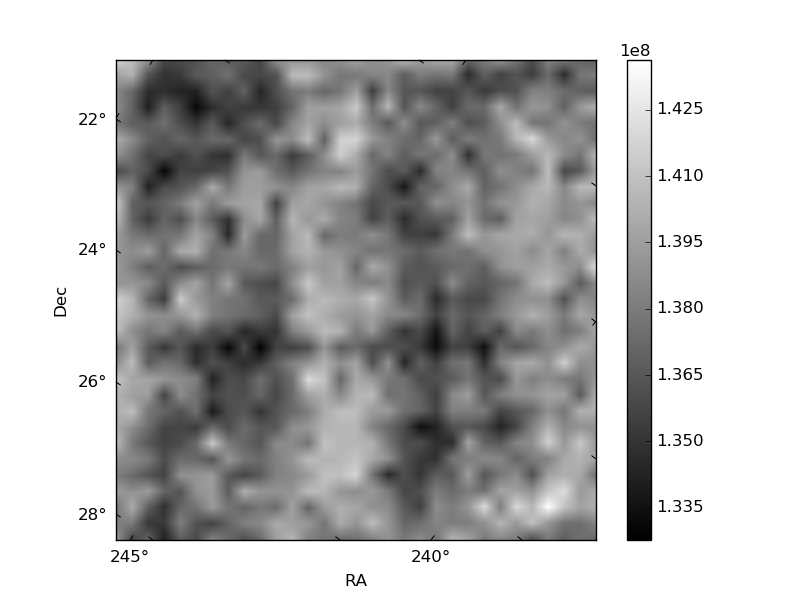
Histogram calculated using DETX and DETY for each event in the final _common_clean file
| Quadrant A | 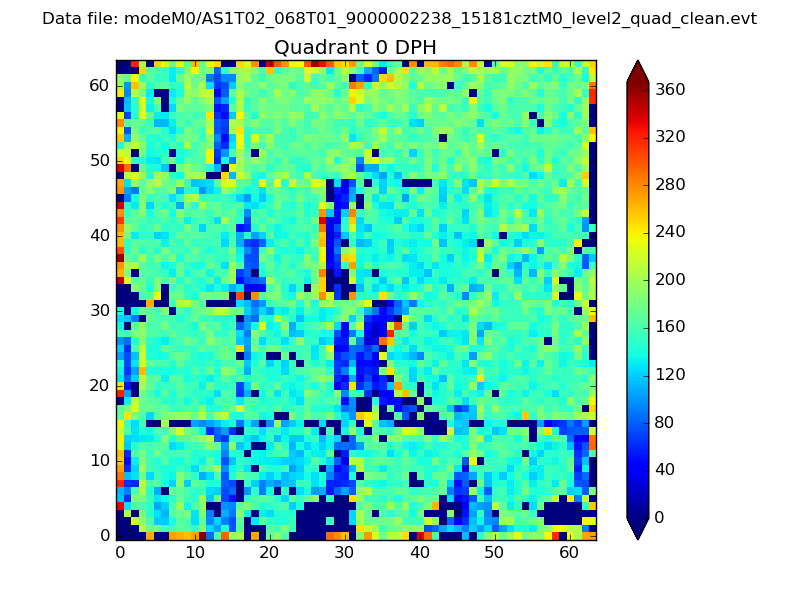 |
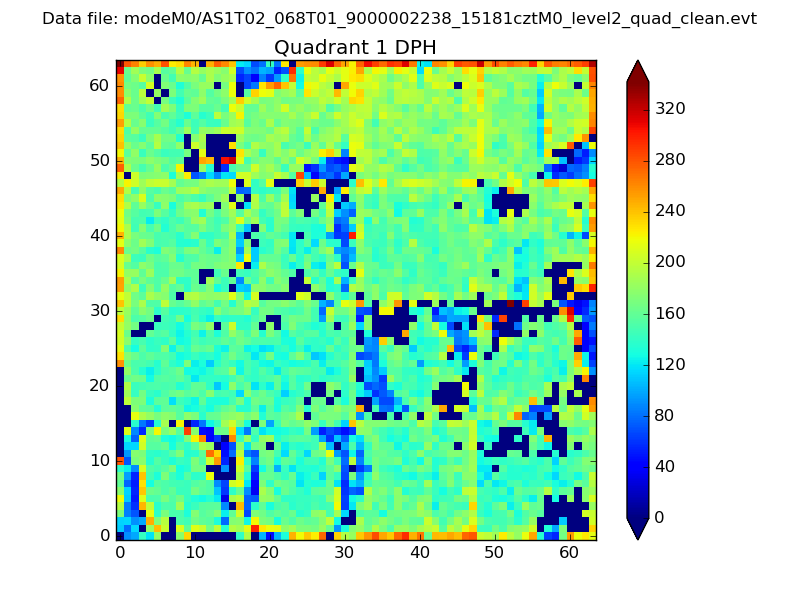 |
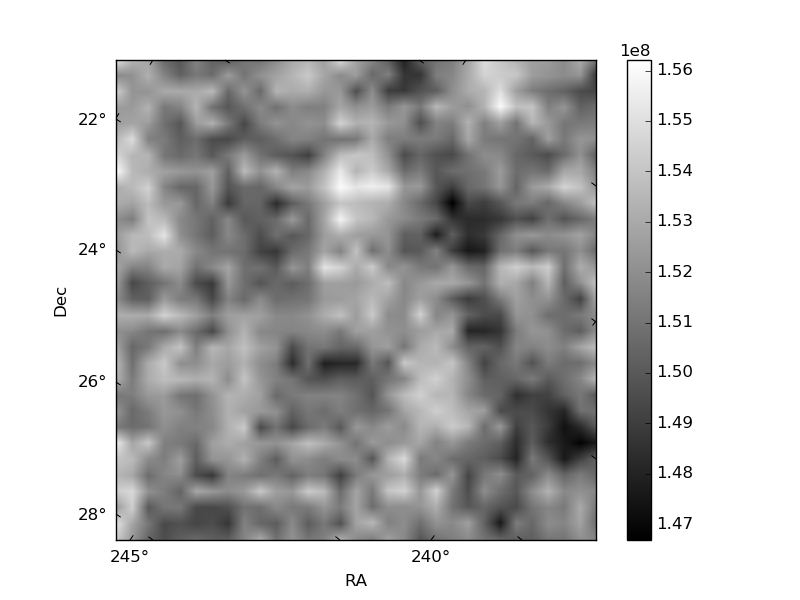
Quadrant B |
|---|---|---|---|
| Quadrant D | 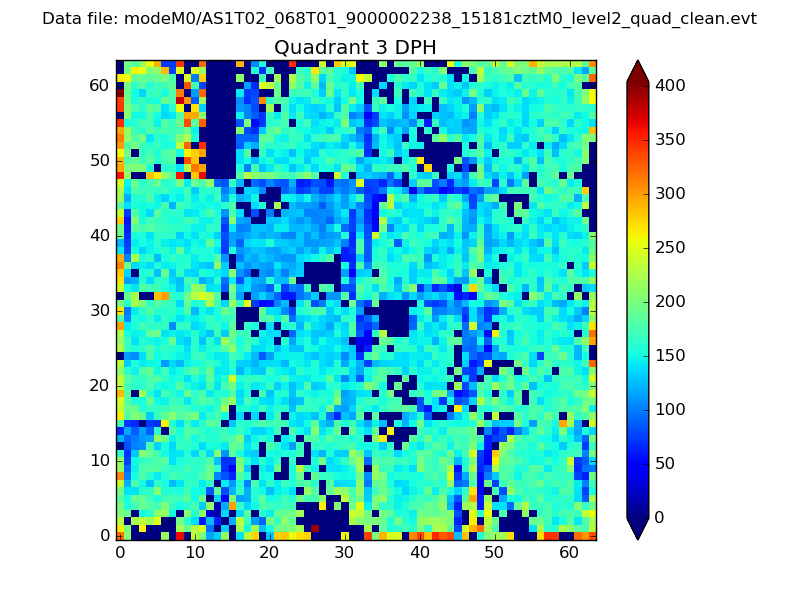 |
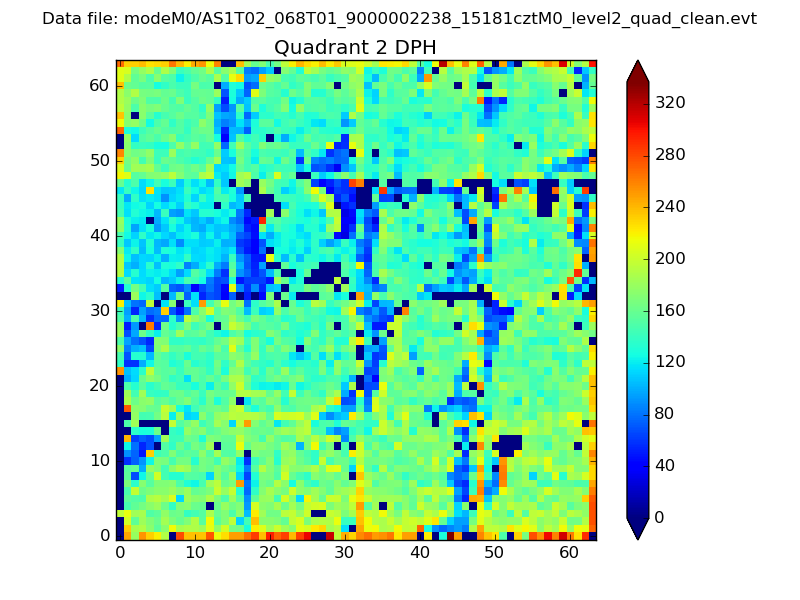 |
Quadrant C |
| Plot type | Count rate plots | Images |
|---|---|---|
| Comparison with Poisson distribution Blue bars denote a histogram of data divided into 1 sec bins. Red curve is a Poisson curve with rate = median count rate of data. |
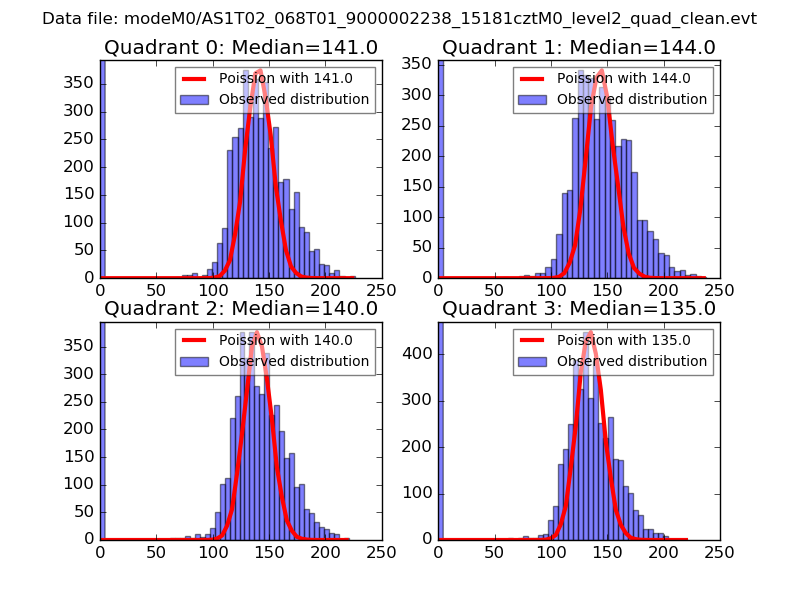 |
 |
| Quadrant-wise count rates Data is divided into 100 sec bins |
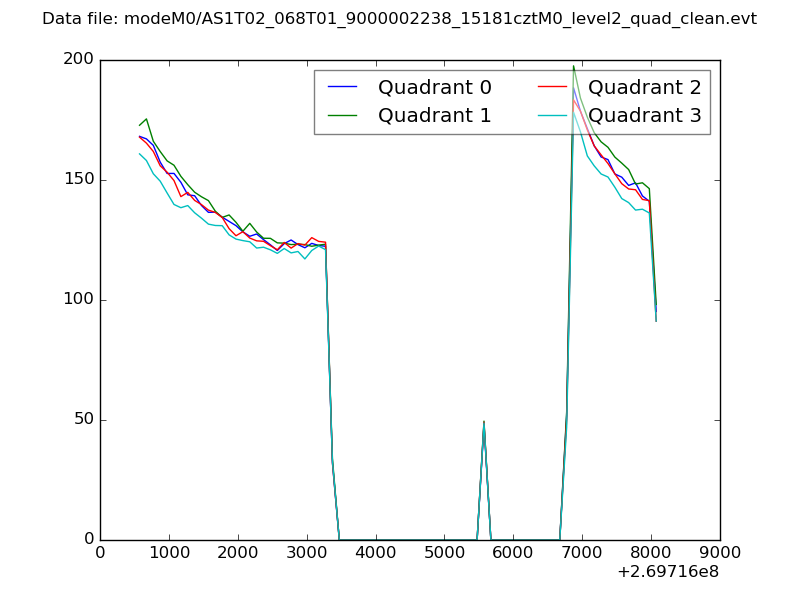 |
|
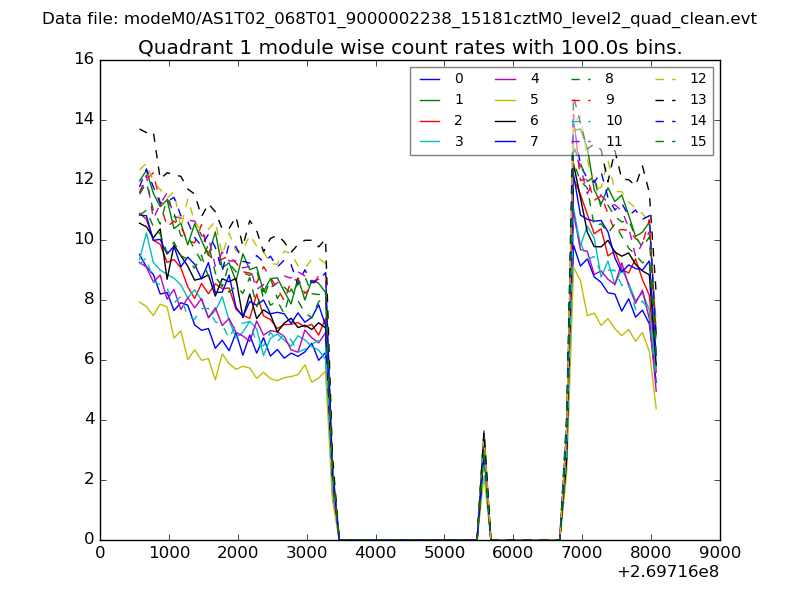
| Module-wise count rates for Quadrant A Data is divided into 100 sec bins |
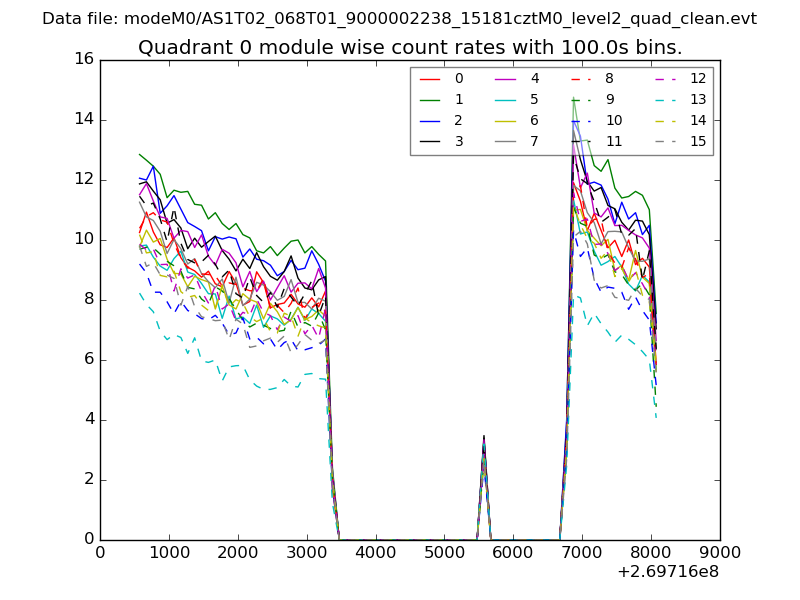 |
 |
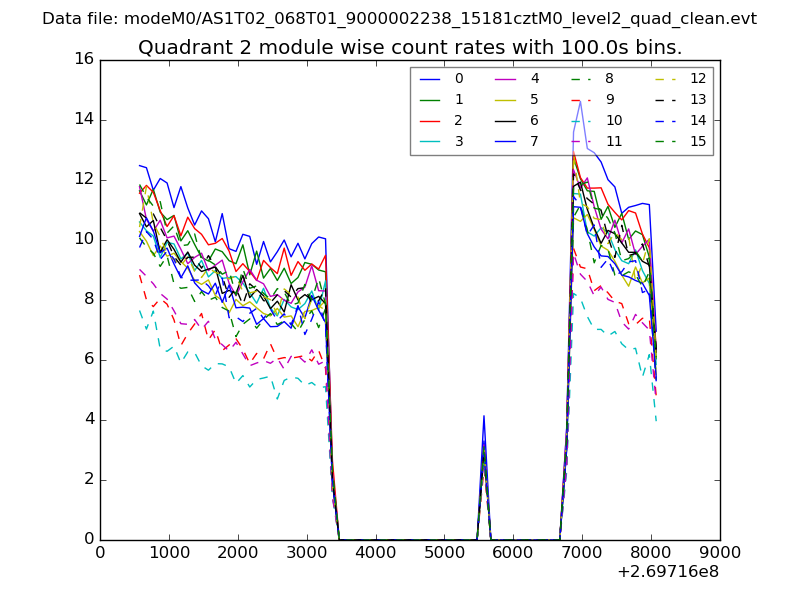
| Module-wise count rates for Quadrant B Data is divided into 100 sec bins |
 |
 |
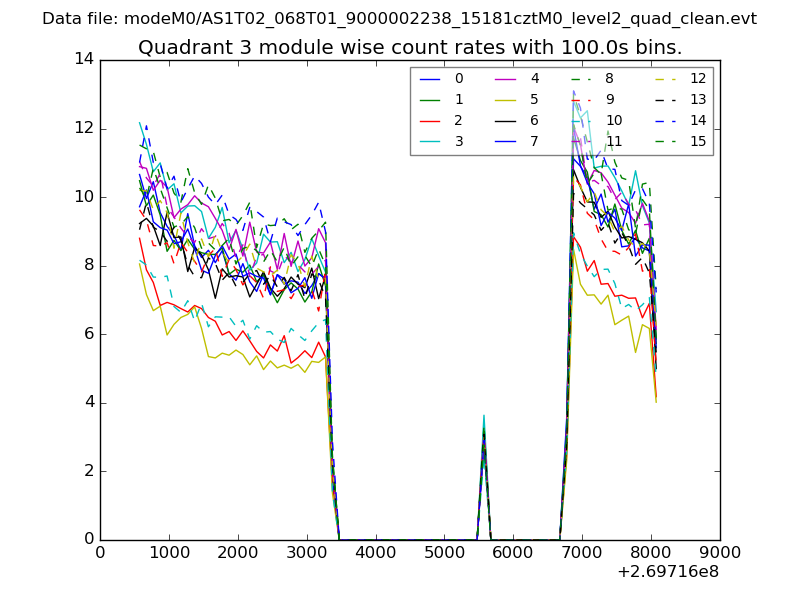
| Module-wise count rates for Quadrant C Data is divided into 100 sec bins |
 |
 |
| Module-wise count rates for Quadrant D Data is divided into 100 sec bins |
 |
 |
| Parameter | Plot |
|---|---|
| CZT HV Monitor | 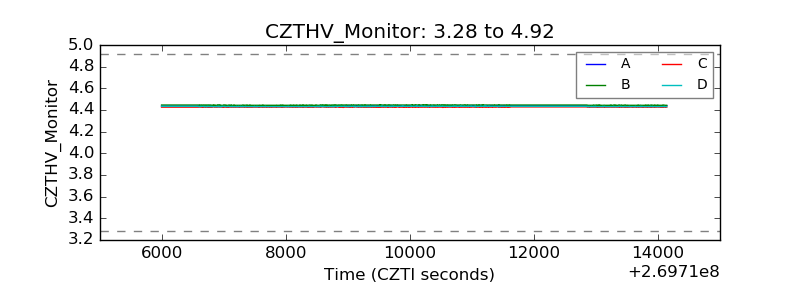 |
| D_VDD | 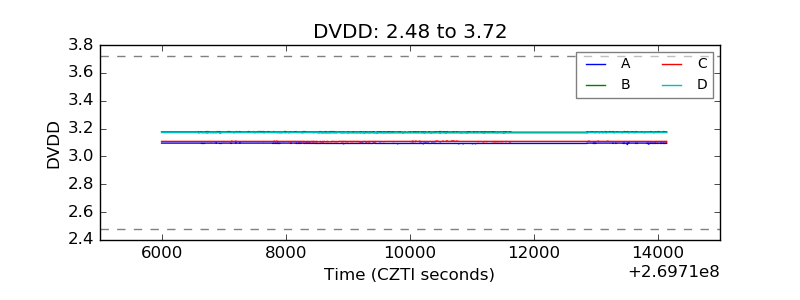 |
| Temperature 1 | 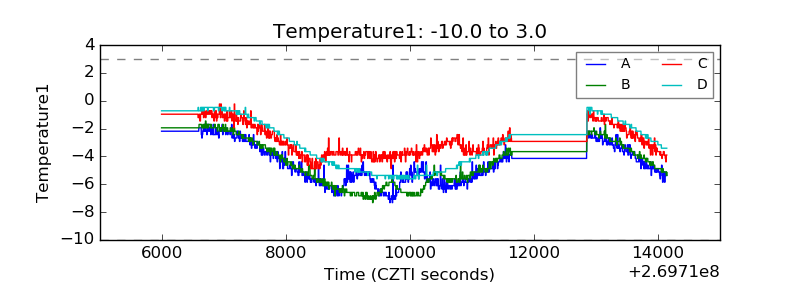 |
| Veto HV Monitor | 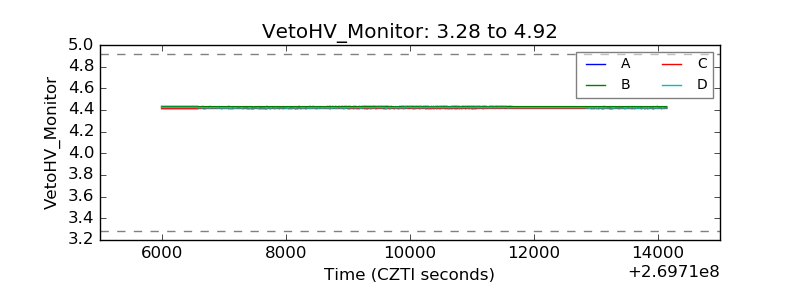 |
| Veto LLD | 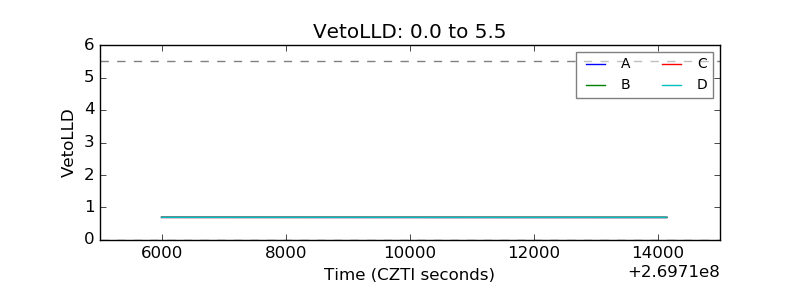 |
| Alpha Counter | 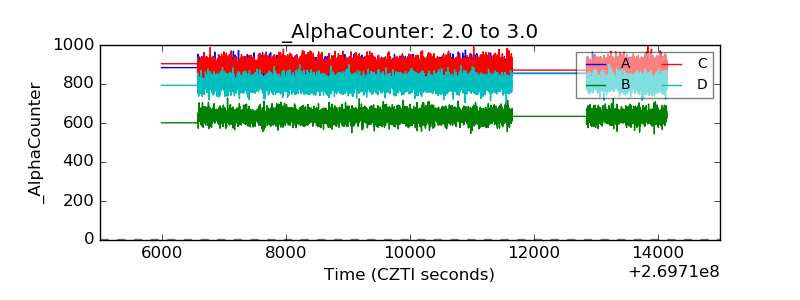 |
| _CPM_Rate | 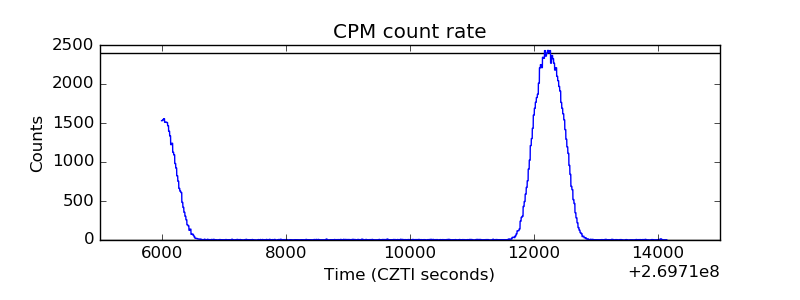 |
| CZT Counter | 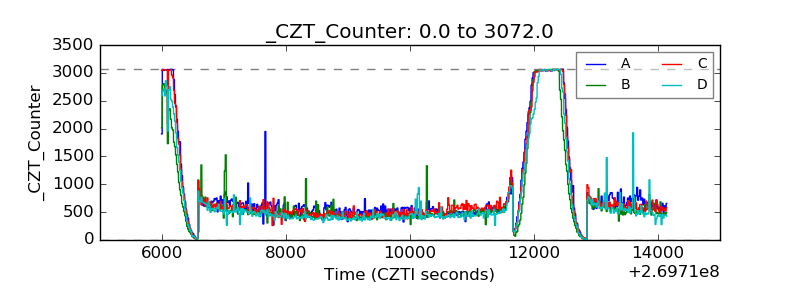 |
| +2.5 Volts monitor | 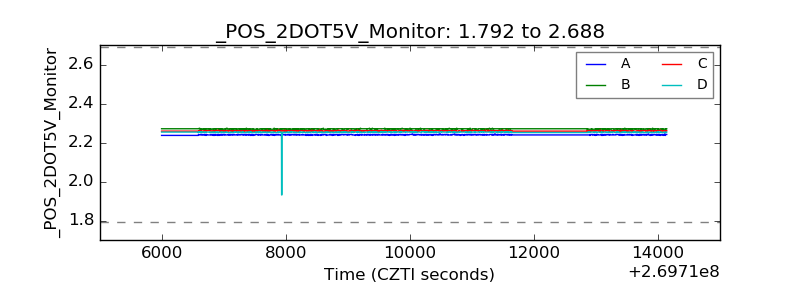 |
| +5 Volts monitor |  |
| _ROLL_ROT | 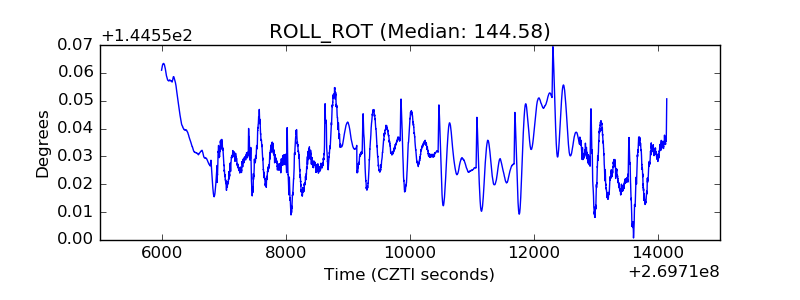 |
| _Roll_DEC | 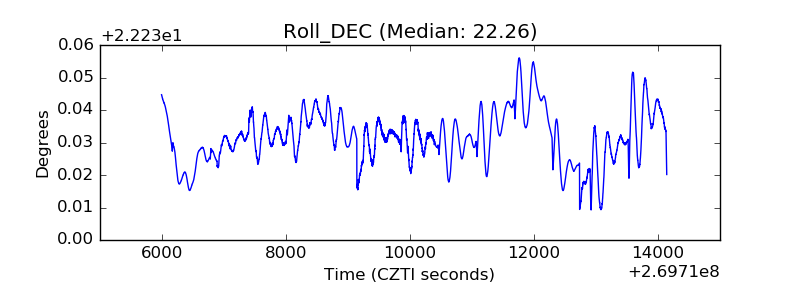 |
| _Roll_RA | 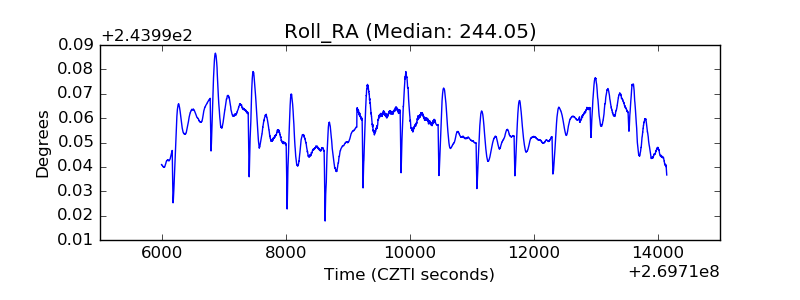 |
| Veto Counter | 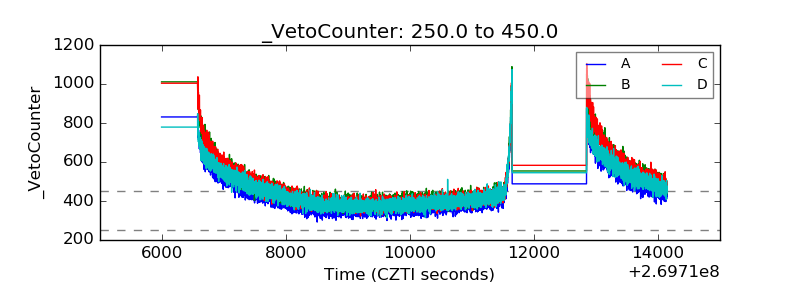 |