| Param | Original file | Final file |
|---|---|---|
| Filename | modeM0/AS1T02_068T01_9000002238_15183cztM0_level2.evt | modeM0/AS1T02_068T01_9000002238_15183cztM0_level2_quad_clean.evt |
| Size (bytes) | 460,756,800 | 93,988,800 |
| Size | 439.4 MB | 89.6 MB |
| Events in quadrant A | 3,600,184 | 611,487 |
| Events in quadrant B | 3,329,335 | 630,930 |
| Events in quadrant C | 3,460,465 | 604,897 |
| Events in quadrant D | 3,144,309 | 567,455 |
| Mode M9 | |||
|---|---|---|---|
| Quadrant | BADHDUFLAG | Total packets | Discarded packets |
| A | 0 | 25 | 0 |
| B | 0 | 25 | 0 |
| C | 0 | 25 | 0 |
| D | 0 | 26 | 0 |
| Mode SS | |||
|---|---|---|---|
| Quadrant | BADHDUFLAG | Total packets | Discarded packets |
| A | 0 | 124 | 0 |
| B | 0 | 124 | 0 |
| C | 0 | 124 | 0 |
| D | 0 | 124 | 0 |
| Mode M0 | |||
|---|---|---|---|
| Quadrant | BADHDUFLAG | Total packets | Discarded packets |
| A | 0 | 14889 | 3 |
| B | 0 | 13740 | 2 |
| C | 0 | 14049 | 2 |
| D | 0 | 13564 | 2 |
| Quadrant | Total seconds | Saturated seconds | Saturation percentage |
|---|---|---|---|
| A | 6188 | 32 | 0.517130% |
| B | 6188 | 74 | 1.195863% |
| C | 6188 | 25 | 0.404008% |
| D | 6188 | 62 | 1.001939% |
Noise dominated data is calculated using 1-second bins in cleaned event files. If a bin has >2000 counts, and if more than 50% of those come from <1% of pixels, then it is considered to be noise-dominated and hence unusable.
| Quadrant | # 1 sec bins | Bins with >0 counts | Bins with >2000 counts | High rate bins dominated by noise | Noise dominated (total time) | Noise dominated (detector-on time) | Marked lightcurve |
|---|---|---|---|---|---|---|---|
| A | 7574 | 6189 | 0 | 0 | 0.00% | 0.00% | 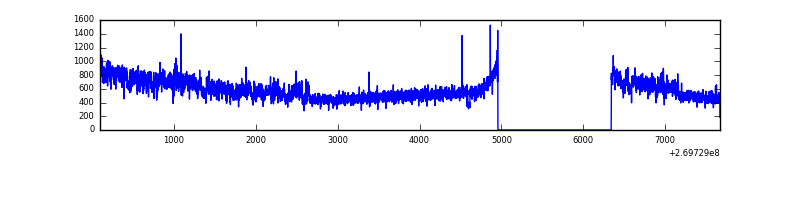 |
| B | 7574 | 6189 | 24 | 24 | 0.32% | 0.39% | 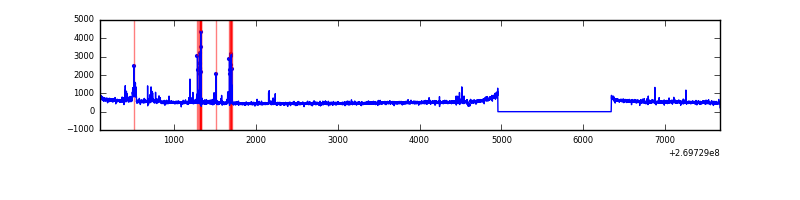 |
| C | 7574 | 6189 | 0 | 0 | 0.00% | 0.00% | 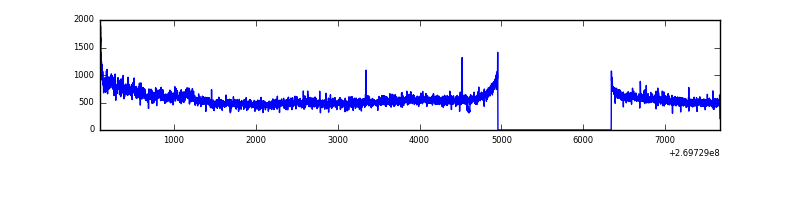 |
| D | 7573 | 6188 | 23 | 23 | 0.30% | 0.37% | 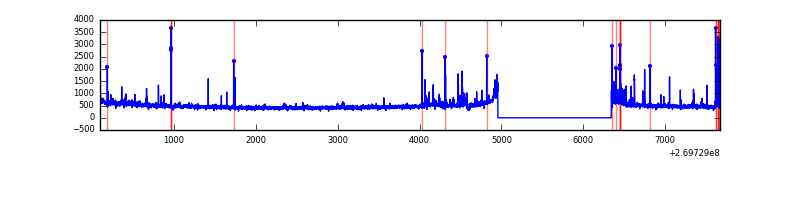 |
Top three noisy pixels from each quadrant. If the there are fewer than three noisy pixels in the level2.evt file, extra rows are filled as -1
| Pixel properties | Quadrant properties | ||||||
|---|---|---|---|---|---|---|---|
| Quadrant | DetID | PixID | Counts | Sigma | Mean | Median | Sigma |
| A | 15 | 239 | 510526 | 3199.45 | 797 | 783 | 159.3 |
| A | 12 | 189 | 28884 | 176.38 | 797 | 783 | 159.3 |
| A | 0 | 226 | 6979 | 38.89 | 797 | 783 | 159.3 |
| B | 3 | 64 | 129884 | 866.13 | 804 | 788 | 149.0 |
| B | 0 | 197 | 18310 | 117.56 | 804 | 788 | 149.0 |
| B | 12 | 111 | 16846 | 107.74 | 804 | 788 | 149.0 |
| C | 3 | 233 | 429130 | 2386.43 | 777 | 783 | 179.5 |
| C | 13 | 61 | 5633 | 27.02 | 777 | 783 | 179.5 |
| C | 3 | 202 | 1849 | 5.94 | 777 | 783 | 179.5 |
| D | 13 | 249 | 117309 | 627.64 | 765 | 744 | 185.7 |
| D | 2 | 33 | 38258 | 201.99 | 765 | 744 | 185.7 |
| D | 7 | 38 | 27716 | 145.23 | 765 | 744 | 185.7 |
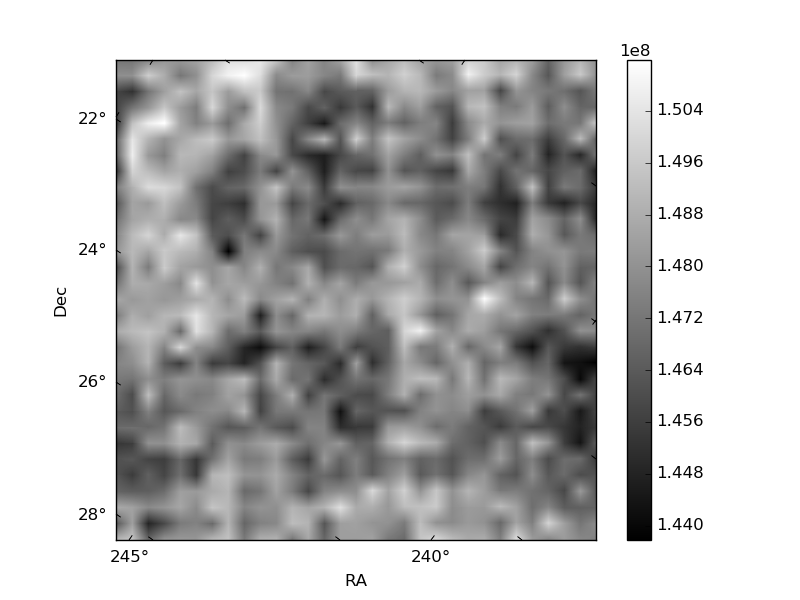
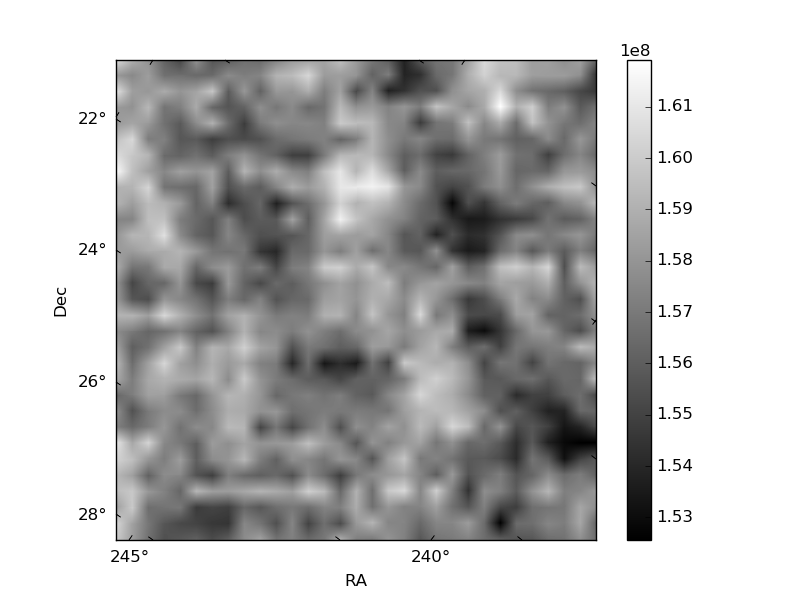
Histogram calculated using DETX and DETY for each event in the final _common_clean file
| Quadrant A | 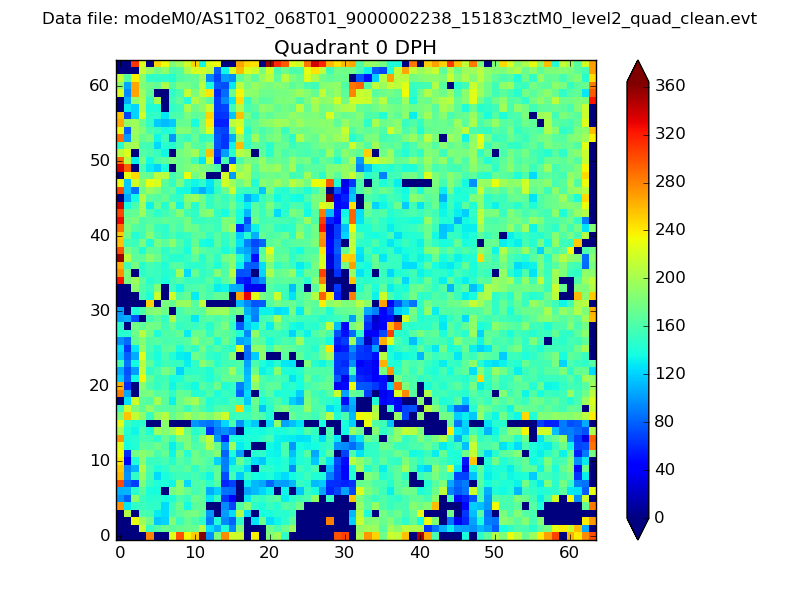 |
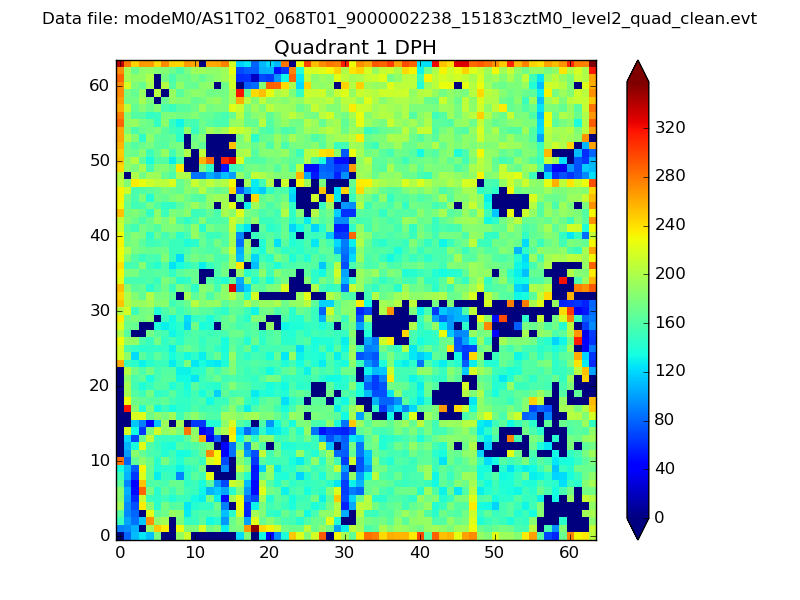 |
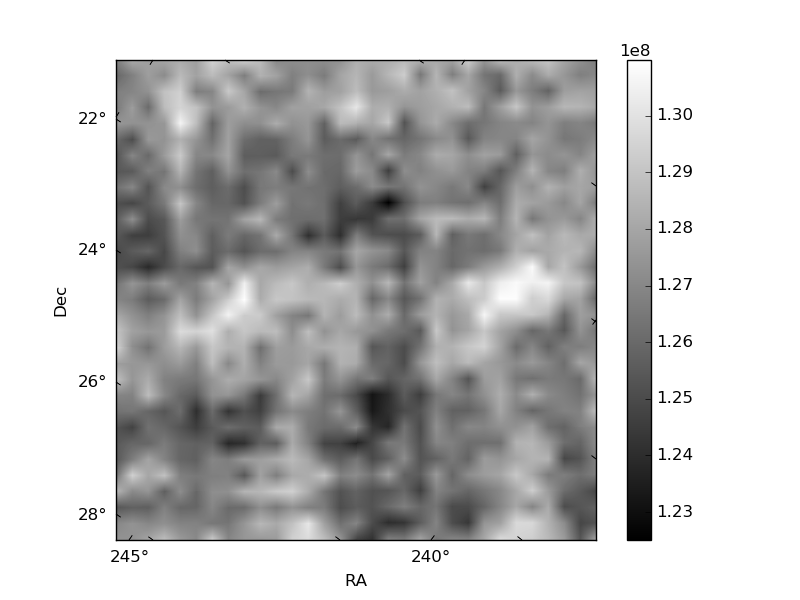
Quadrant B |
|---|---|---|---|
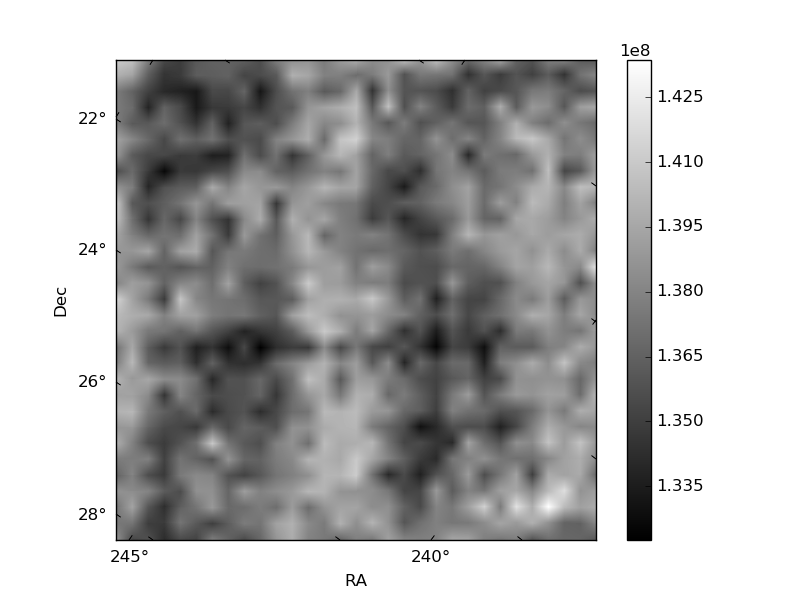
| Quadrant D | 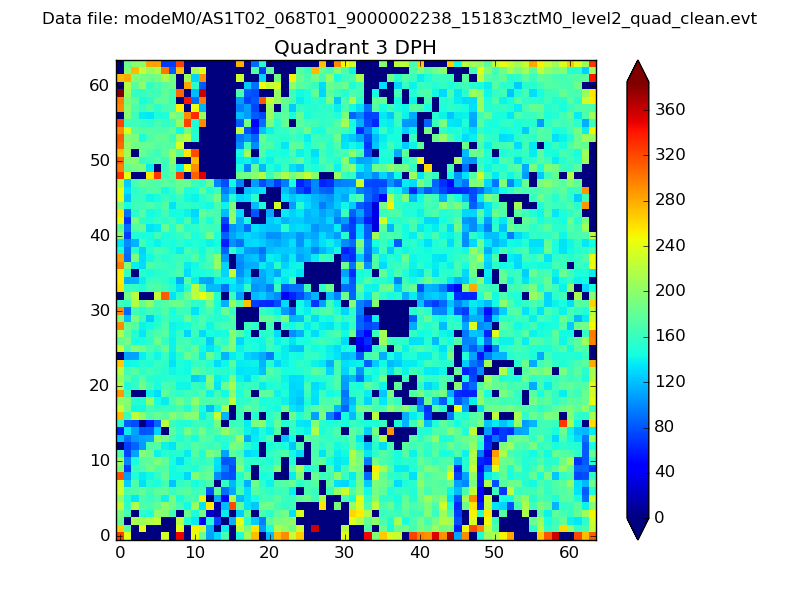 |
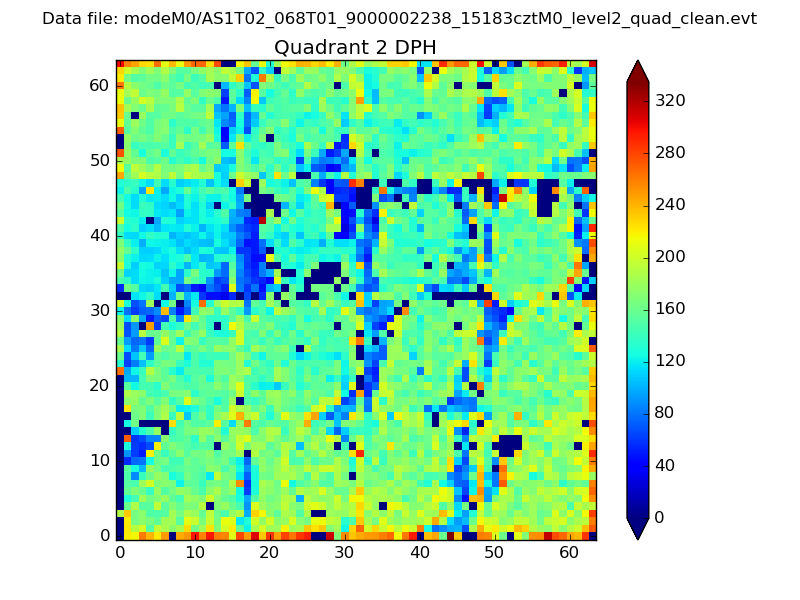 |
Quadrant C |
| Plot type | Count rate plots | Images |
|---|---|---|
| Comparison with Poisson distribution Blue bars denote a histogram of data divided into 1 sec bins. Red curve is a Poisson curve with rate = median count rate of data. |
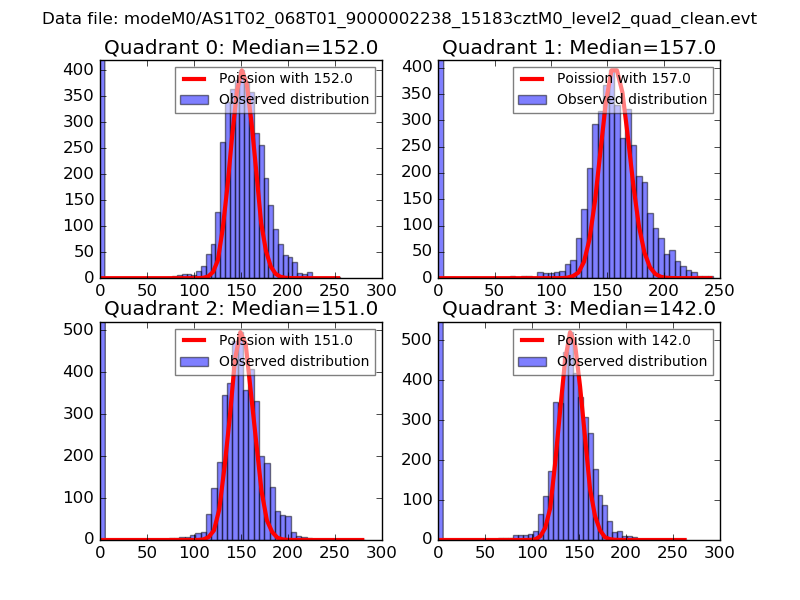 |
 |
| Quadrant-wise count rates Data is divided into 100 sec bins |
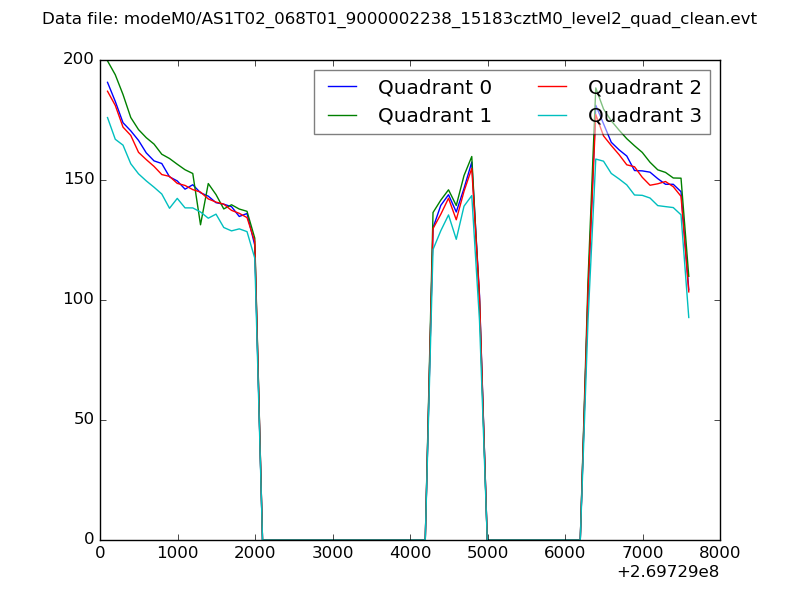 |
|
| Module-wise count rates for Quadrant A Data is divided into 100 sec bins |
 |
 |
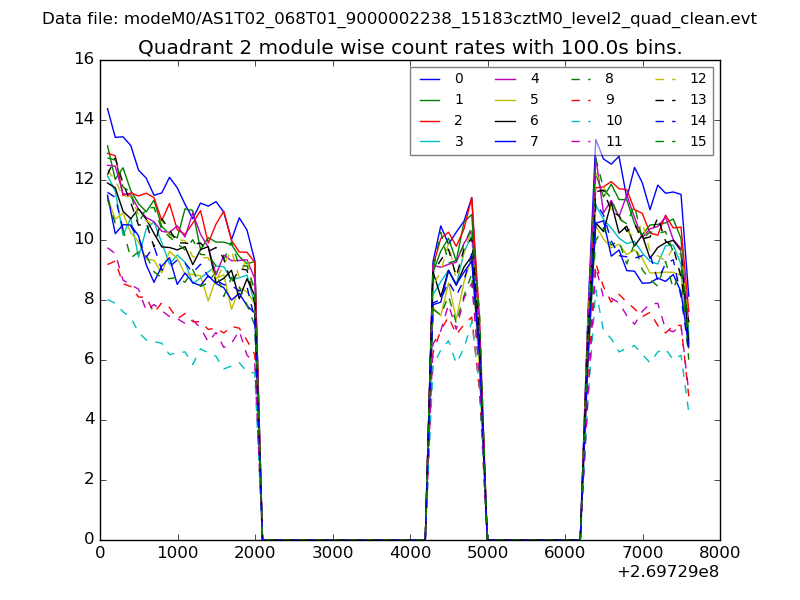
| Module-wise count rates for Quadrant B Data is divided into 100 sec bins |
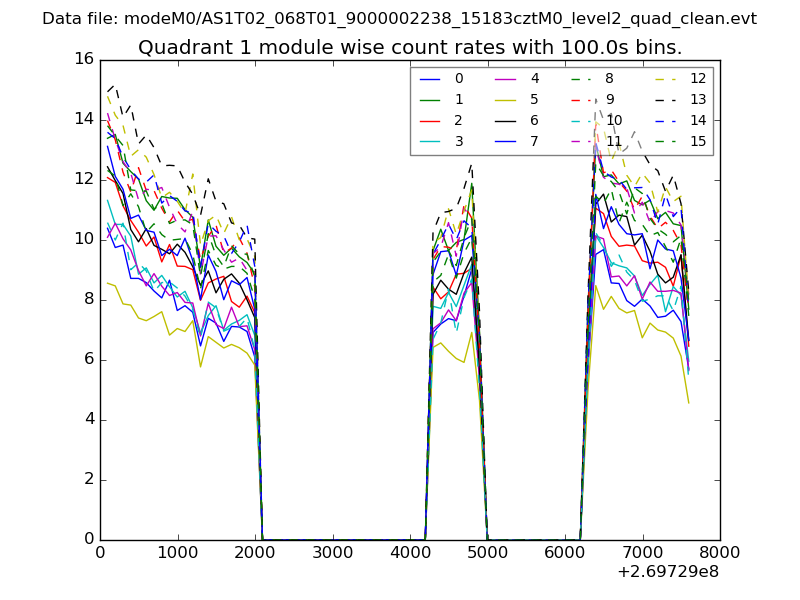 |
 |
| Module-wise count rates for Quadrant C Data is divided into 100 sec bins |
 |
 |
| Module-wise count rates for Quadrant D Data is divided into 100 sec bins |
 |
 |
| Parameter | Plot |
|---|---|
| CZT HV Monitor | 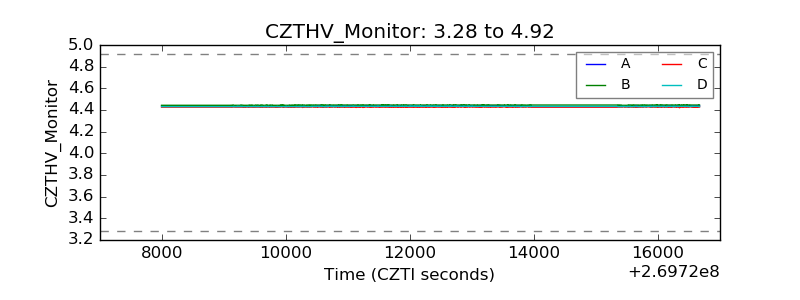 |
| D_VDD | 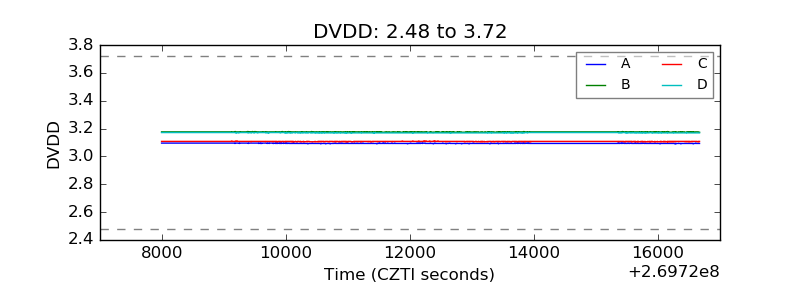 |
| Temperature 1 | 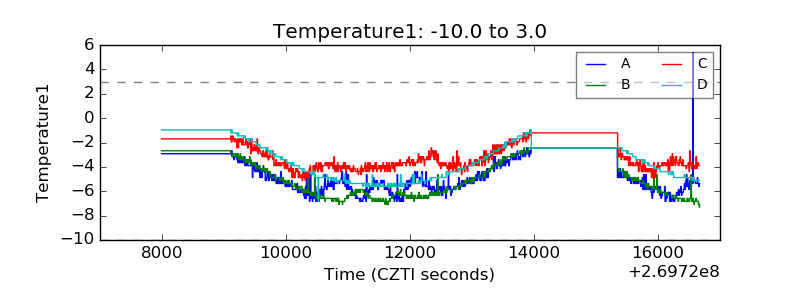 |
| Veto HV Monitor | 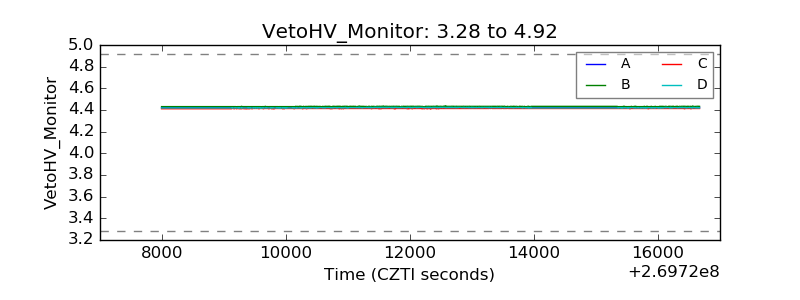 |
| Veto LLD | 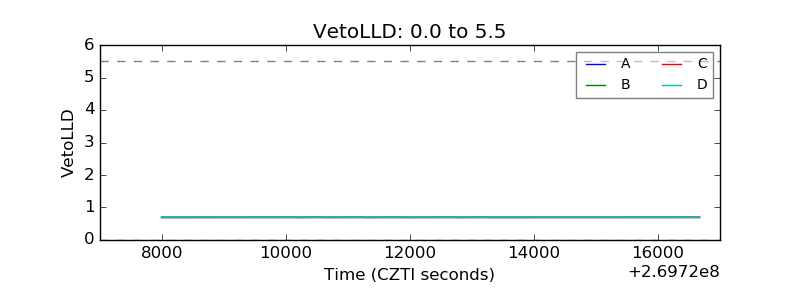 |
| Alpha Counter | 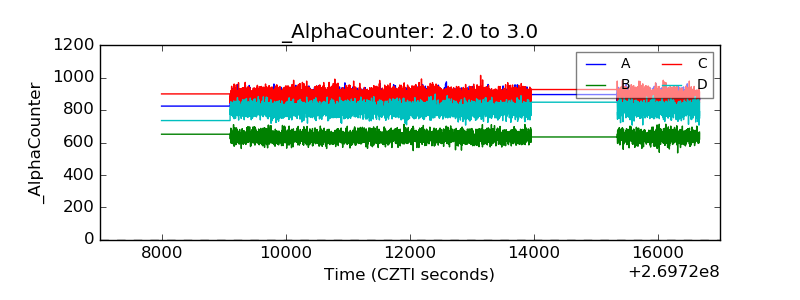 |
| _CPM_Rate | 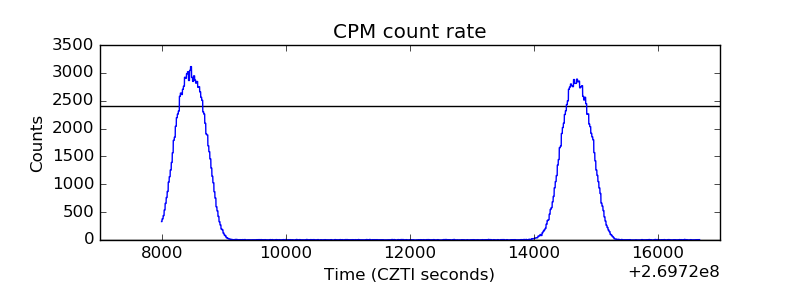 |
| CZT Counter |  |
| +2.5 Volts monitor |  |
| +5 Volts monitor | 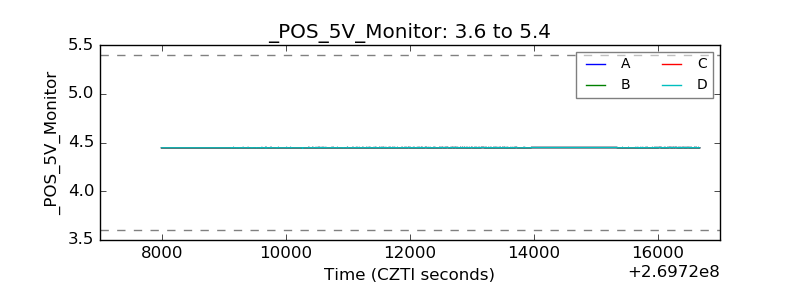 |
| _ROLL_ROT |  |
| _Roll_DEC |  |
| _Roll_RA |  |
| Veto Counter |  |