| Param | Original file | Final file |
|---|---|---|
| Filename | modeM0/AS1T02_068T01_9000002238_15184cztM0_level2.evt | modeM0/AS1T02_068T01_9000002238_15184cztM0_level2_quad_clean.evt |
| Size (bytes) | 442,463,040 | 89,573,760 |
| Size | 422.0 MB | 85.4 MB |
| Events in quadrant A | 3,365,877 | 579,572 |
| Events in quadrant B | 3,130,875 | 597,959 |
| Events in quadrant C | 3,320,344 | 571,778 |
| Events in quadrant D | 3,168,532 | 537,378 |
| Mode M9 | |||
|---|---|---|---|
| Quadrant | BADHDUFLAG | Total packets | Discarded packets |
| A | 0 | 22 | 0 |
| B | 0 | 22 | 0 |
| C | 0 | 22 | 0 |
| D | 0 | 23 | 0 |
| Mode SS | |||
|---|---|---|---|
| Quadrant | BADHDUFLAG | Total packets | Discarded packets |
| A | 0 | 126 | 0 |
| B | 0 | 126 | 0 |
| C | 0 | 126 | 0 |
| D | 0 | 126 | 0 |
| Mode M0 | |||
|---|---|---|---|
| Quadrant | BADHDUFLAG | Total packets | Discarded packets |
| A | 0 | 14137 | 3 |
| B | 0 | 12996 | 2 |
| C | 0 | 13522 | 2 |
| D | 0 | 13559 | 2 |
| Quadrant | Total seconds | Saturated seconds | Saturation percentage |
|---|---|---|---|
| A | 6094 | 37 | 0.607155% |
| B | 6094 | 28 | 0.459468% |
| C | 6094 | 15 | 0.246144% |
| D | 6094 | 63 | 1.033804% |
Noise dominated data is calculated using 1-second bins in cleaned event files. If a bin has >2000 counts, and if more than 50% of those come from <1% of pixels, then it is considered to be noise-dominated and hence unusable.
| Quadrant | # 1 sec bins | Bins with >0 counts | Bins with >2000 counts | High rate bins dominated by noise | Noise dominated (total time) | Noise dominated (detector-on time) | Marked lightcurve |
|---|---|---|---|---|---|---|---|
| A | 7470 | 6096 | 0 | 0 | 0.00% | 0.00% | 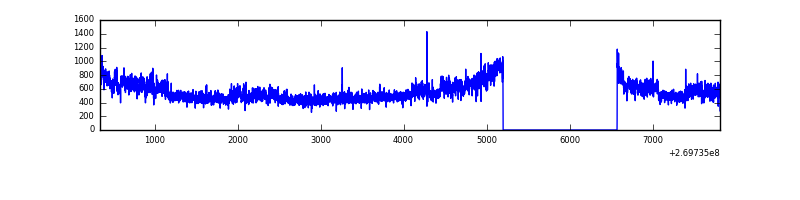 |
| B | 7470 | 6096 | 0 | 0 | 0.00% | 0.00% |  |
| C | 7470 | 6096 | 0 | 0 | 0.00% | 0.00% | 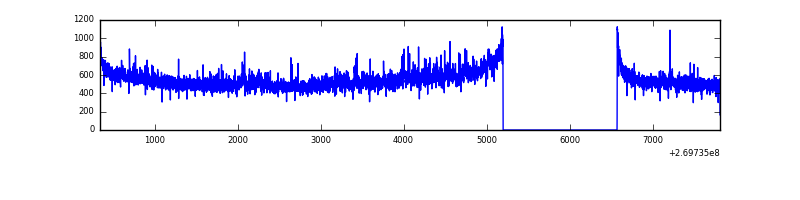 |
| D | 7470 | 6096 | 38 | 38 | 0.51% | 0.62% | 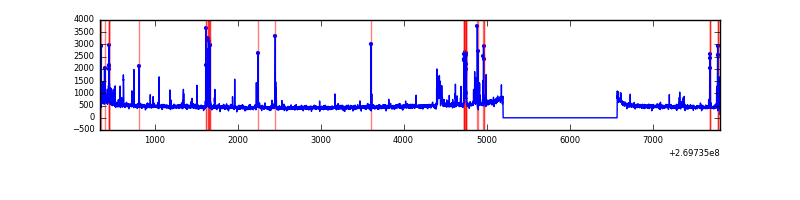 |
Top three noisy pixels from each quadrant. If the there are fewer than three noisy pixels in the level2.evt file, extra rows are filled as -1
| Pixel properties | Quadrant properties | ||||||
|---|---|---|---|---|---|---|---|
| Quadrant | DetID | PixID | Counts | Sigma | Mean | Median | Sigma |
| A | 15 | 239 | 364043 | 2325.19 | 777 | 763 | 156.2 |
| A | 12 | 189 | 17276 | 105.69 | 777 | 763 | 156.2 |
| A | 0 | 226 | 6710 | 38.06 | 777 | 763 | 156.2 |
| B | 12 | 111 | 17102 | 111.23 | 787 | 768 | 146.9 |
| B | 3 | 209 | 15907 | 103.09 | 787 | 768 | 146.9 |
| B | 11 | 111 | 14304 | 92.17 | 787 | 768 | 146.9 |
| C | 3 | 233 | 376941 | 2162.92 | 755 | 761 | 173.9 |
| C | 13 | 61 | 5476 | 27.11 | 755 | 761 | 173.9 |
| C | 7 | 247 | 2262 | 8.63 | 755 | 761 | 173.9 |
| D | 2 | 33 | 232884 | 1282.38 | 744 | 724 | 181.0 |
| D | 13 | 249 | 56613 | 308.71 | 744 | 724 | 181.0 |
| D | 2 | 120 | 26802 | 144.05 | 744 | 724 | 181.0 |
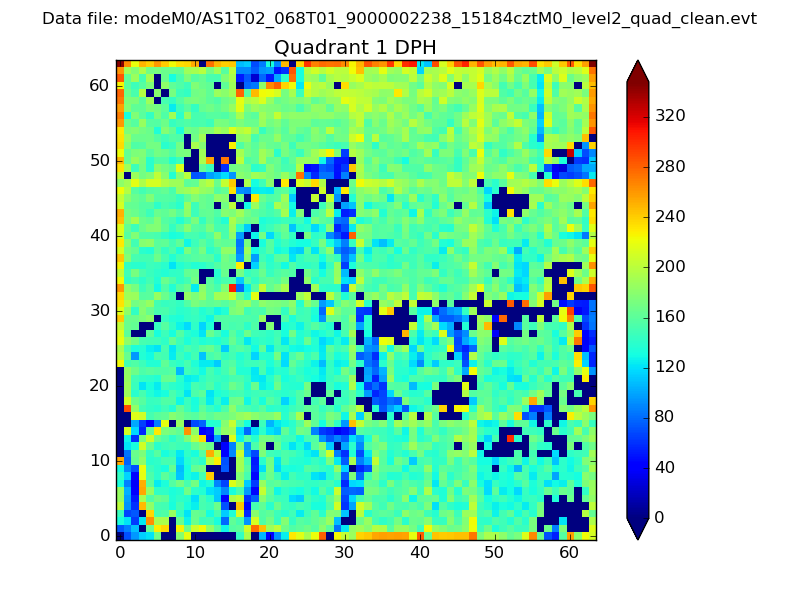
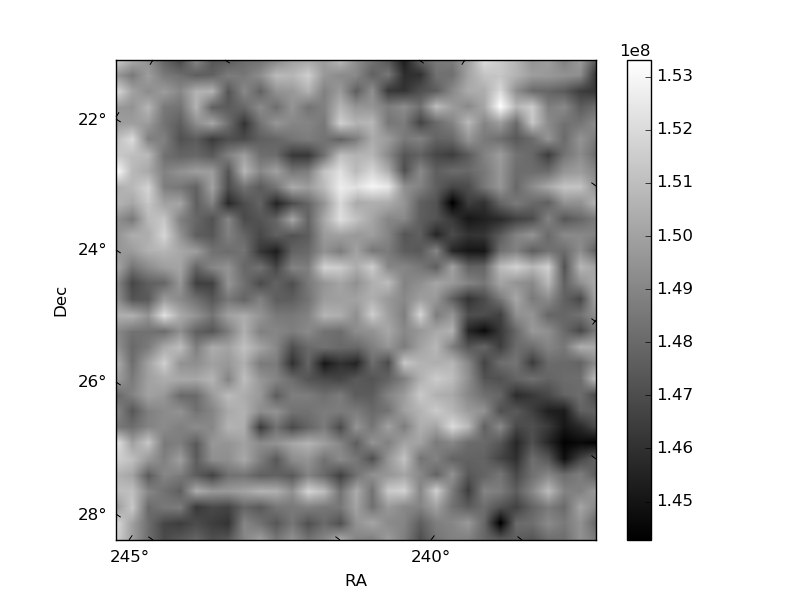
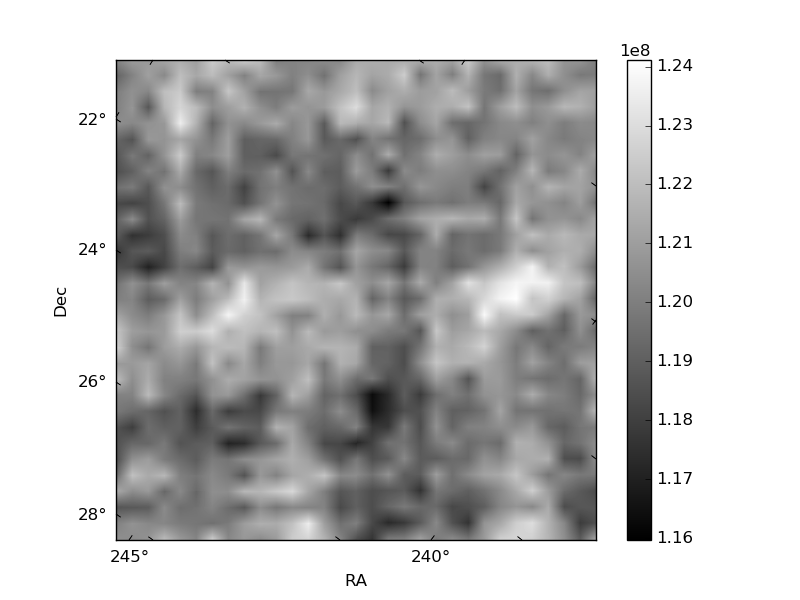
Histogram calculated using DETX and DETY for each event in the final _common_clean file
| Quadrant A | 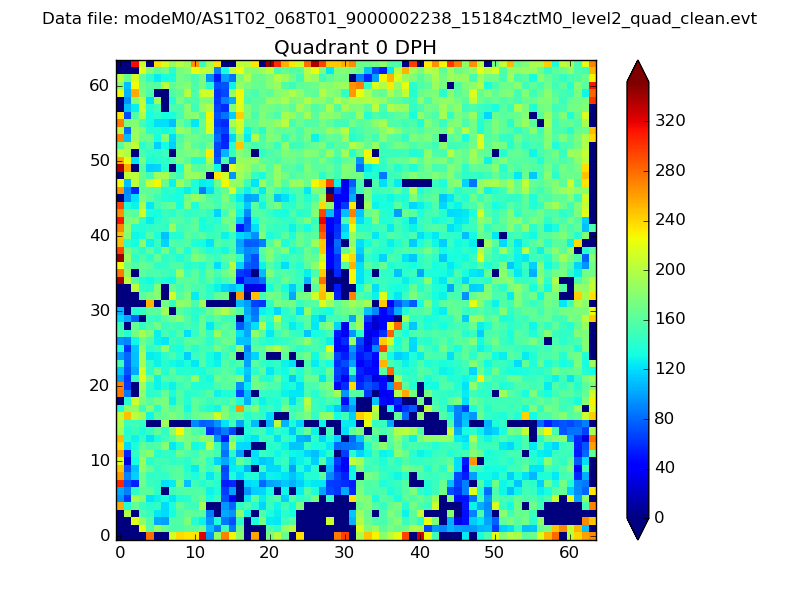 |
 |
Quadrant B |
|---|---|---|---|
| Quadrant D | 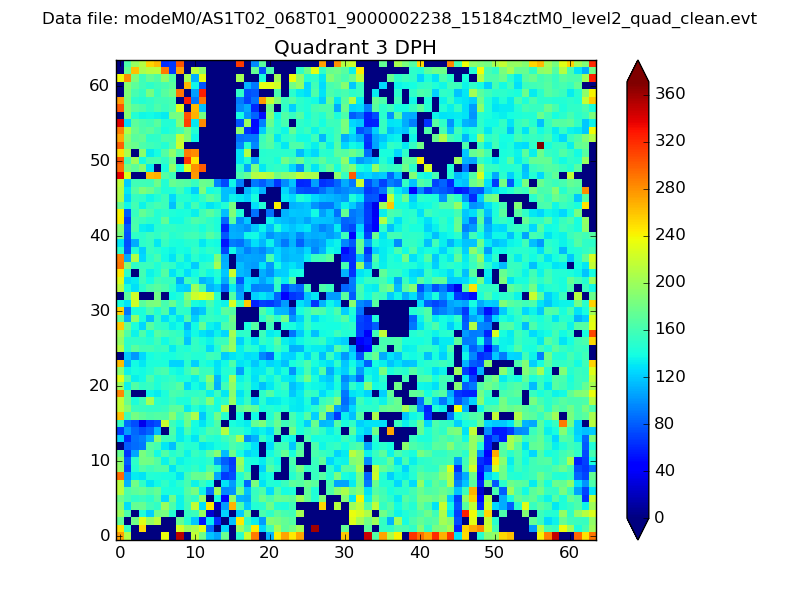 |
 |
Quadrant C |
| Plot type | Count rate plots | Images |
|---|---|---|
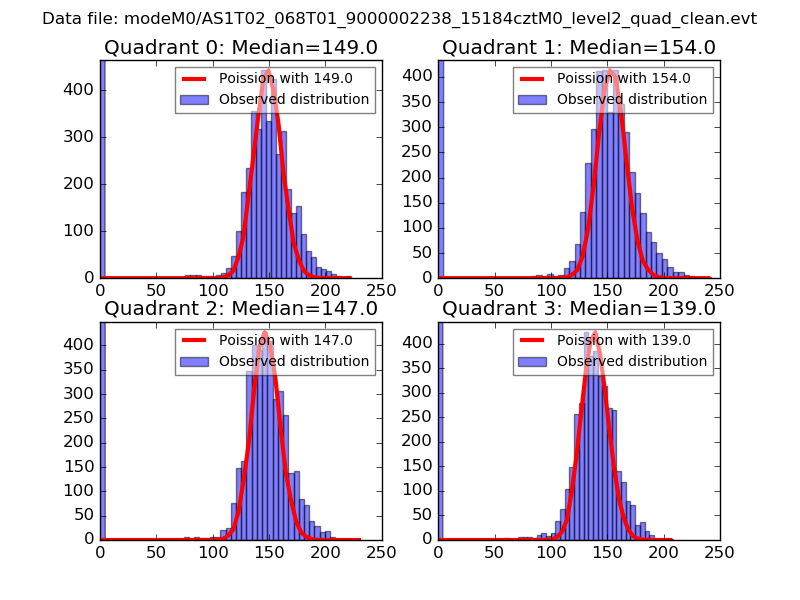
| Comparison with Poisson distribution Blue bars denote a histogram of data divided into 1 sec bins. Red curve is a Poisson curve with rate = median count rate of data. |
 |
 |
| Quadrant-wise count rates Data is divided into 100 sec bins |
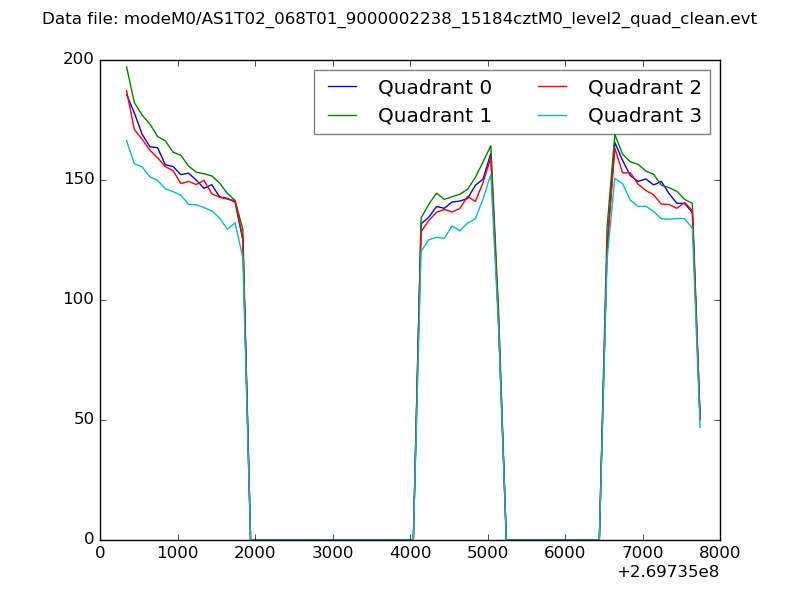 |
|
| Module-wise count rates for Quadrant A Data is divided into 100 sec bins |
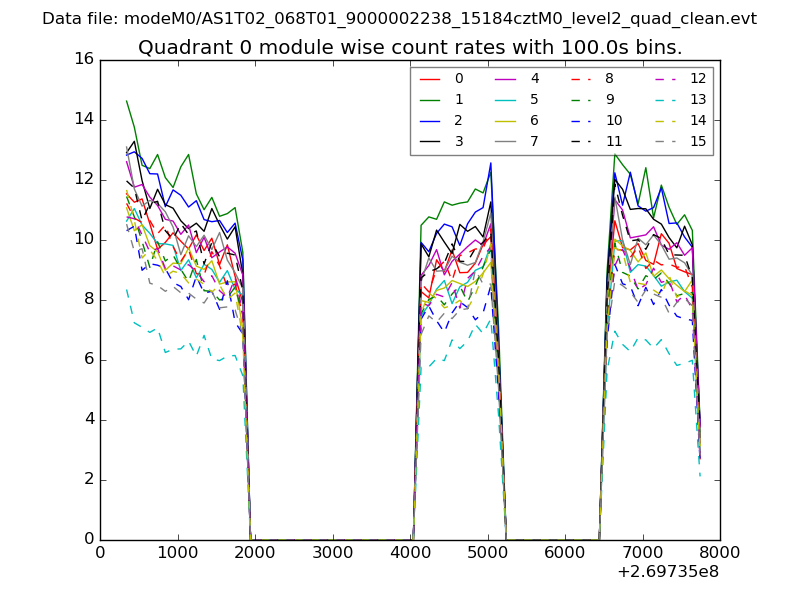 |
 |
| Module-wise count rates for Quadrant B Data is divided into 100 sec bins |
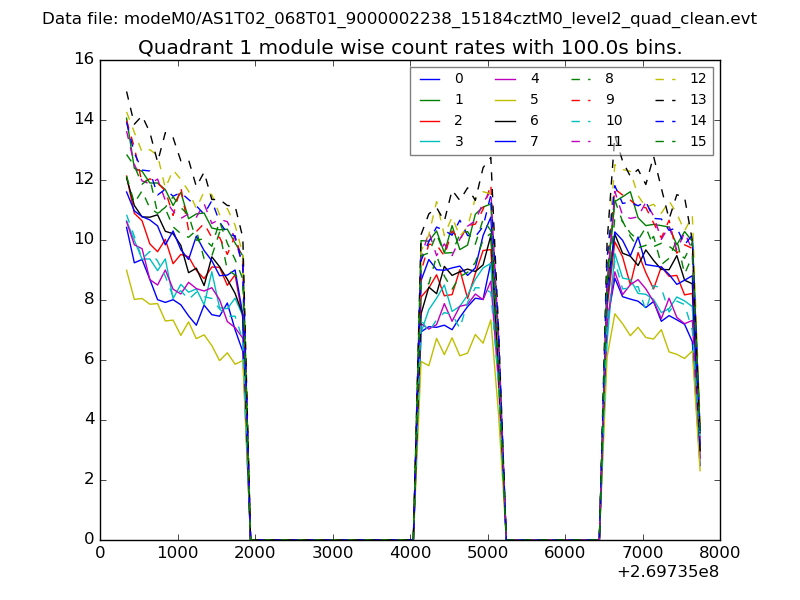 |
 |
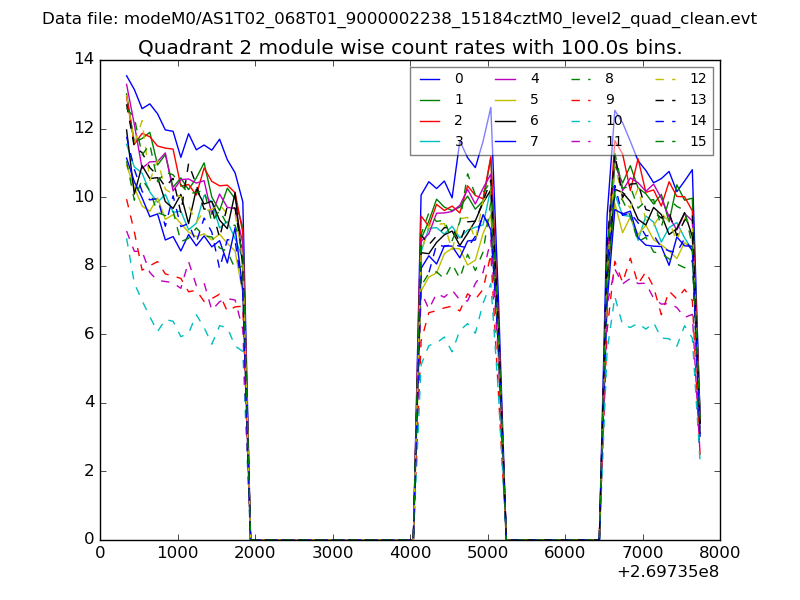
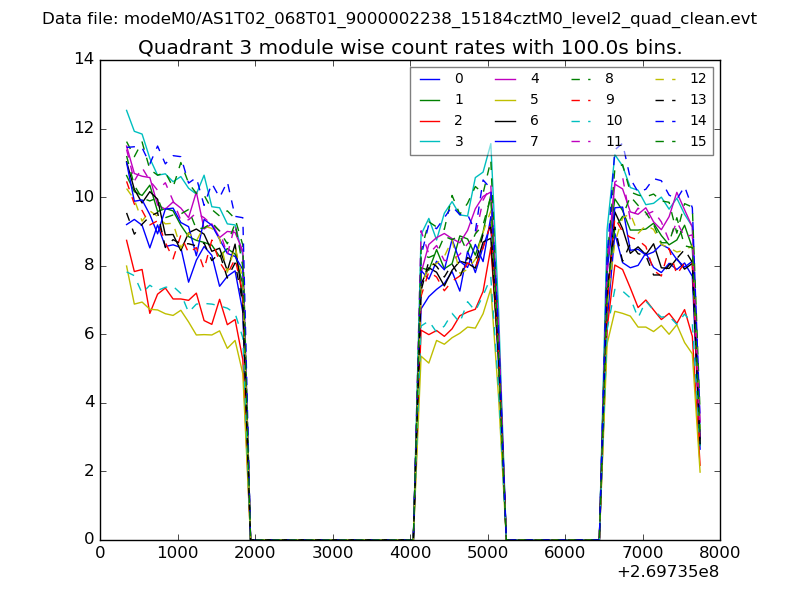
| Module-wise count rates for Quadrant C Data is divided into 100 sec bins |
 |
 |
| Module-wise count rates for Quadrant D Data is divided into 100 sec bins |
 |
 |
| Parameter | Plot |
|---|---|
| CZT HV Monitor | 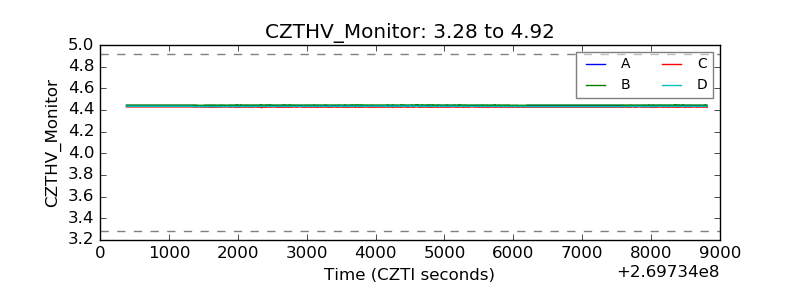 |
| D_VDD | 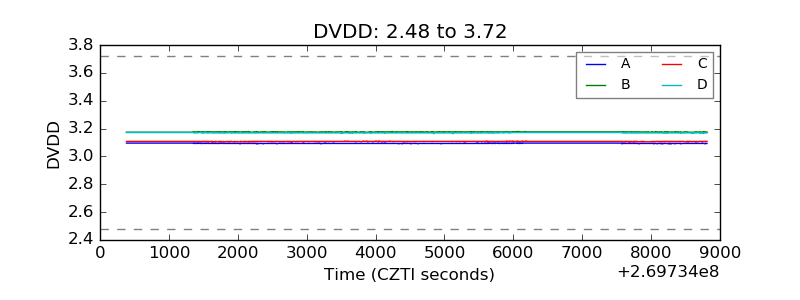 |
| Temperature 1 | 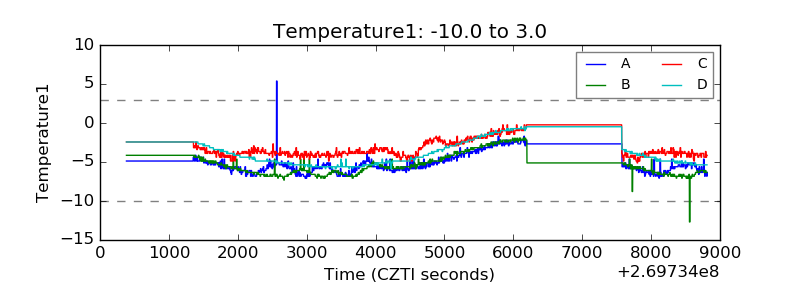 |
| Veto HV Monitor | 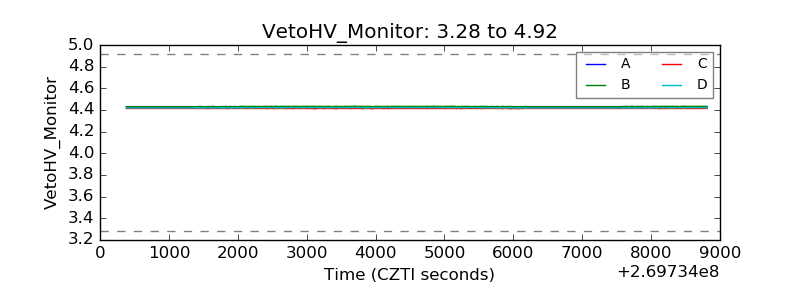 |
| Veto LLD | 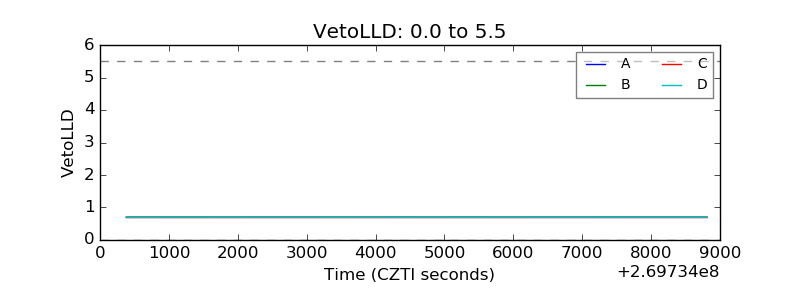 |
| Alpha Counter | 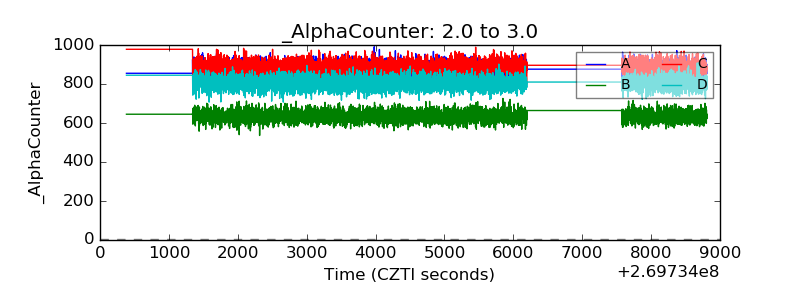 |
| _CPM_Rate | 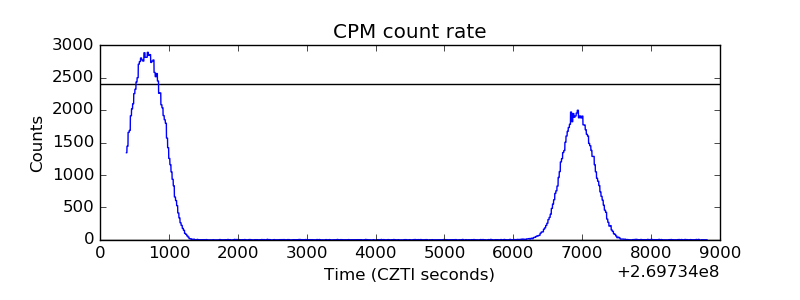 |
| CZT Counter |  |
| +2.5 Volts monitor |  |
| +5 Volts monitor | 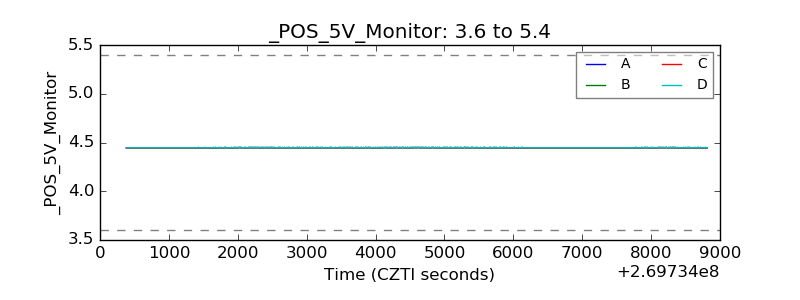 |
| _ROLL_ROT | 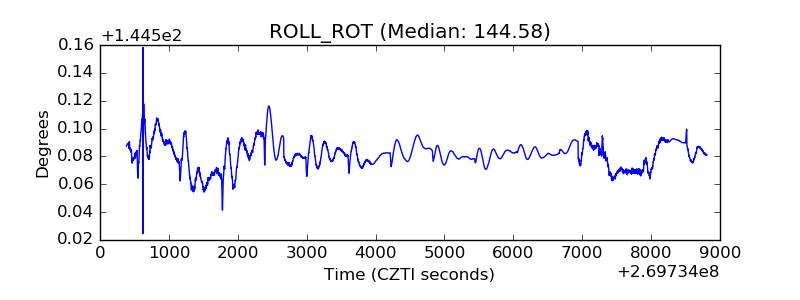 |
| _Roll_DEC | 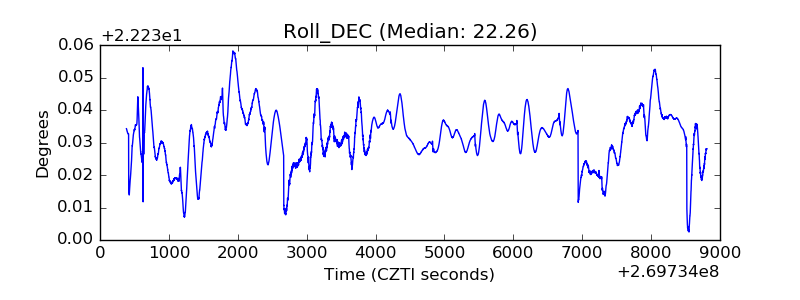 |
| _Roll_RA |  |
| Veto Counter | 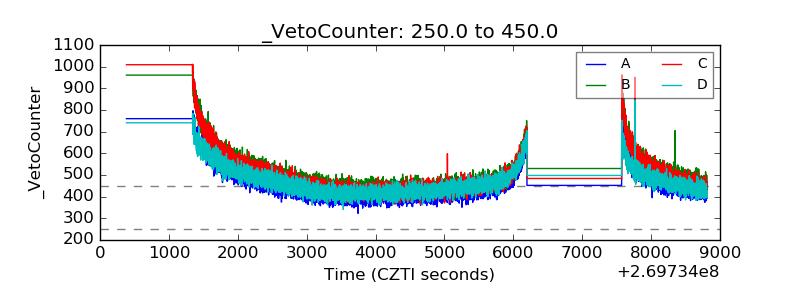 |