| Param | Original file | Final file |
|---|---|---|
| Filename | modeM0/AS1T02_068T01_9000002238_15187cztM0_level2.evt | modeM0/AS1T02_068T01_9000002238_15187cztM0_level2_quad_clean.evt |
| Size (bytes) | 566,133,120 | 95,028,480 |
| Size | 539.9 MB | 90.6 MB |
| Events in quadrant A | 4,040,111 | 587,690 |
| Events in quadrant B | 4,039,124 | 592,310 |
| Events in quadrant C | 4,538,964 | 579,462 |
| Events in quadrant D | 3,984,090 | 561,940 |
| Mode M9 | |||
|---|---|---|---|
| Quadrant | BADHDUFLAG | Total packets | Discarded packets |
| A | 0 | 12 | 0 |
| B | 0 | 12 | 0 |
| C | 0 | 12 | 0 |
| D | 0 | 12 | 0 |
| Mode SS | |||
|---|---|---|---|
| Quadrant | BADHDUFLAG | Total packets | Discarded packets |
| A | 0 | 164 | 0 |
| B | 0 | 164 | 0 |
| C | 0 | 164 | 0 |
| D | 0 | 164 | 0 |
| Mode M0 | |||
|---|---|---|---|
| Quadrant | BADHDUFLAG | Total packets | Discarded packets |
| A | 0 | 17372 | 3 |
| B | 0 | 17013 | 2 |
| C | 0 | 18433 | 2 |
| D | 0 | 17403 | 2 |
| Quadrant | Total seconds | Saturated seconds | Saturation percentage |
|---|---|---|---|
| A | 8004 | 211 | 2.636182% |
| B | 8004 | 243 | 3.035982% |
| C | 8004 | 135 | 1.686657% |
| D | 8004 | 135 | 1.686657% |
Noise dominated data is calculated using 1-second bins in cleaned event files. If a bin has >2000 counts, and if more than 50% of those come from <1% of pixels, then it is considered to be noise-dominated and hence unusable.
| Quadrant | # 1 sec bins | Bins with >0 counts | Bins with >2000 counts | High rate bins dominated by noise | Noise dominated (total time) | Noise dominated (detector-on time) | Marked lightcurve |
|---|---|---|---|---|---|---|---|
| A | 9225 | 8007 | 0 | 0 | 0.00% | 0.00% | 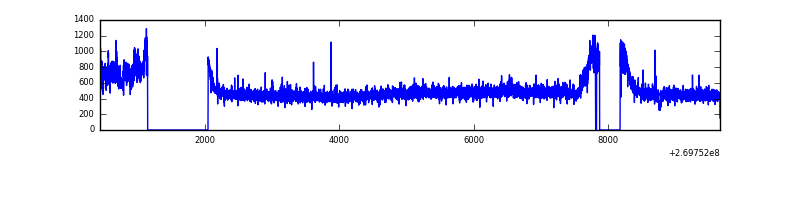 |
| B | 9225 | 8007 | 22 | 22 | 0.24% | 0.27% | 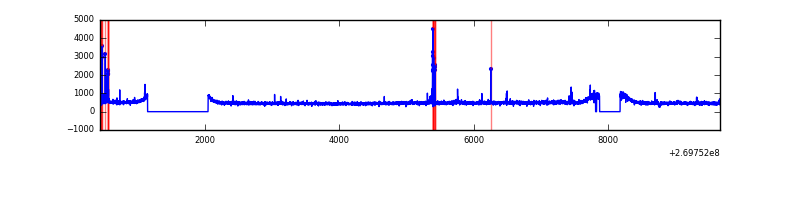 |
| C | 9225 | 8008 | 0 | 0 | 0.00% | 0.00% | 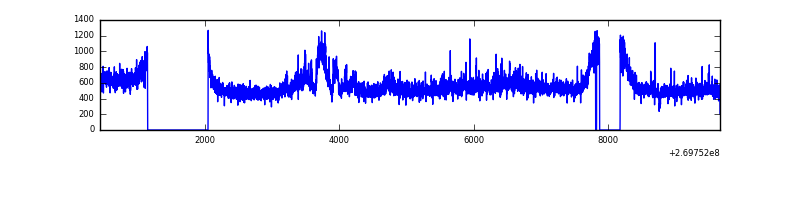 |
| D | 9225 | 8008 | 26 | 26 | 0.28% | 0.32% | 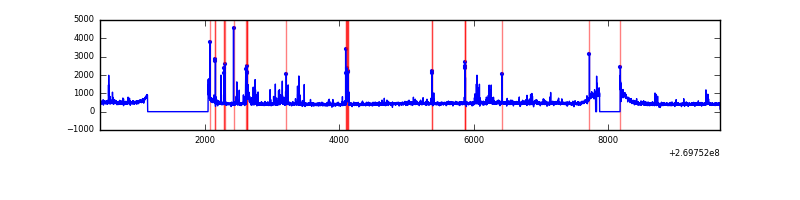 |
Top three noisy pixels from each quadrant. If the there are fewer than three noisy pixels in the level2.evt file, extra rows are filled as -1
| Pixel properties | Quadrant properties | ||||||
|---|---|---|---|---|---|---|---|
| Quadrant | DetID | PixID | Counts | Sigma | Mean | Median | Sigma |
| A | 15 | 239 | 127753 | 627.14 | 996 | 972 | 202.2 |
| A | 12 | 189 | 79417 | 388.04 | 996 | 972 | 202.2 |
| A | 0 | 226 | 8528 | 37.38 | 996 | 972 | 202.2 |
| B | 3 | 64 | 57698 | 292.06 | 997 | 971 | 194.2 |
| B | 4 | 48 | 49428 | 249.49 | 997 | 971 | 194.2 |
| B | 12 | 111 | 23423 | 115.6 | 997 | 971 | 194.2 |
| C | 3 | 233 | 748498 | 3311.93 | 969 | 974 | 225.7 |
| C | 0 | 207 | 10238 | 41.04 | 969 | 974 | 225.7 |
| C | 13 | 61 | 6915 | 26.32 | 969 | 974 | 225.7 |
| D | 10 | 70 | 102281 | 431.54 | 965 | 939 | 234.8 |
| D | 2 | 33 | 94147 | 396.91 | 965 | 939 | 234.8 |
| D | 13 | 249 | 44142 | 183.97 | 965 | 939 | 234.8 |
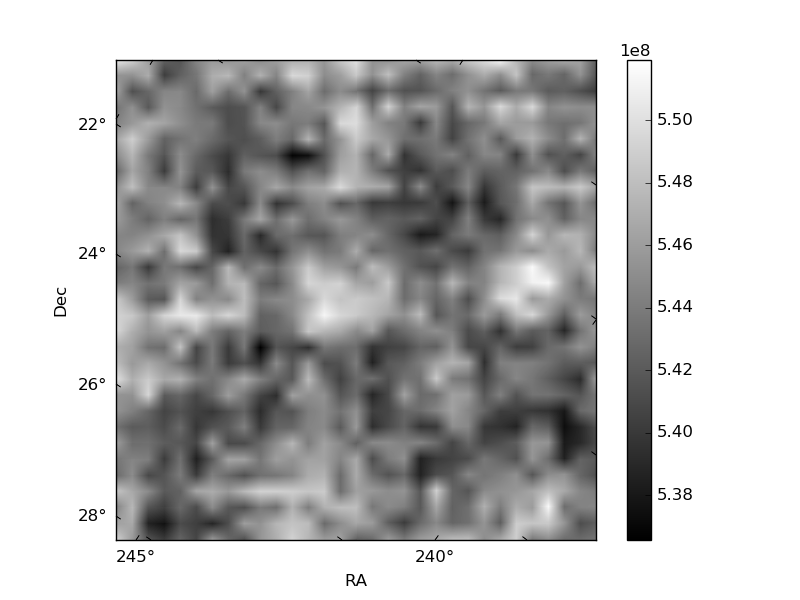
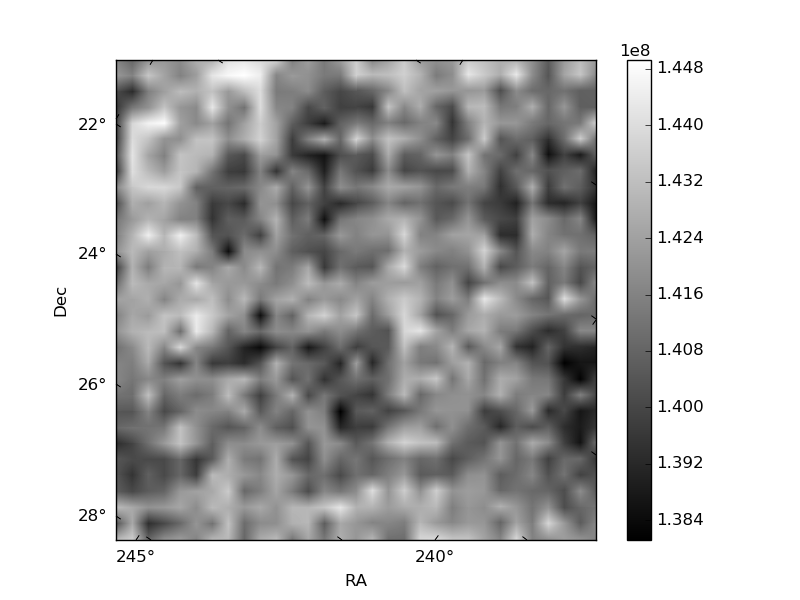
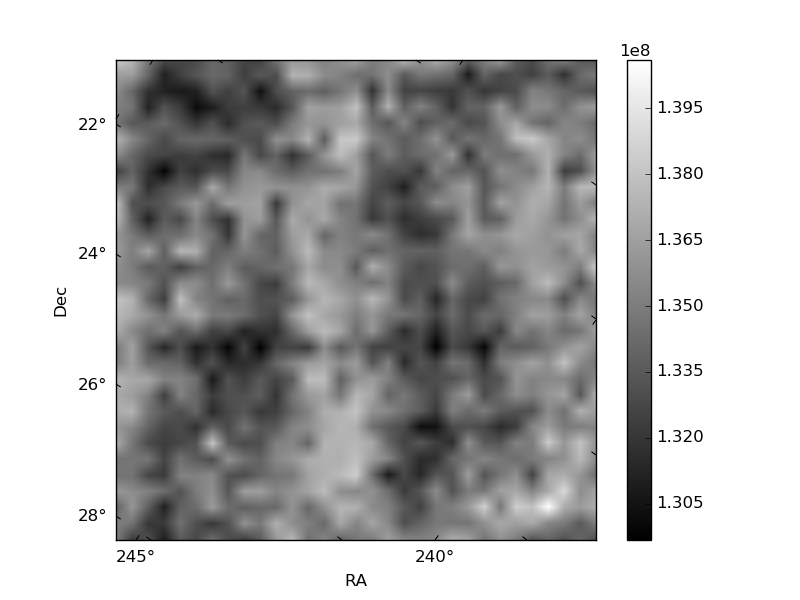
Histogram calculated using DETX and DETY for each event in the final _common_clean file
| Quadrant A | 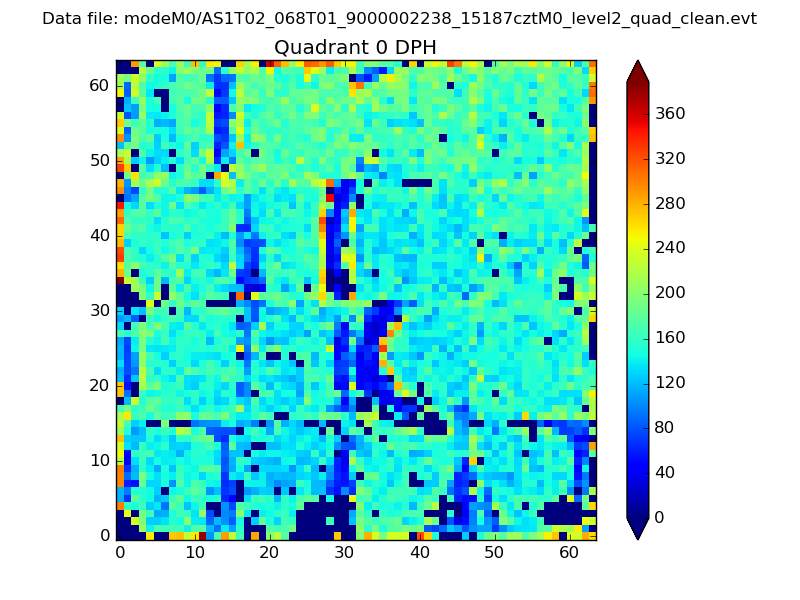 |
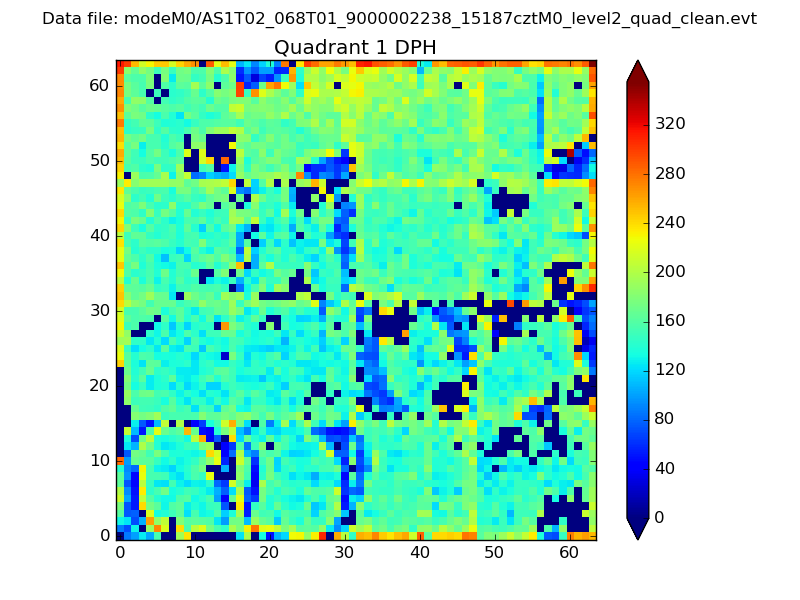 |
Quadrant B |
|---|---|---|---|
| Quadrant D | 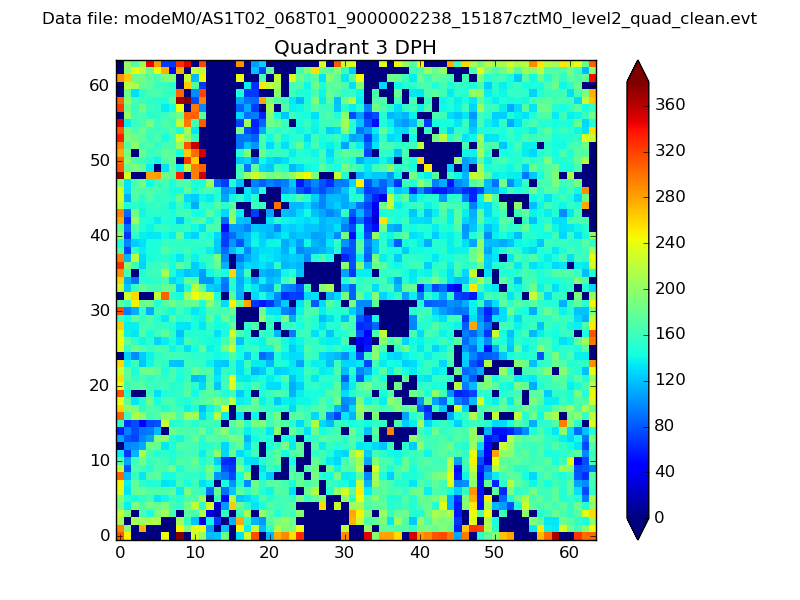 |
 |
Quadrant C |
| Plot type | Count rate plots | Images |
|---|---|---|
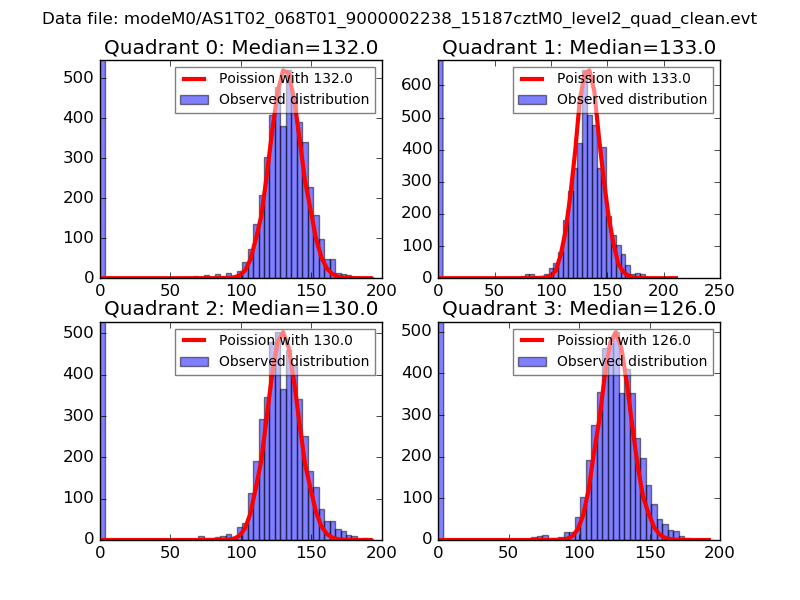
| Comparison with Poisson distribution Blue bars denote a histogram of data divided into 1 sec bins. Red curve is a Poisson curve with rate = median count rate of data. |
 |
 |
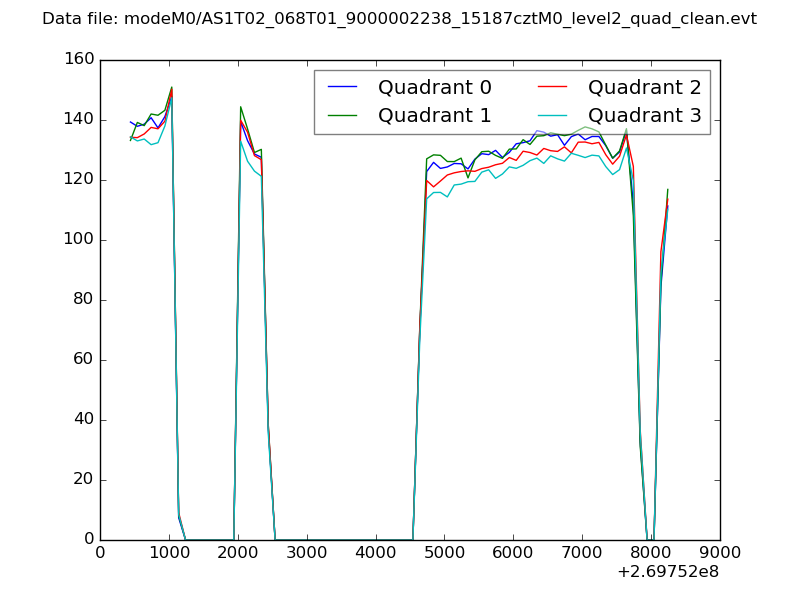
| Quadrant-wise count rates Data is divided into 100 sec bins |
 |
|
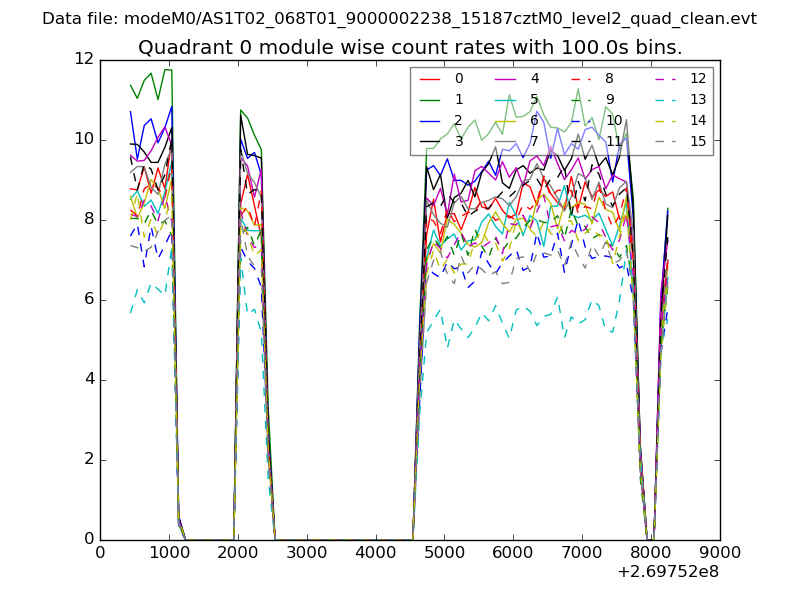
| Module-wise count rates for Quadrant A Data is divided into 100 sec bins |
 |
 |
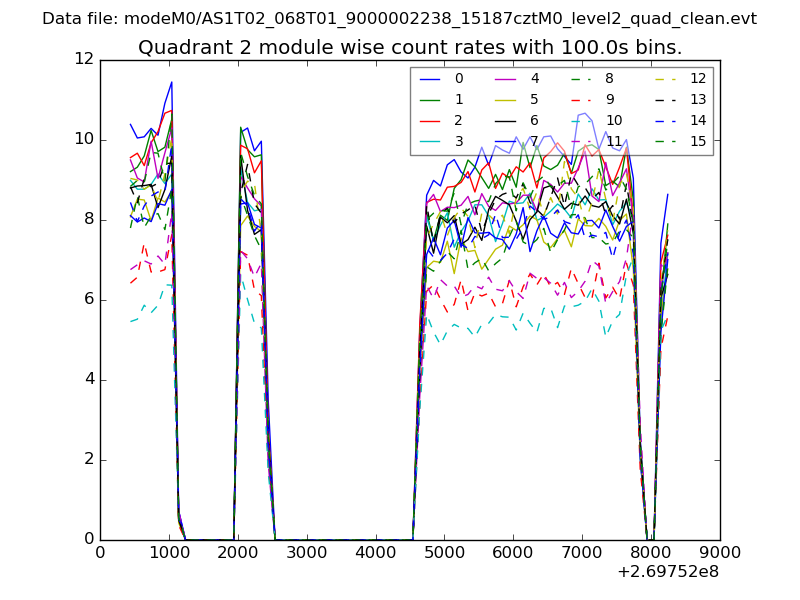
| Module-wise count rates for Quadrant B Data is divided into 100 sec bins |
 |
 |
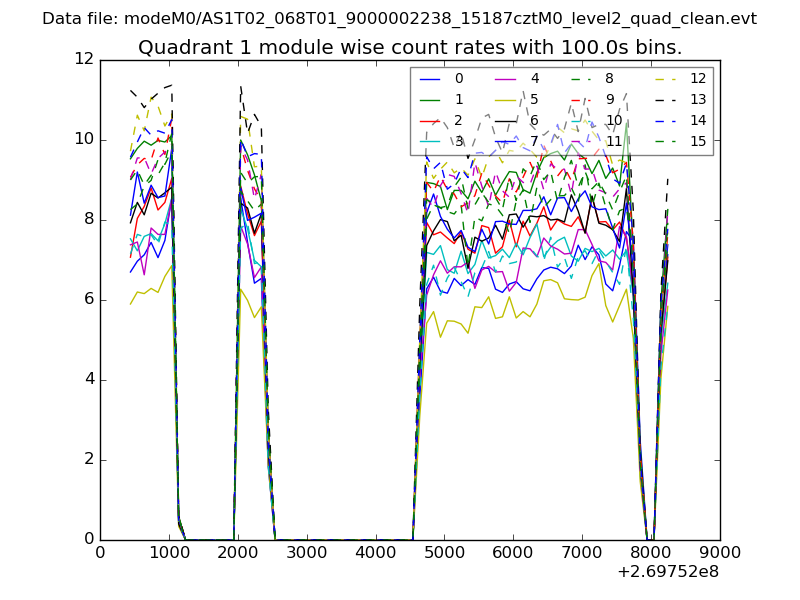
| Module-wise count rates for Quadrant C Data is divided into 100 sec bins |
 |
 |
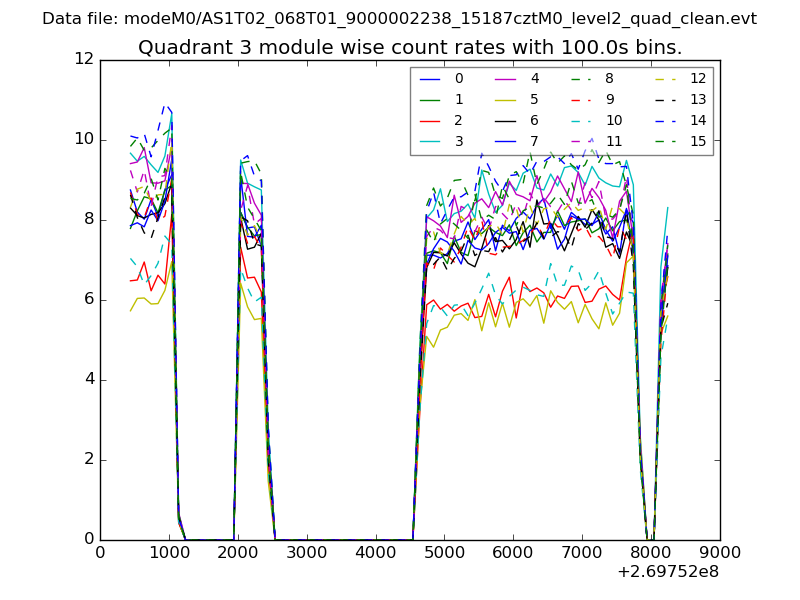
| Module-wise count rates for Quadrant D Data is divided into 100 sec bins |
 |
 |
| Parameter | Plot |
|---|---|
| CZT HV Monitor | 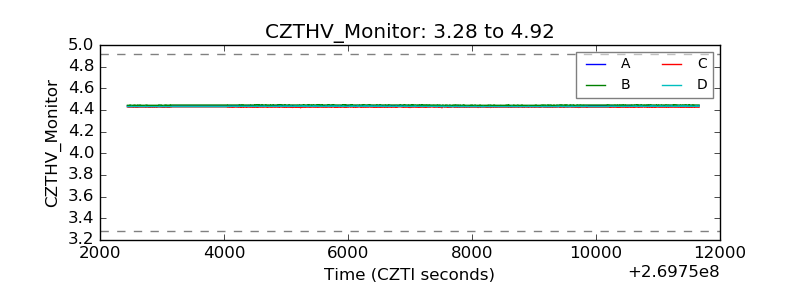 |
| D_VDD | 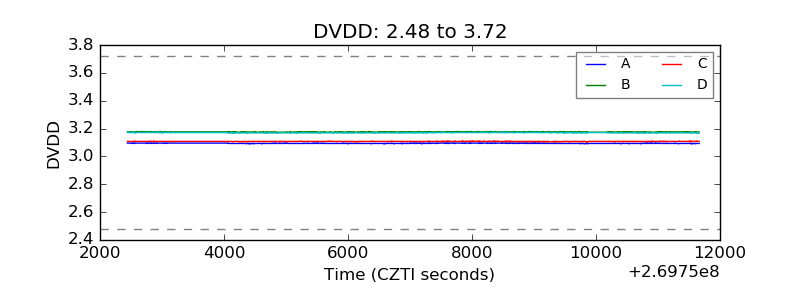 |
| Temperature 1 | 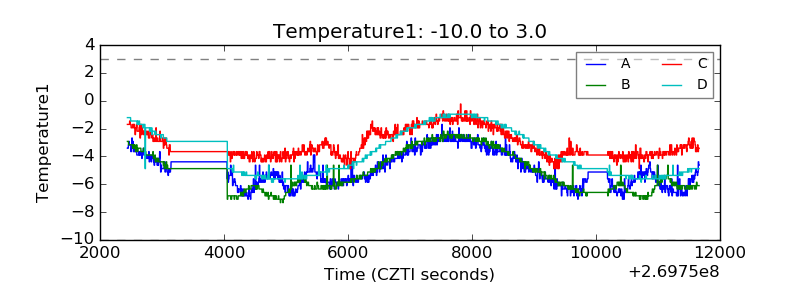 |
| Veto HV Monitor | 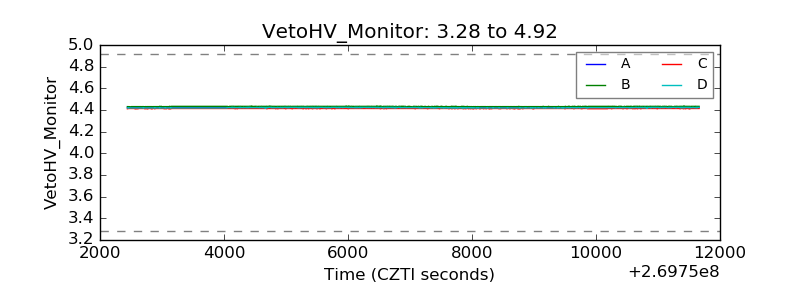 |
| Veto LLD | 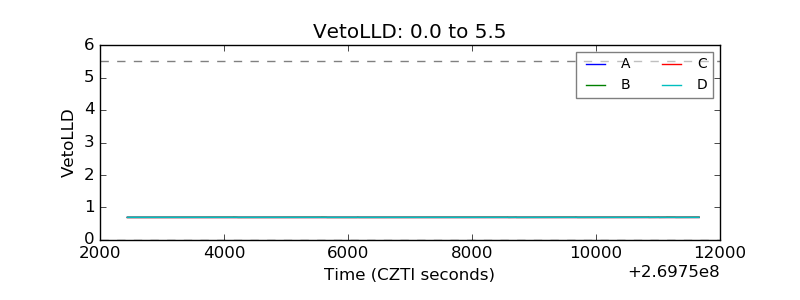 |
| Alpha Counter | 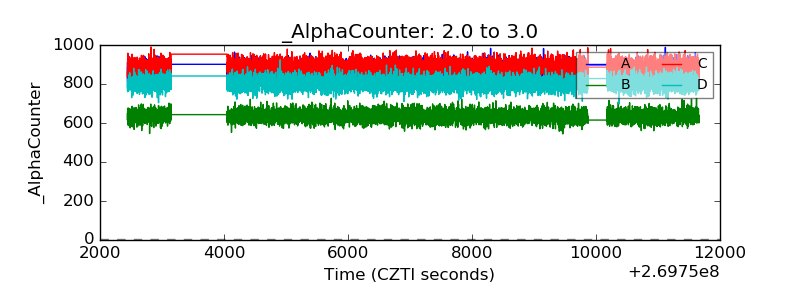 |
| _CPM_Rate | 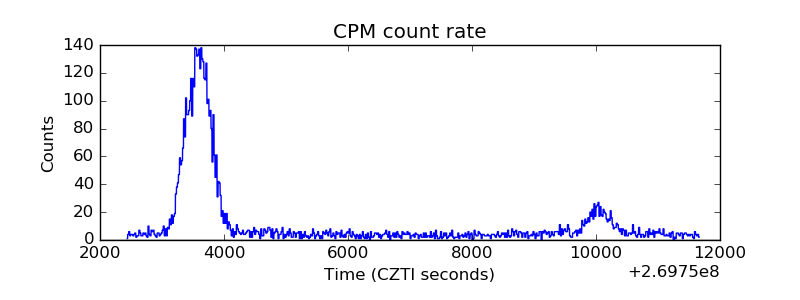 |
| CZT Counter | 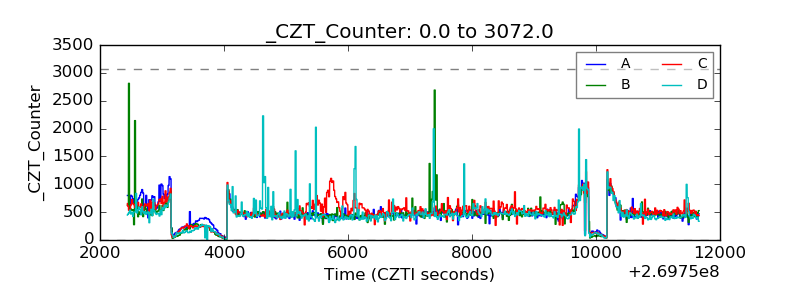 |
| +2.5 Volts monitor |  |
| +5 Volts monitor | 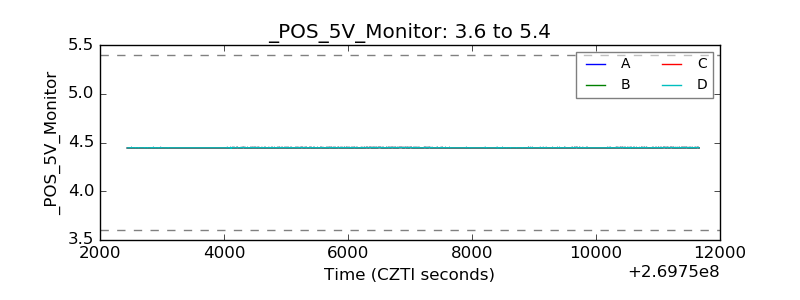 |
| _ROLL_ROT | 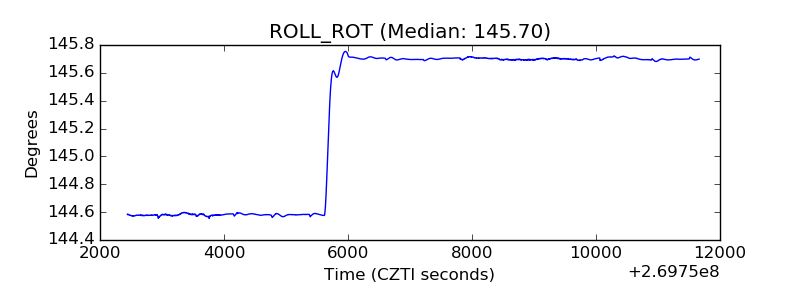 |
| _Roll_DEC | 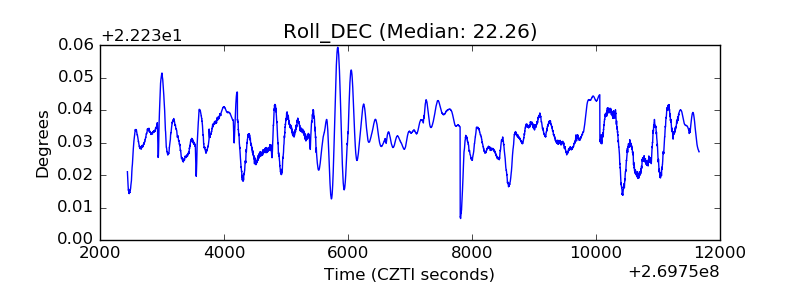 |
| _Roll_RA | 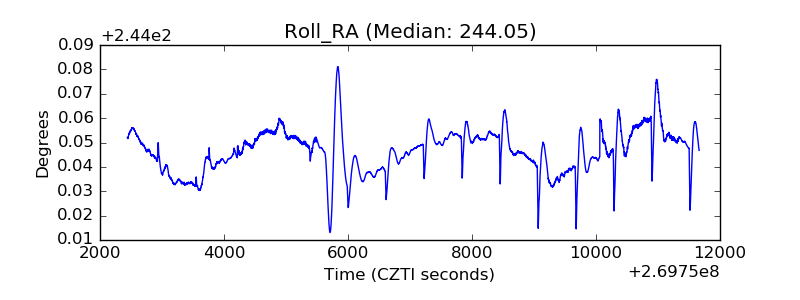 |
| Veto Counter | 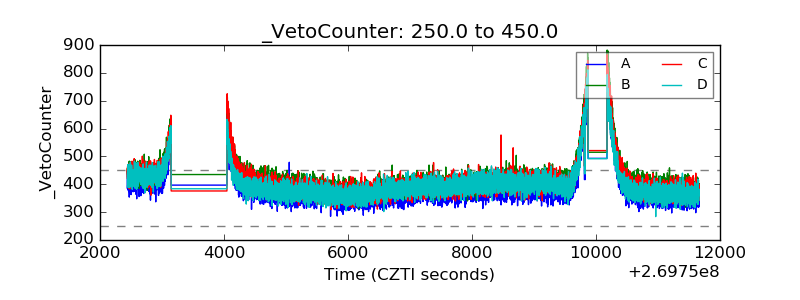 |