| Param | Original file | Final file |
|---|---|---|
| Filename | modeM0/AS1T02_068T01_9000002238_15193cztM0_level2.evt | modeM0/AS1T02_068T01_9000002238_15193cztM0_level2_quad_clean.evt |
| Size (bytes) | 510,727,680 | 89,144,640 |
| Size | 487.1 MB | 85.0 MB |
| Events in quadrant A | 2,982,176 | 596,784 |
| Events in quadrant B | 5,742,623 | 516,489 |
| Events in quadrant C | 3,344,146 | 582,512 |
| Events in quadrant D | 2,975,464 | 568,341 |
| Mode M9 | |||
|---|---|---|---|
| Quadrant | BADHDUFLAG | Total packets | Discarded packets |
| A | 0 | 10 | 0 |
| B | 0 | 10 | 0 |
| C | 0 | 10 | 0 |
| D | 0 | 10 | 0 |
| Mode SS | |||
|---|---|---|---|
| Quadrant | BADHDUFLAG | Total packets | Discarded packets |
| A | 0 | 126 | 0 |
| B | 0 | 126 | 0 |
| C | 0 | 126 | 0 |
| D | 0 | 126 | 0 |
| Mode M0 | |||
|---|---|---|---|
| Quadrant | BADHDUFLAG | Total packets | Discarded packets |
| A | 0 | 12978 | 2 |
| B | 0 | 21179 | 1 |
| C | 0 | 13866 | 1 |
| D | 0 | 13212 | 1 |
| Quadrant | Total seconds | Saturated seconds | Saturation percentage |
|---|---|---|---|
| A | 6233 | 44 | 0.705920% |
| B | 6233 | 1108 | 17.776352% |
| C | 6233 | 33 | 0.529440% |
| D | 6233 | 61 | 0.978662% |
Noise dominated data is calculated using 1-second bins in cleaned event files. If a bin has >2000 counts, and if more than 50% of those come from <1% of pixels, then it is considered to be noise-dominated and hence unusable.
| Quadrant | # 1 sec bins | Bins with >0 counts | Bins with >2000 counts | High rate bins dominated by noise | Noise dominated (total time) | Noise dominated (detector-on time) | Marked lightcurve |
|---|---|---|---|---|---|---|---|
| A | 7249 | 6234 | 0 | 0 | 0.00% | 0.00% | 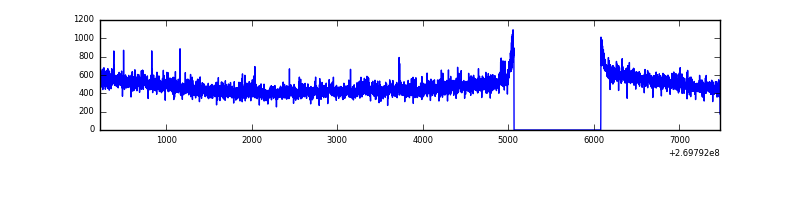 |
| B | 7249 | 6235 | 820 | 820 | 11.31% | 13.15% | 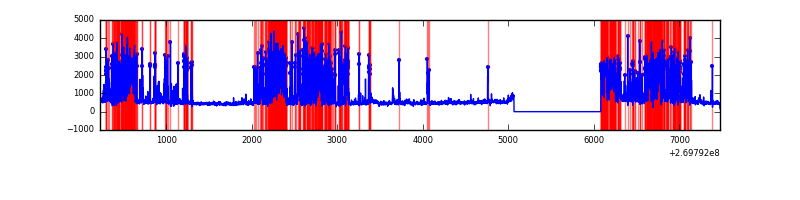 |
| C | 7249 | 6235 | 0 | 0 | 0.00% | 0.00% | 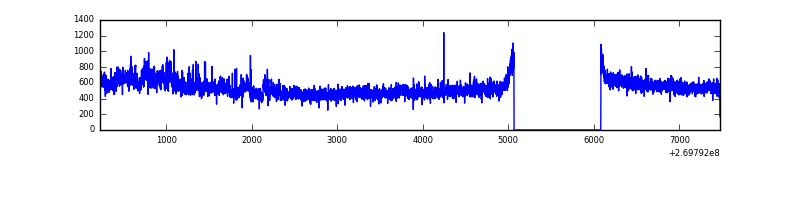 |
| D | 7249 | 6235 | 20 | 20 | 0.28% | 0.32% | 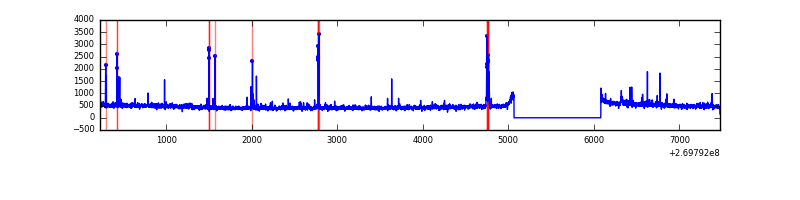 |
Top three noisy pixels from each quadrant. If the there are fewer than three noisy pixels in the level2.evt file, extra rows are filled as -1
| Pixel properties | Quadrant properties | ||||||
|---|---|---|---|---|---|---|---|
| Quadrant | DetID | PixID | Counts | Sigma | Mean | Median | Sigma |
| A | 12 | 189 | 68064 | 440.4 | 757 | 741 | 152.9 |
| A | 0 | 226 | 6883 | 40.18 | 757 | 741 | 152.9 |
| A | 12 | 194 | 5610 | 31.85 | 757 | 741 | 152.9 |
| B | 3 | 112 | 2924096 | 22098.38 | 689 | 672 | 132.3 |
| B | 4 | 48 | 44878 | 334.16 | 689 | 672 | 132.3 |
| B | 3 | 64 | 18102 | 131.75 | 689 | 672 | 132.3 |
| C | 3 | 233 | 472597 | 2741.82 | 736 | 739 | 172.1 |
| C | 13 | 61 | 5293 | 26.46 | 736 | 739 | 172.1 |
| C | 7 | 247 | 2786 | 11.89 | 736 | 739 | 172.1 |
| D | 10 | 70 | 57115 | 315.05 | 737 | 716 | 179.0 |
| D | 13 | 172 | 27490 | 149.56 | 737 | 716 | 179.0 |
| D | 2 | 120 | 26480 | 143.92 | 737 | 716 | 179.0 |
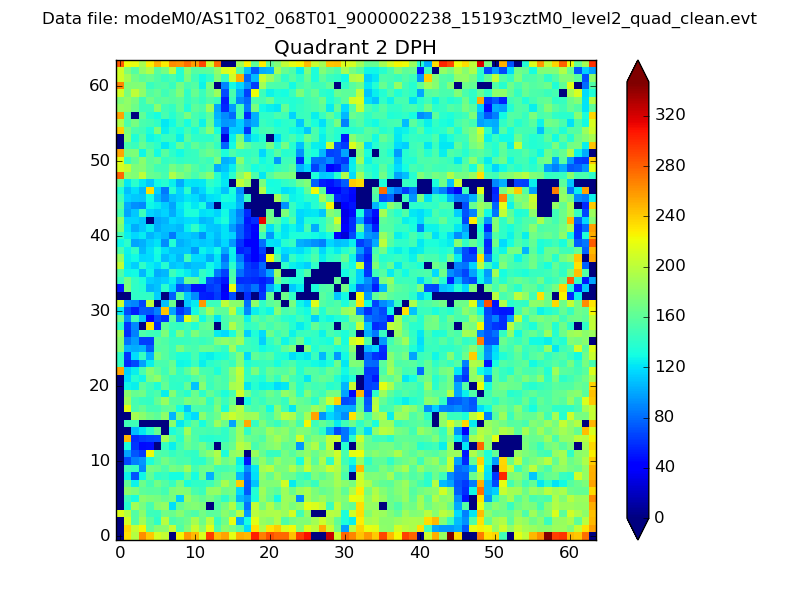
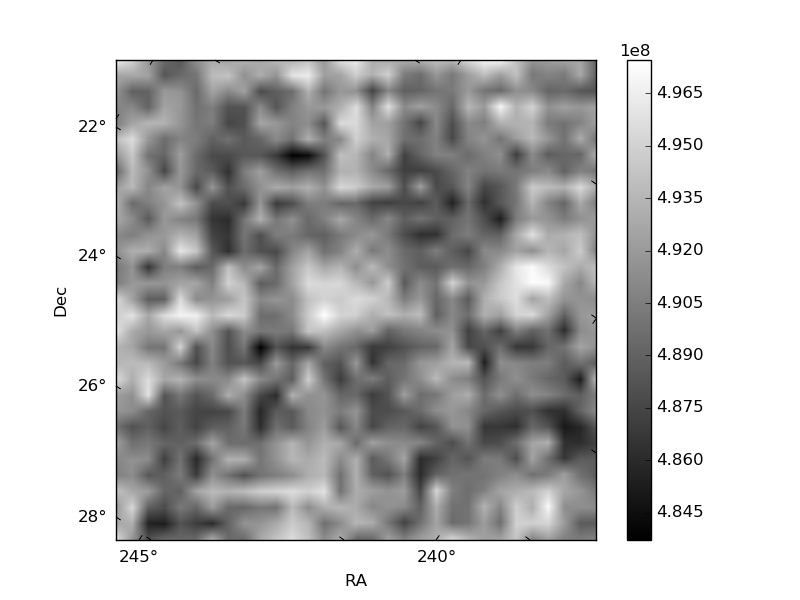
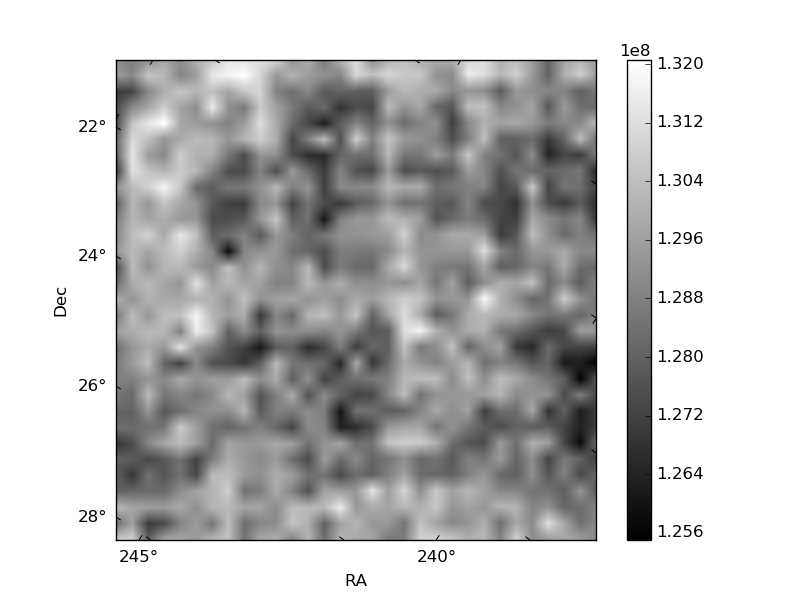
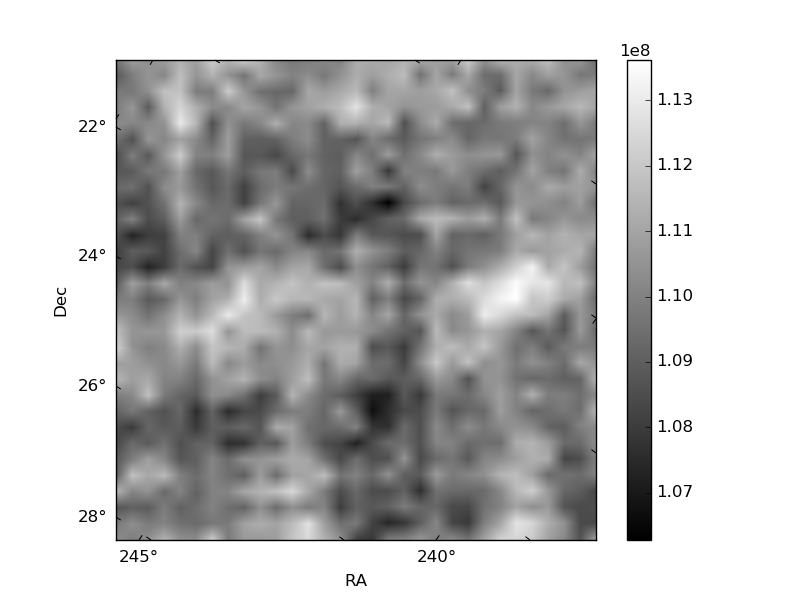
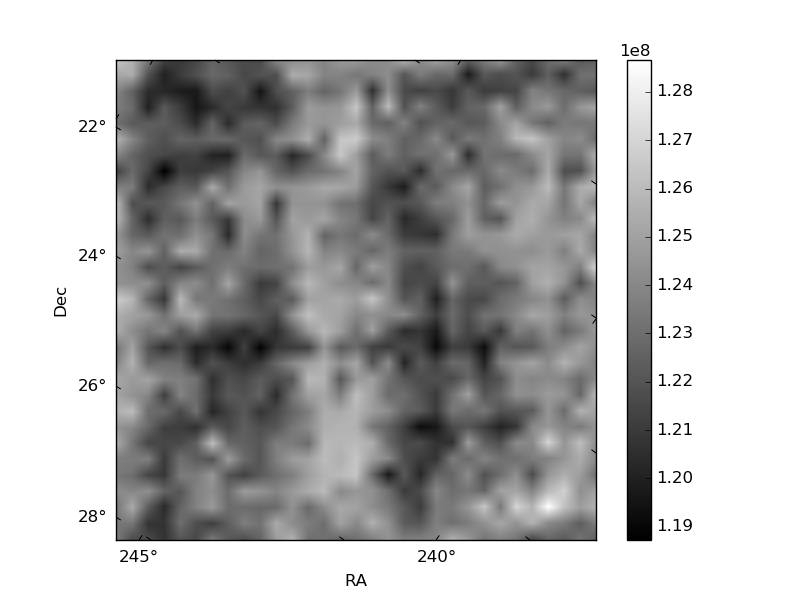
Histogram calculated using DETX and DETY for each event in the final _common_clean file
| Quadrant A | 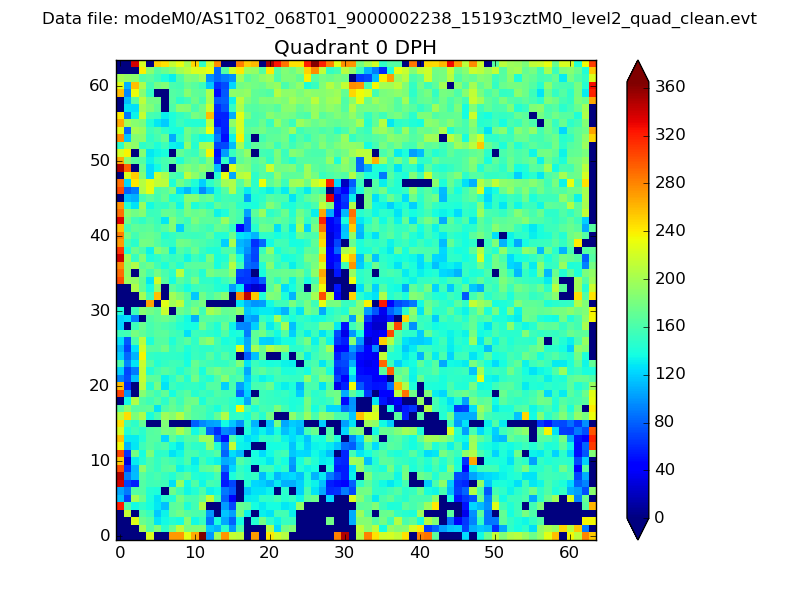 |
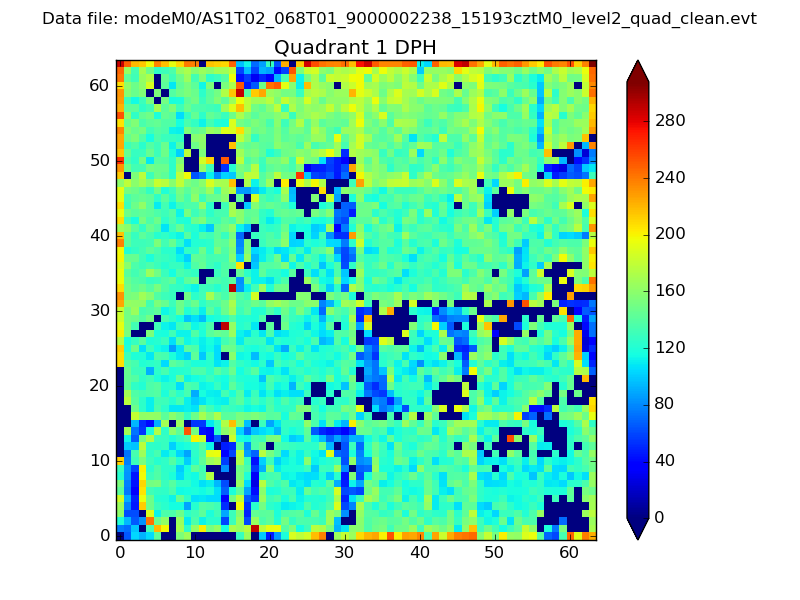 |
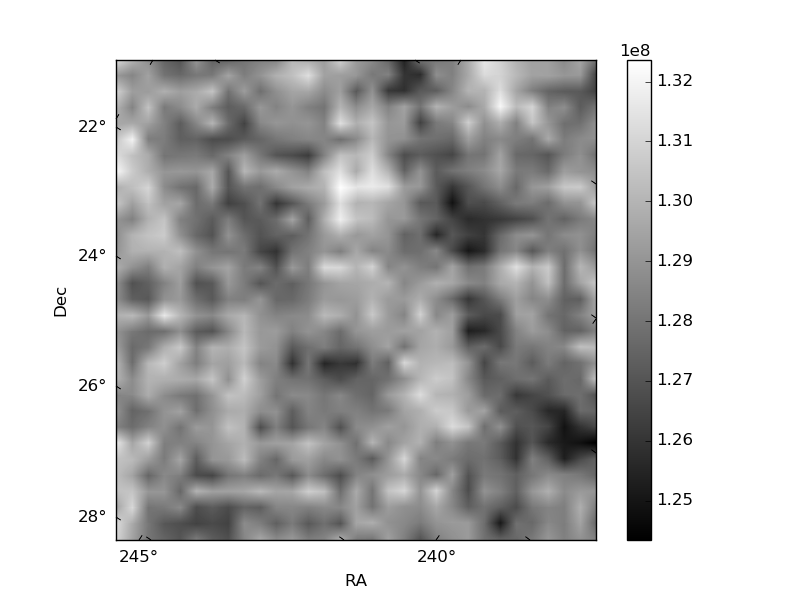
Quadrant B |
|---|---|---|---|
| Quadrant D | 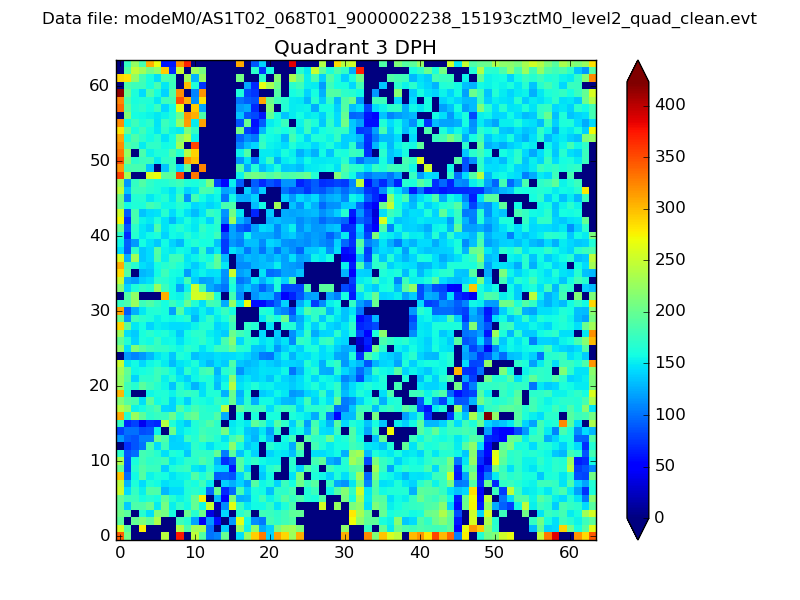 |
 |
Quadrant C |
| Plot type | Count rate plots | Images |
|---|---|---|
| Comparison with Poisson distribution Blue bars denote a histogram of data divided into 1 sec bins. Red curve is a Poisson curve with rate = median count rate of data. |
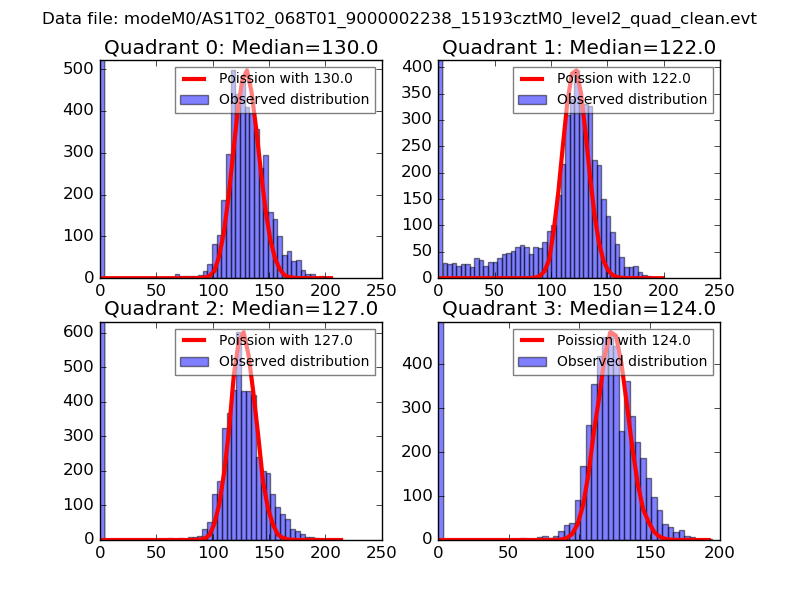 |
 |
| Quadrant-wise count rates Data is divided into 100 sec bins |
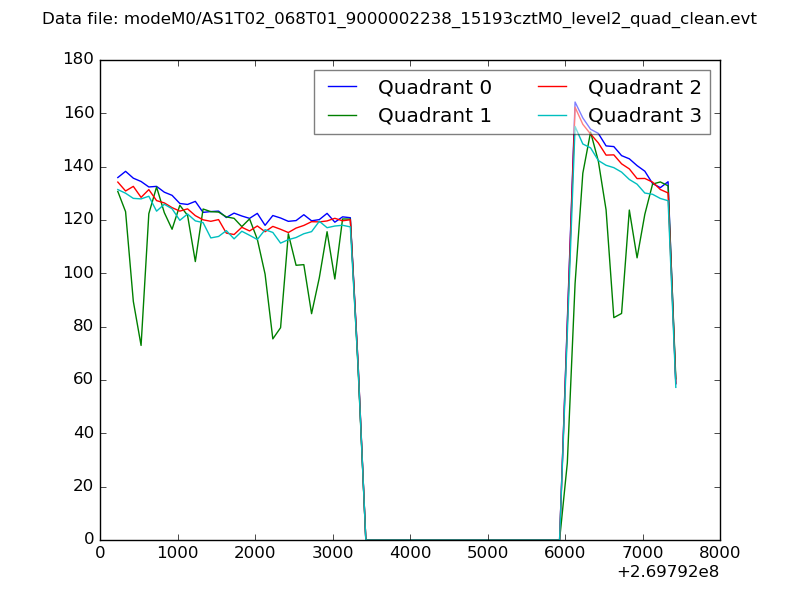 |
|
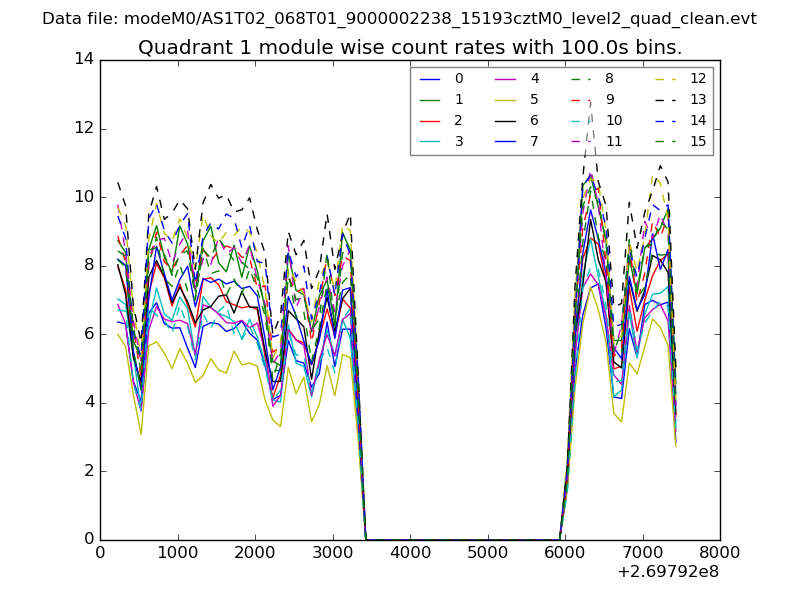
| Module-wise count rates for Quadrant A Data is divided into 100 sec bins |
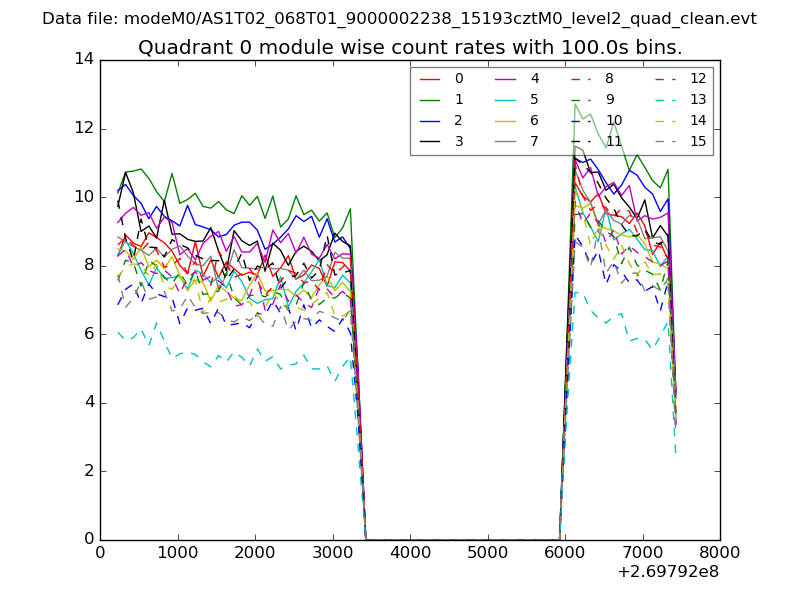 |
 |
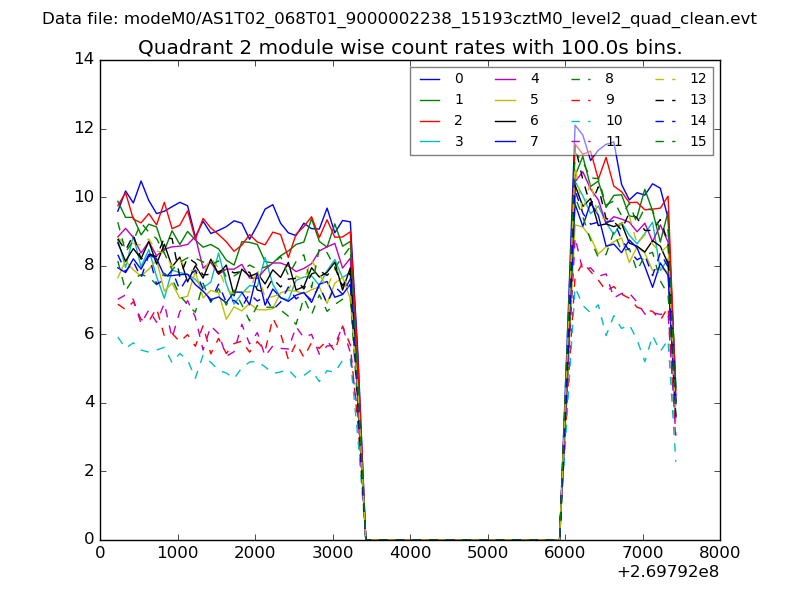
| Module-wise count rates for Quadrant B Data is divided into 100 sec bins |
 |
 |
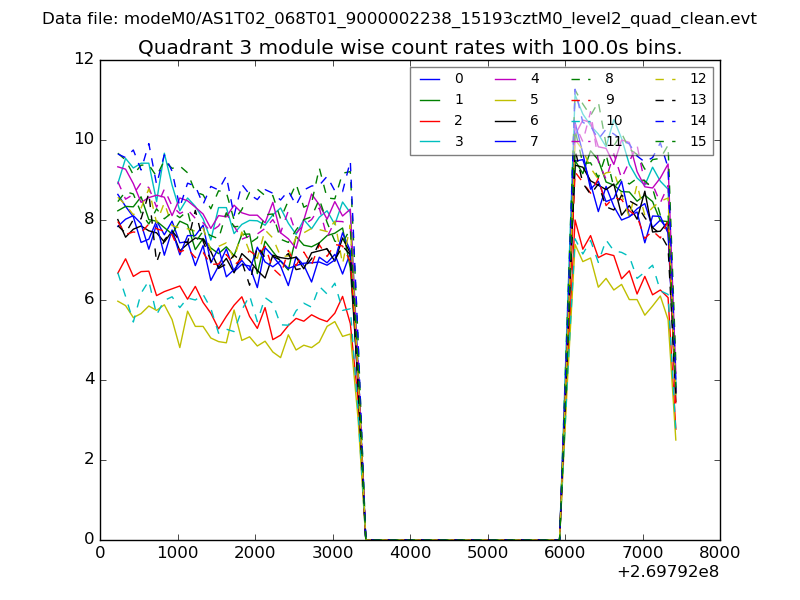
| Module-wise count rates for Quadrant C Data is divided into 100 sec bins |
 |
 |
| Module-wise count rates for Quadrant D Data is divided into 100 sec bins |
 |
 |
| Parameter | Plot |
|---|---|
| CZT HV Monitor | 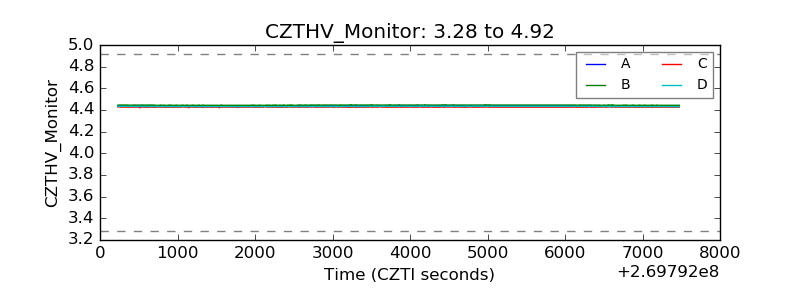 |
| D_VDD | 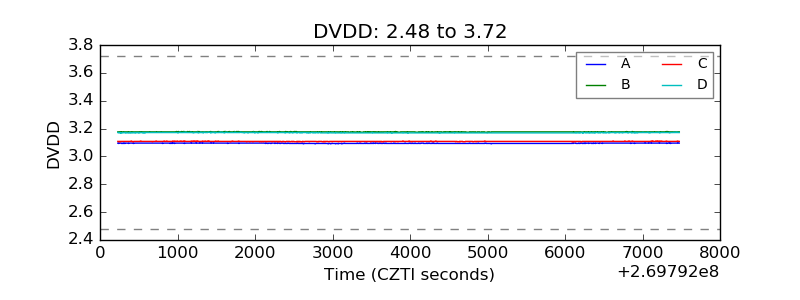 |
| Temperature 1 | 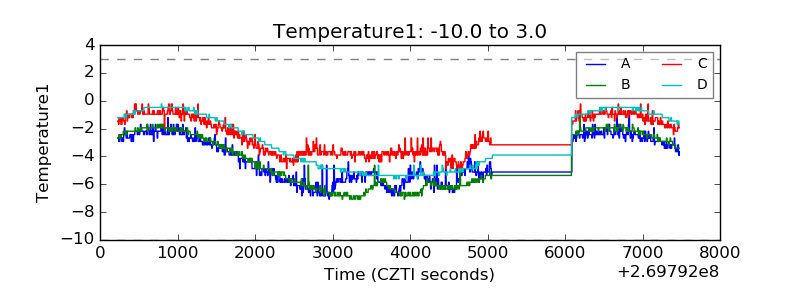 |
| Veto HV Monitor | 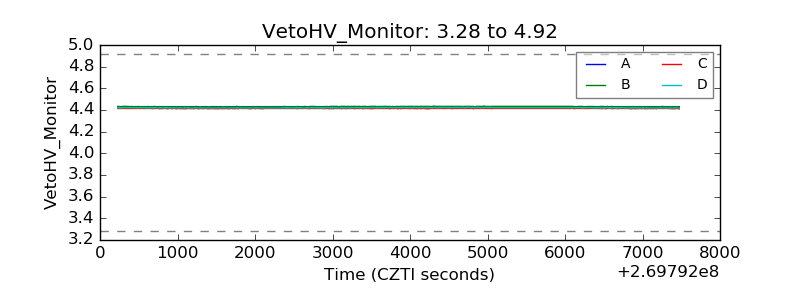 |
| Veto LLD | 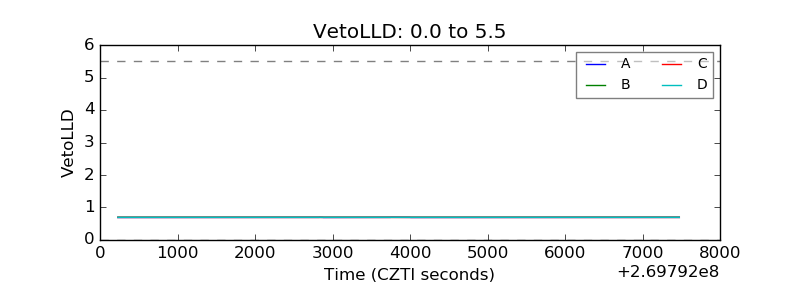 |
| Alpha Counter | 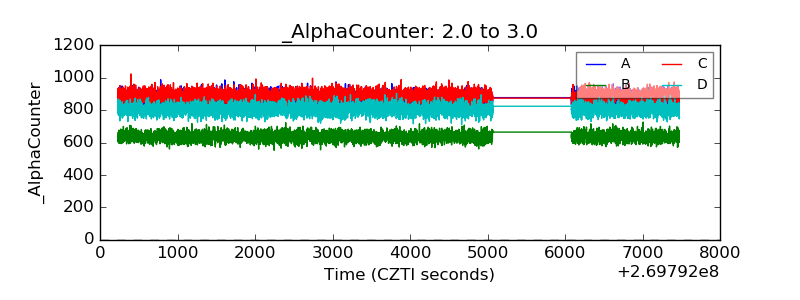 |
| _CPM_Rate | 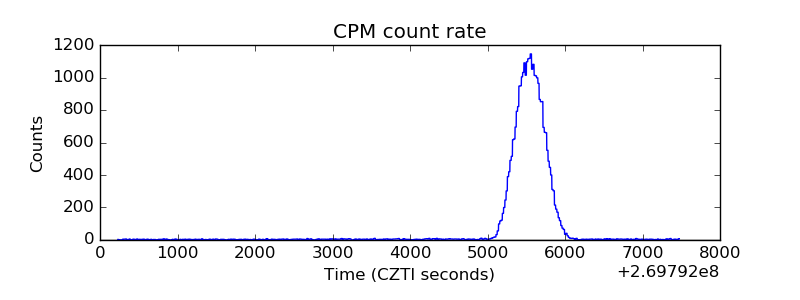 |
| CZT Counter | 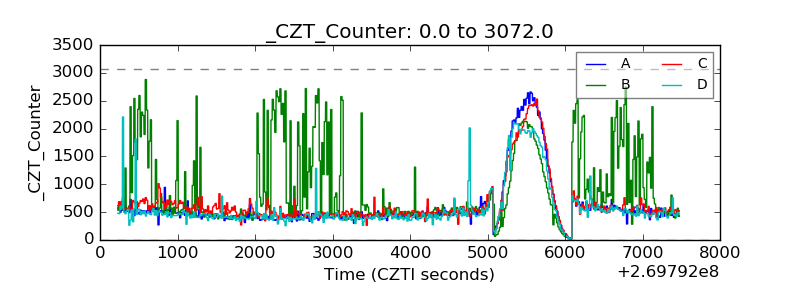 |
| +2.5 Volts monitor | 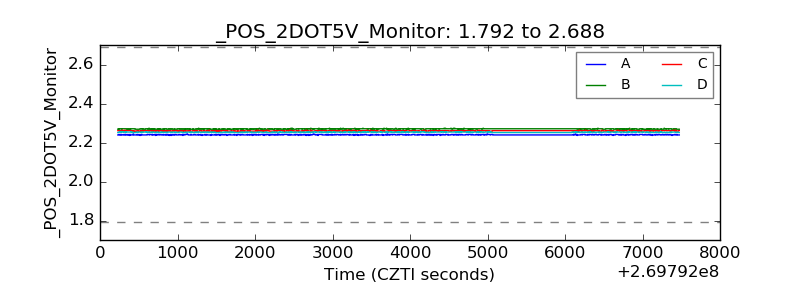 |
| +5 Volts monitor |  |
| _ROLL_ROT | 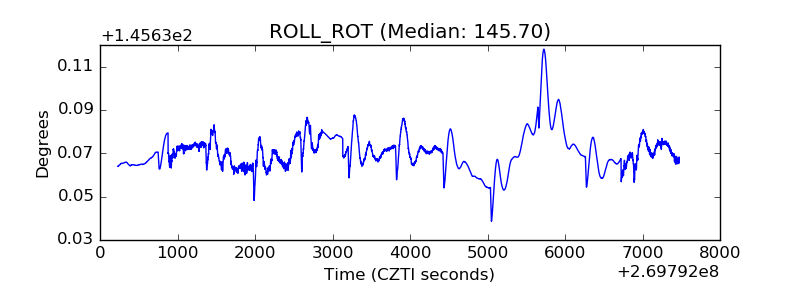 |
| _Roll_DEC | 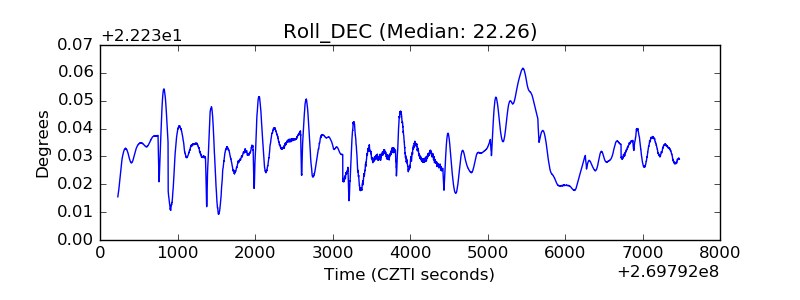 |
| _Roll_RA | 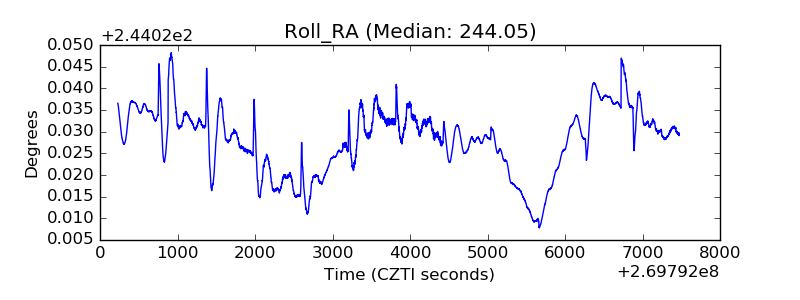 |
| Veto Counter | 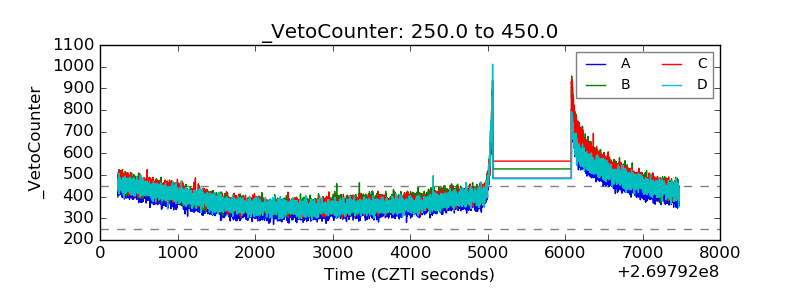 |