| Param | Original file | Final file |
|---|---|---|
| Filename | modeM0/AS1T02_068T01_9000002238_15194cztM0_level2.evt | modeM0/AS1T02_068T01_9000002238_15194cztM0_level2_quad_clean.evt |
| Size (bytes) | 261,561,600 | 52,378,560 |
| Size | 249.4 MB | 50.0 MB |
| Events in quadrant A | 1,323,436 | 372,256 |
| Events in quadrant B | 3,661,894 | 297,722 |
| Events in quadrant C | 1,402,861 | 364,403 |
| Events in quadrant D | 1,343,972 | 353,976 |
| Mode M9 | |||
|---|---|---|---|
| Quadrant | BADHDUFLAG | Total packets | Discarded packets |
| A | 0 | 2 | 0 |
| B | 0 | 2 | 0 |
| C | 0 | 2 | 0 |
| D | 0 | 3 | 0 |
| Mode SS | |||
|---|---|---|---|
| Quadrant | BADHDUFLAG | Total packets | Discarded packets |
| A | 0 | 56 | 0 |
| B | 0 | 56 | 0 |
| C | 0 | 56 | 0 |
| D | 0 | 56 | 0 |
| Mode M0 | |||
|---|---|---|---|
| Quadrant | BADHDUFLAG | Total packets | Discarded packets |
| A | 0 | 5814 | 1 |
| B | 0 | 12752 | 1 |
| C | 0 | 5956 | 1 |
| D | 0 | 5935 | 1 |
| Quadrant | Total seconds | Saturated seconds | Saturation percentage |
|---|---|---|---|
| A | 2754 | 4 | 0.145243% |
| B | 2754 | 954 | 34.640523% |
| C | 2754 | 4 | 0.145243% |
| D | 2754 | 11 | 0.399419% |
Noise dominated data is calculated using 1-second bins in cleaned event files. If a bin has >2000 counts, and if more than 50% of those come from <1% of pixels, then it is considered to be noise-dominated and hence unusable.
| Quadrant | # 1 sec bins | Bins with >0 counts | Bins with >2000 counts | High rate bins dominated by noise | Noise dominated (total time) | Noise dominated (detector-on time) | Marked lightcurve |
|---|---|---|---|---|---|---|---|
| A | 2755 | 2755 | 0 | 0 | 0.00% | 0.00% | 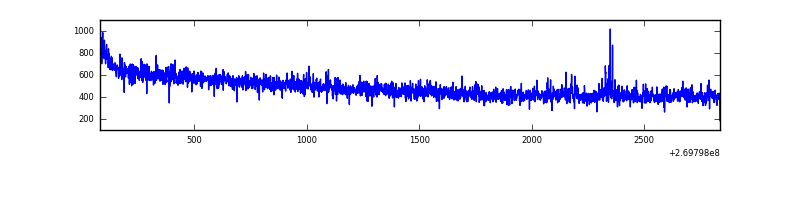 |
| B | 2755 | 2755 | 738 | 738 | 26.79% | 26.79% | 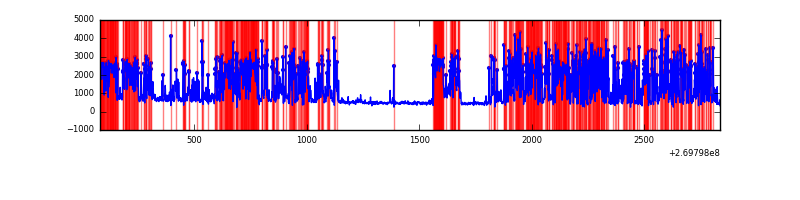 |
| C | 2755 | 2755 | 0 | 0 | 0.00% | 0.00% | 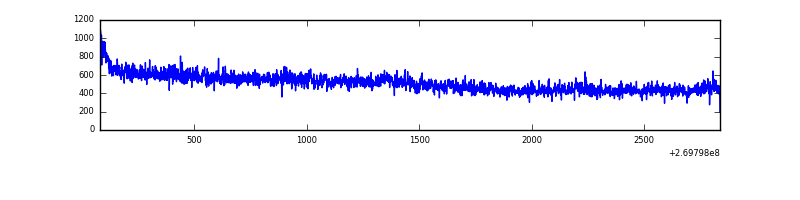 |
| D | 2755 | 2755 | 9 | 9 | 0.33% | 0.33% | 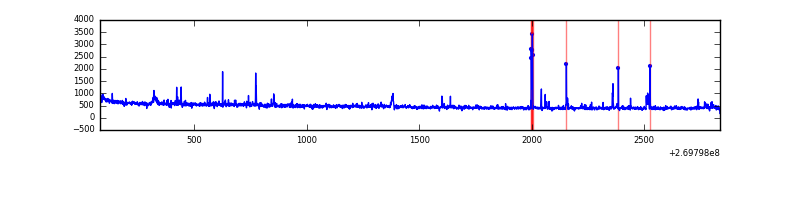 |
Top three noisy pixels from each quadrant. If the there are fewer than three noisy pixels in the level2.evt file, extra rows are filled as -1
| Pixel properties | Quadrant properties | ||||||
|---|---|---|---|---|---|---|---|
| Quadrant | DetID | PixID | Counts | Sigma | Mean | Median | Sigma |
| A | 12 | 189 | 17447 | 248.09 | 338 | 331 | 69.0 |
| A | 13 | 248 | 4256 | 56.89 | 338 | 331 | 69.0 |
| A | 0 | 226 | 3008 | 38.8 | 338 | 331 | 69.0 |
| B | 3 | 112 | 2494735 | 45874.12 | 277 | 270 | 54.4 |
| B | 4 | 48 | 40838 | 746.06 | 277 | 270 | 54.4 |
| B | 0 | 197 | 13468 | 242.72 | 277 | 270 | 54.4 |
| C | 3 | 233 | 118992 | 1534.23 | 328 | 331 | 77.3 |
| C | 13 | 61 | 2267 | 25.03 | 328 | 331 | 77.3 |
| C | 7 | 247 | 1762 | 18.5 | 328 | 331 | 77.3 |
| D | 9 | 68 | 25147 | 302.08 | 332 | 323 | 82.2 |
| D | 2 | 120 | 23350 | 280.22 | 332 | 323 | 82.2 |
| D | 2 | 234 | 11468 | 135.62 | 332 | 323 | 82.2 |
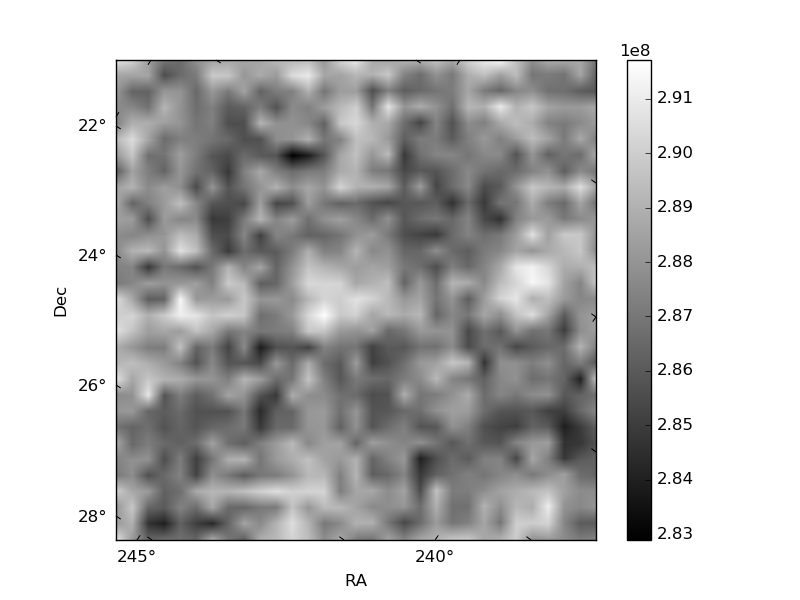
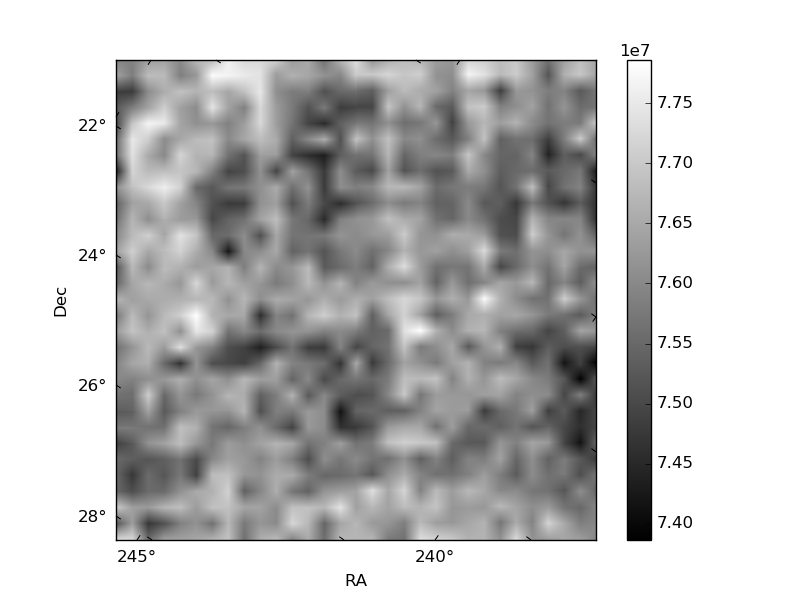
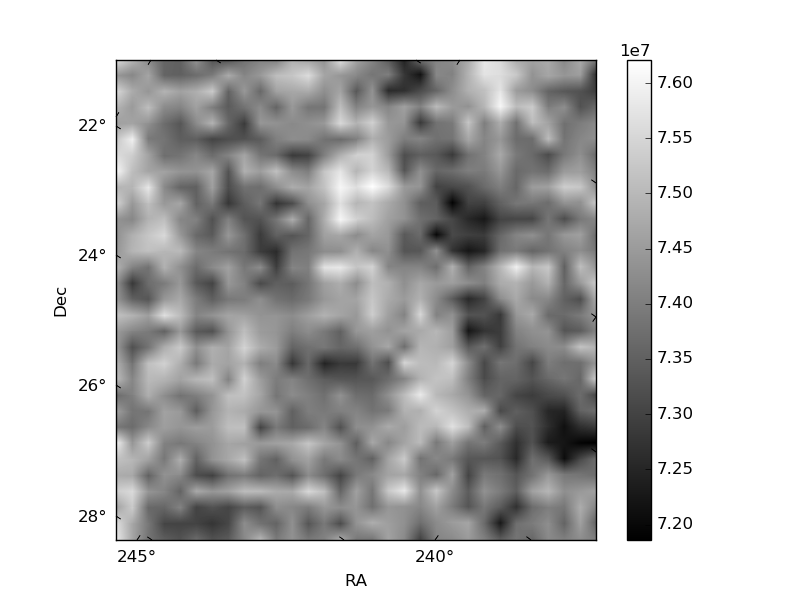
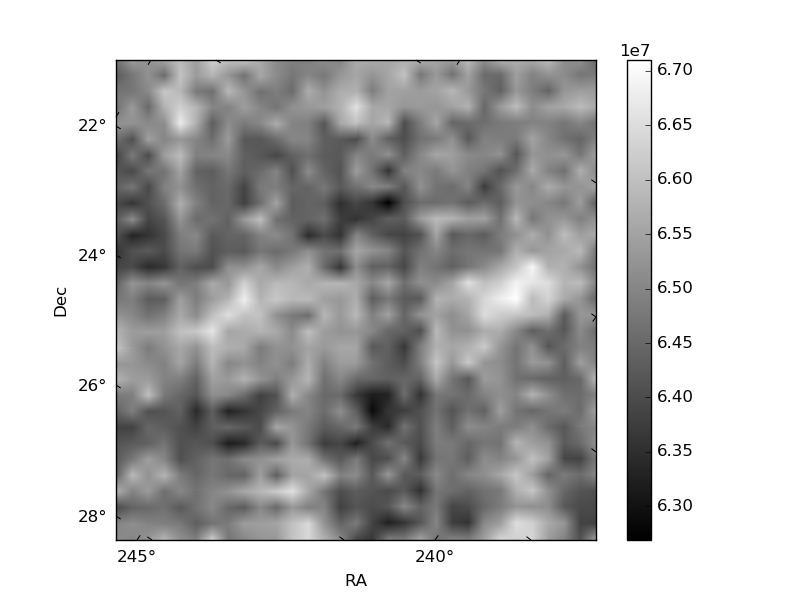
Histogram calculated using DETX and DETY for each event in the final _common_clean file
| Quadrant A | 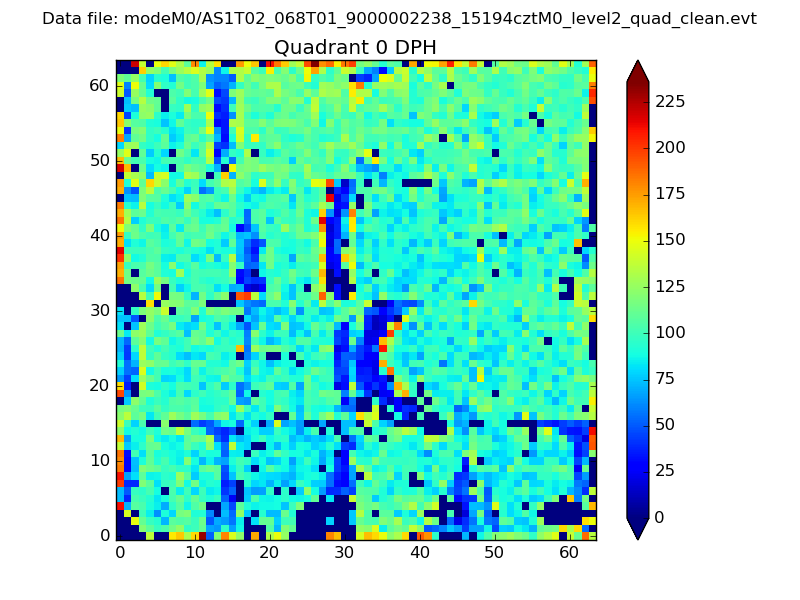 |
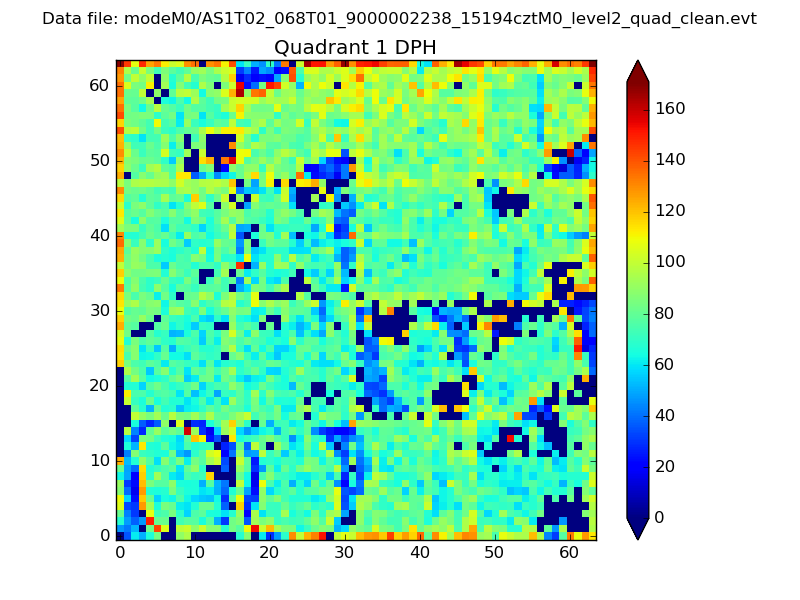 |
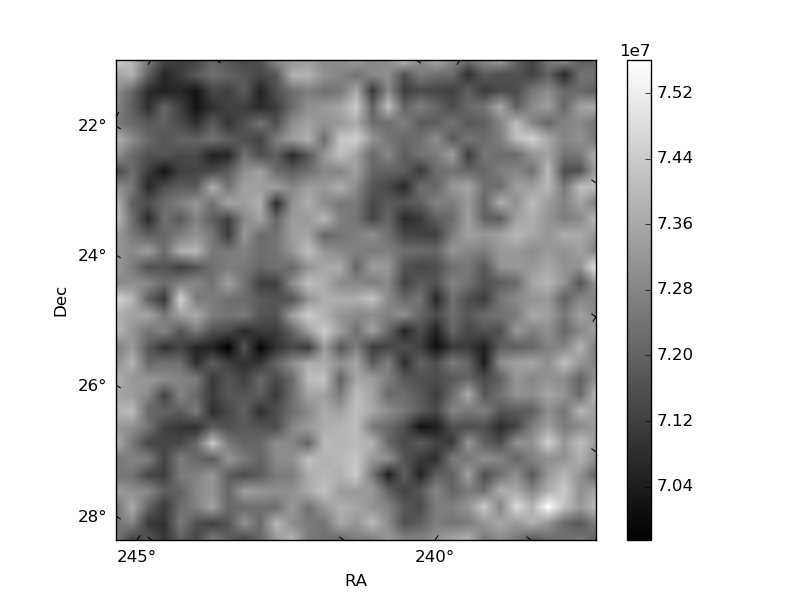
Quadrant B |
|---|---|---|---|
| Quadrant D | 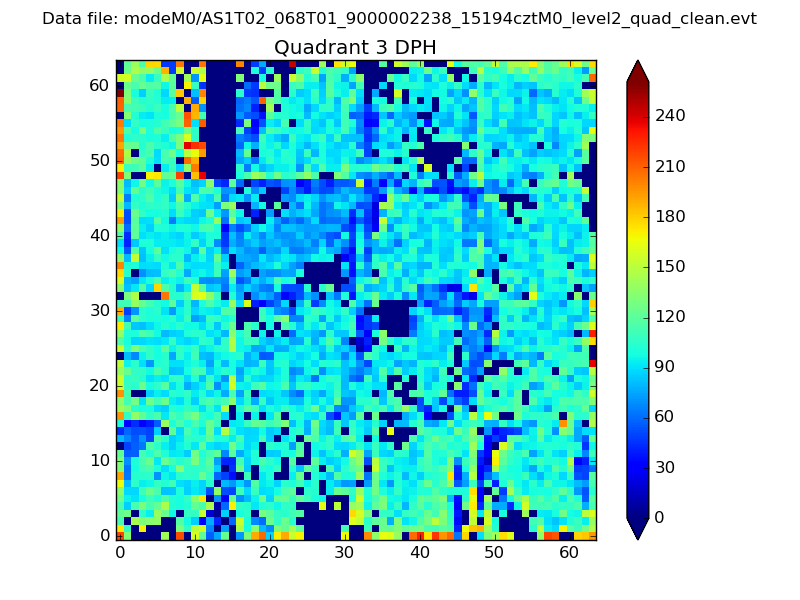 |
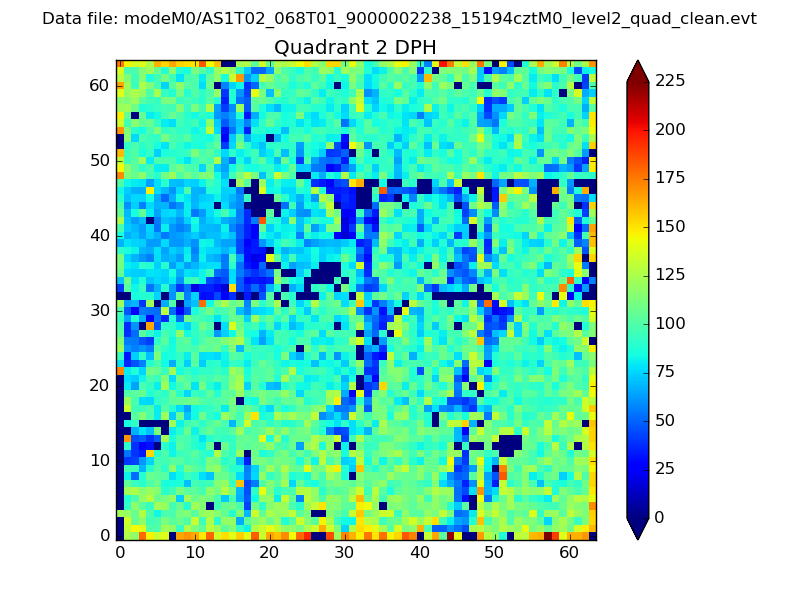 |
Quadrant C |
| Plot type | Count rate plots | Images |
|---|---|---|
| Comparison with Poisson distribution Blue bars denote a histogram of data divided into 1 sec bins. Red curve is a Poisson curve with rate = median count rate of data. |
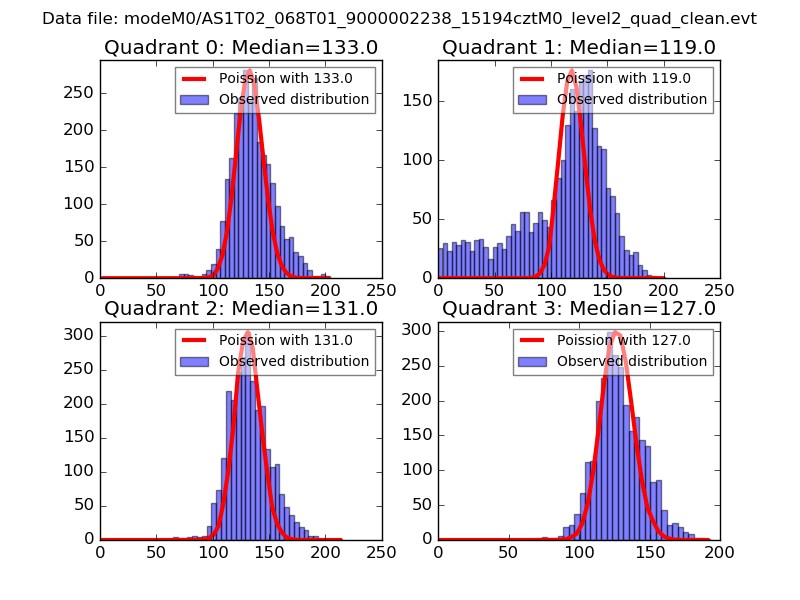 |
 |
| Quadrant-wise count rates Data is divided into 100 sec bins |
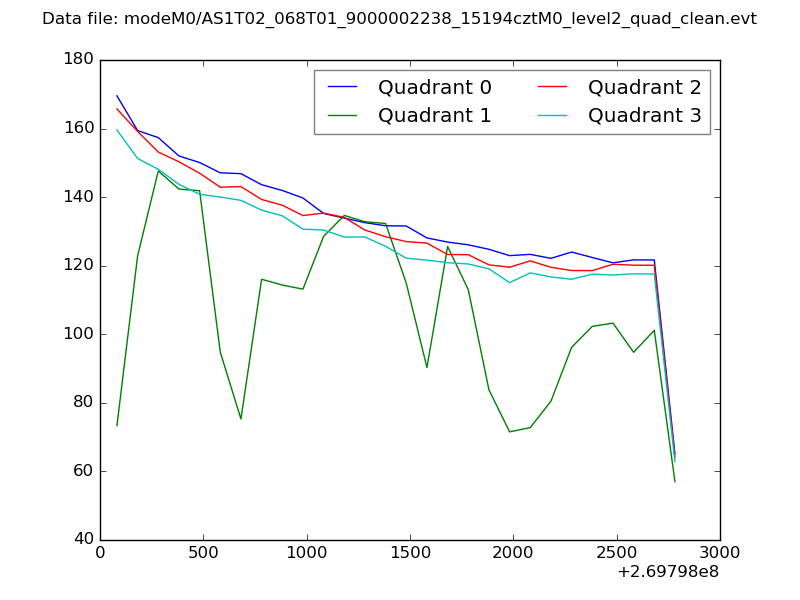 |
|
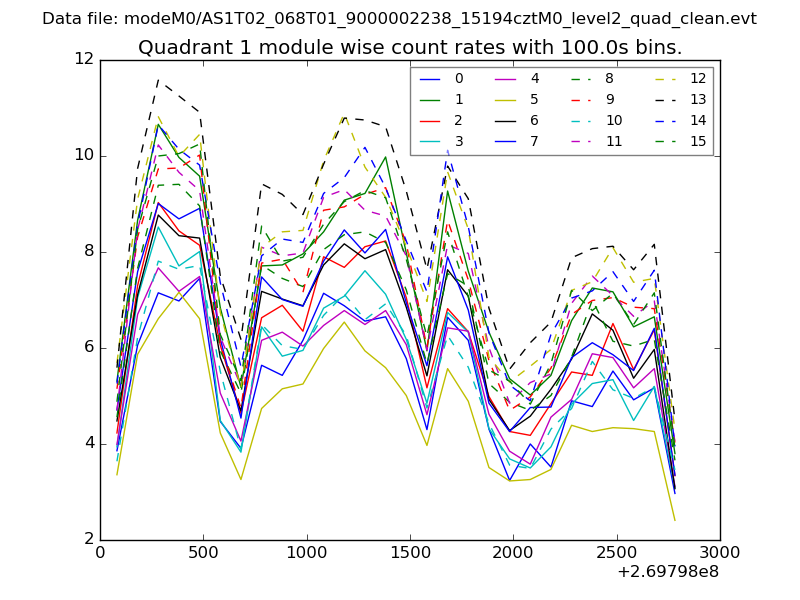
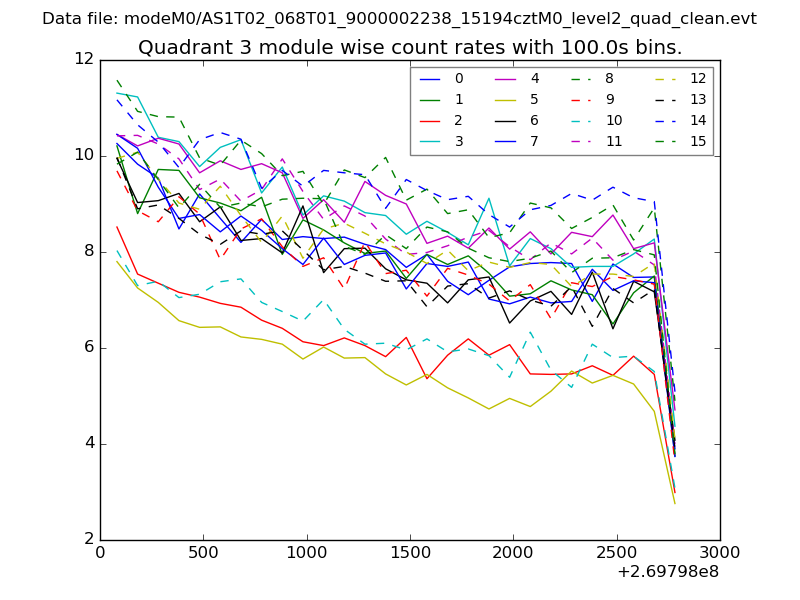
| Module-wise count rates for Quadrant A Data is divided into 100 sec bins |
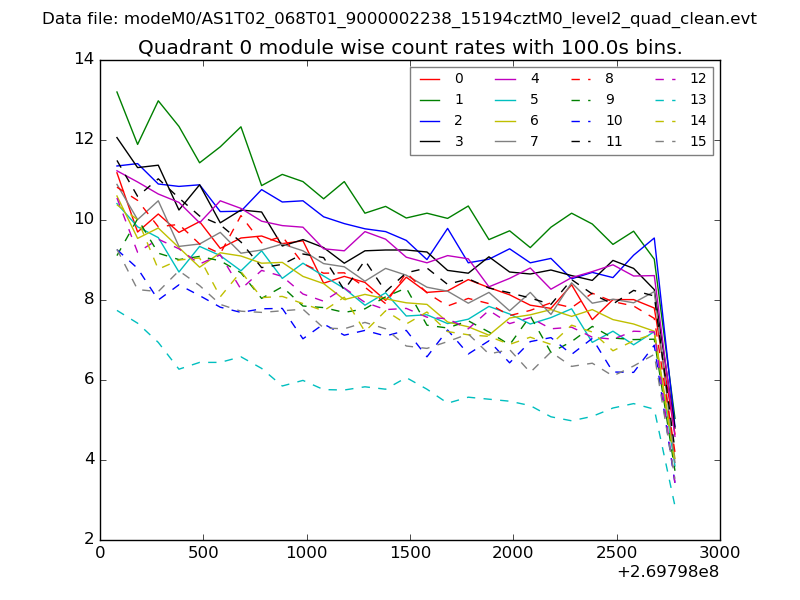 |
 |
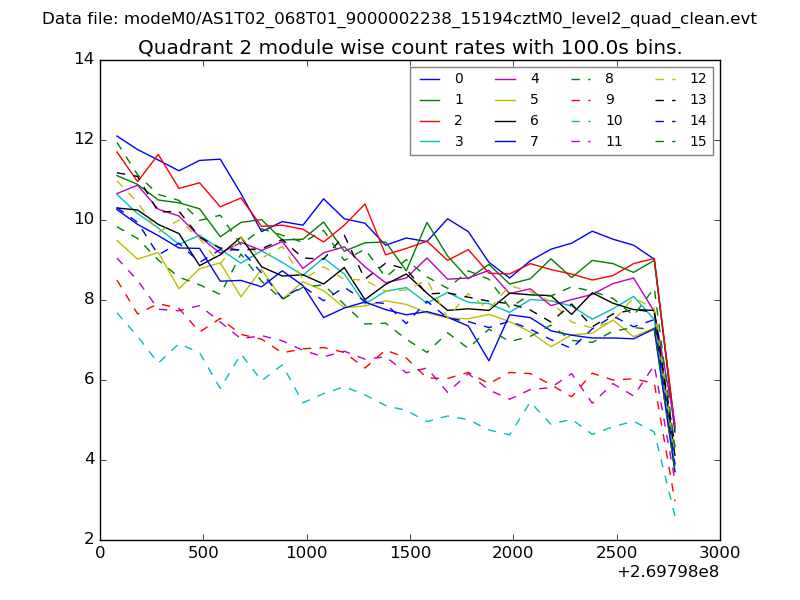
| Module-wise count rates for Quadrant B Data is divided into 100 sec bins |
 |
 |
| Module-wise count rates for Quadrant C Data is divided into 100 sec bins |
 |
 |
| Module-wise count rates for Quadrant D Data is divided into 100 sec bins |
 |
 |
| Parameter | Plot |
|---|---|
| CZT HV Monitor | 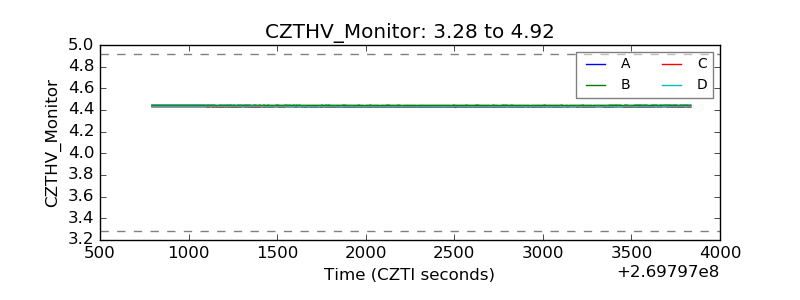 |
| D_VDD | 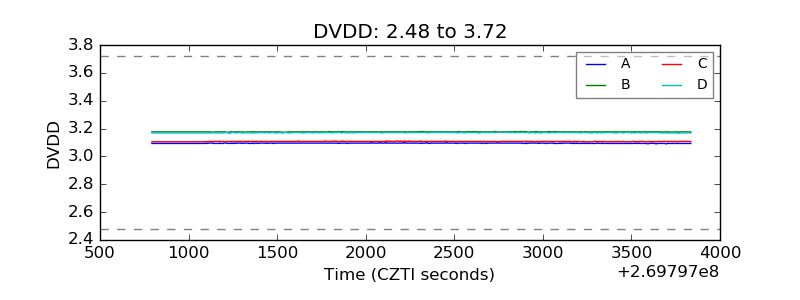 |
| Temperature 1 | 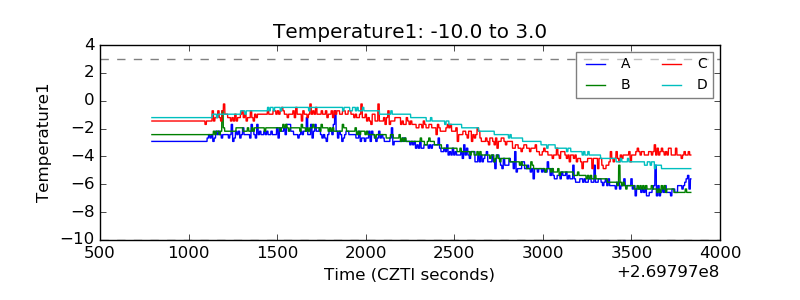 |
| Veto HV Monitor | 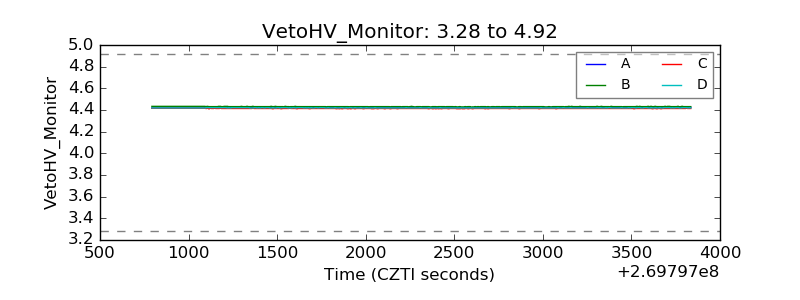 |
| Veto LLD | 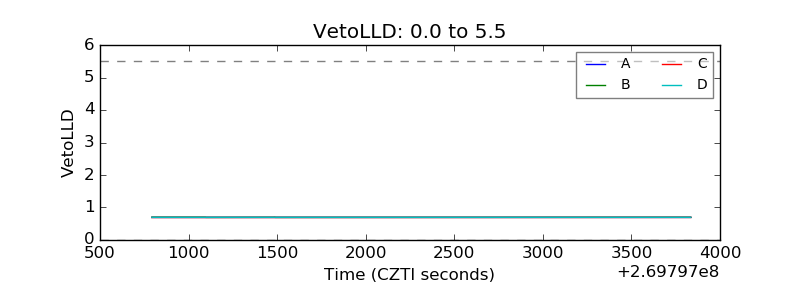 |
| Alpha Counter | 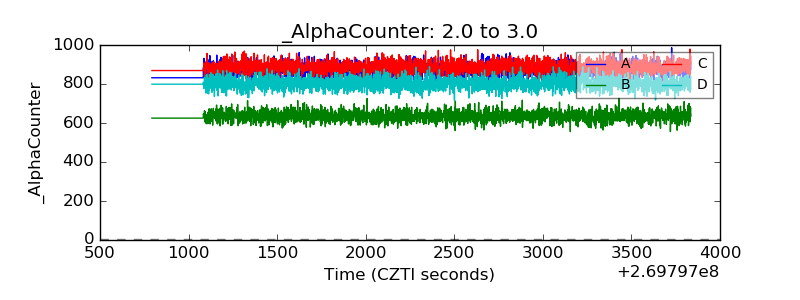 |
| _CPM_Rate | 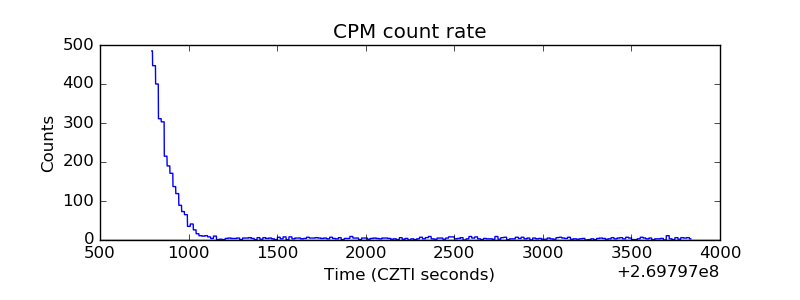 |
| CZT Counter | 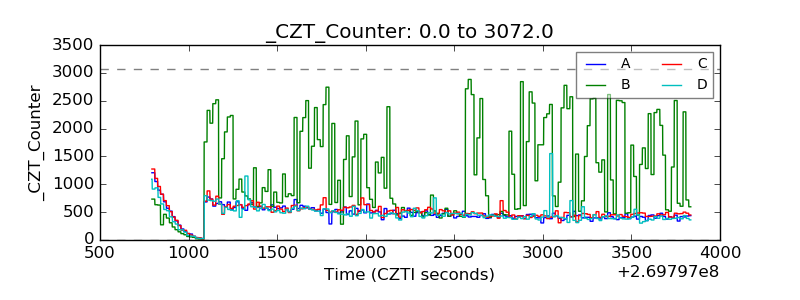 |
| +2.5 Volts monitor | 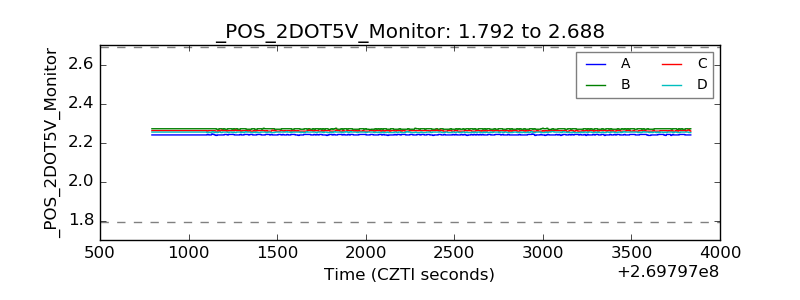 |
| +5 Volts monitor | 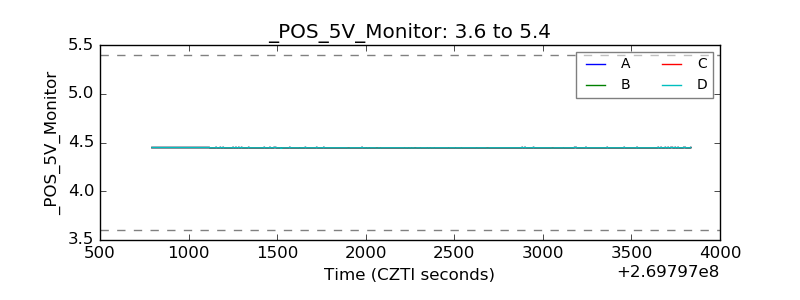 |
| _ROLL_ROT | 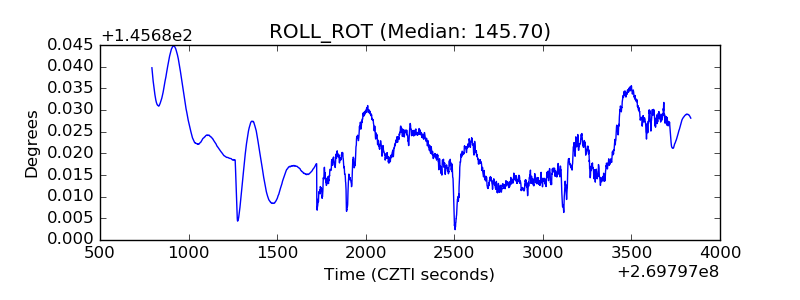 |
| _Roll_DEC | 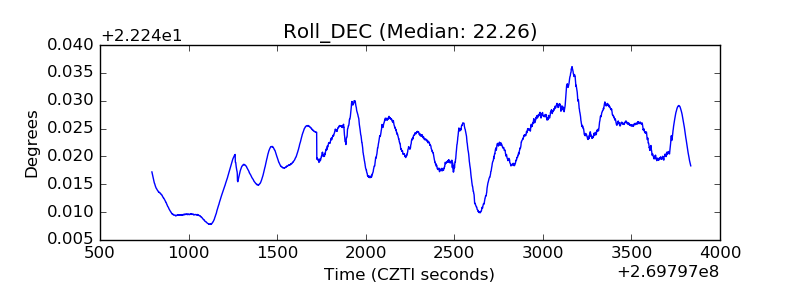 |
| _Roll_RA | 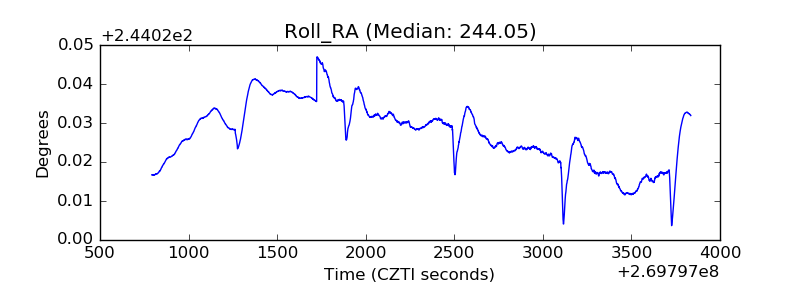 |
| Veto Counter | 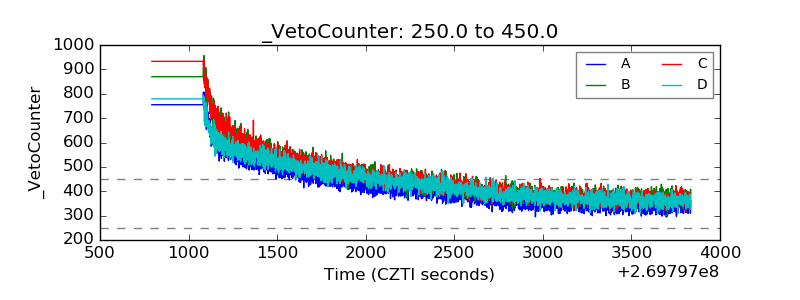 |