| Param | Original file | Final file |
|---|---|---|
| Filename | modeM0/AS1C03_015T04_9000002240cztM0_level2.fits | modeM0/AS1C03_015T04_9000002240cztM0_level2_quad_clean.evt |
| Size (bytes) | 63,181,440 | 61,655,040 |
| Size | 60.3 MB | 58.8 MB |
| Events in quadrant A | 389,370 | 370,188 |
| Events in quadrant B | 346,618 | 339,898 |
| Events in quadrant C | 387,028 | 365,876 |
| Events in quadrant D | 333,990 | 334,213 |
| Mode M9 | |||
|---|---|---|---|
| Quadrant | BADHDUFLAG | Total packets | Discarded packets |
| A | 0 | 13 | 0 |
| B | 0 | 13 | 0 |
| C | 0 | 13 | 0 |
| D | 0 | 13 | 0 |
| Mode M0 | |||
|---|---|---|---|
| Quadrant | BADHDUFLAG | Total packets | Discarded packets |
| A | 0 | 13726 | 0 |
| B | 0 | 21582 | 0 |
| C | 0 | 15436 | 0 |
| D | 0 | 14915 | 0 |
| Mode SS | |||
|---|---|---|---|
| Quadrant | BADHDUFLAG | Total packets | Discarded packets |
| A | 0 | 136 | 0 |
| B | 0 | 136 | 0 |
| C | 0 | 136 | 0 |
| D | 0 | 136 | 0 |
| Quadrant | Total seconds | Saturated seconds | Saturation percentage |
|---|---|---|---|
| A | 6538 | 69 | 1.055369% |
| B | 6538 | 1028 | 15.723463% |
| C | 6538 | 67 | 1.024778% |
| D | 6538 | 136 | 2.080147% |
Noise dominated data is calculated using 1-second bins in cleaned event files. If a bin has >2000 counts, and if more than 50% of those come from <1% of pixels, then it is considered to be noise-dominated and hence unusable.
| Quadrant | # 1 sec bins | Bins with >0 counts | Bins with >2000 counts | High rate bins dominated by noise | Noise dominated (total time) | Noise dominated (detector-on time) | Marked lightcurve |
|---|---|---|---|---|---|---|---|
| A | 7698 | 6537 | 0 | 0 | 0.00% | 0.00% | 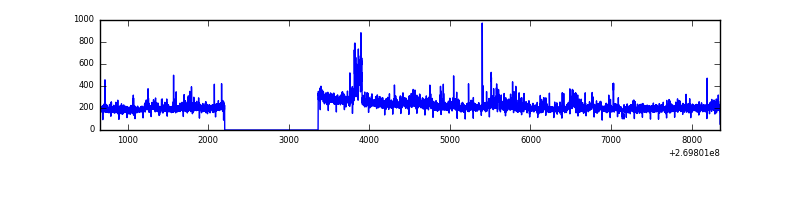 |
| B | 7698 | 6530 | 0 | 0 | 0.00% | 0.00% |  |
| C | 7698 | 6537 | 0 | 0 | 0.00% | 0.00% | 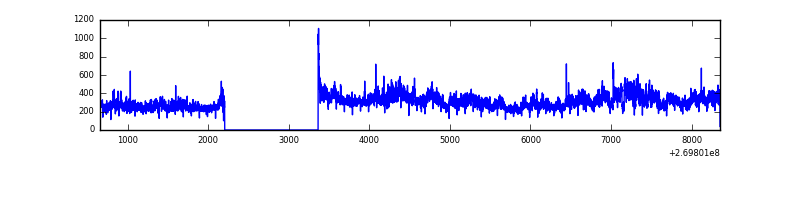 |
| D | 7697 | 6536 | 0 | 0 | 0.00% | 0.00% |  |
Top three noisy pixels from each quadrant. If the there are fewer than three noisy pixels in the level2.evt file, extra rows are filled as -1
| Pixel properties | Quadrant properties | ||||||
|---|---|---|---|---|---|---|---|
| Quadrant | DetID | PixID | Counts | Sigma | Mean | Median | Sigma |
| A | 0 | 29 | 385 | 10.57 | 101 | 96 | 27.3 |
| A | 9 | 19 | 313 | 7.94 | 101 | 96 | 27.3 |
| A | 15 | 236 | 294 | 7.24 | 101 | 96 | 27.3 |
| B | 2 | 9 | 293 | 10.13 | 91 | 88 | 20.2 |
| B | 5 | 232 | 234 | 7.22 | 91 | 88 | 20.2 |
| B | 5 | 128 | 233 | 7.17 | 91 | 88 | 20.2 |
| C | 1 | 80 | 318 | 7.71 | 102 | 96 | 28.8 |
| C | 1 | 81 | 311 | 7.47 | 102 | 96 | 28.8 |
| C | 9 | 242 | 275 | 6.22 | 102 | 96 | 28.8 |
| D | 3 | 14 | 256 | 6.29 | 95 | 87 | 26.9 |
| D | 15 | 46 | 255 | 6.25 | 95 | 87 | 26.9 |
| D | 6 | 231 | 249 | 6.03 | 95 | 87 | 26.9 |
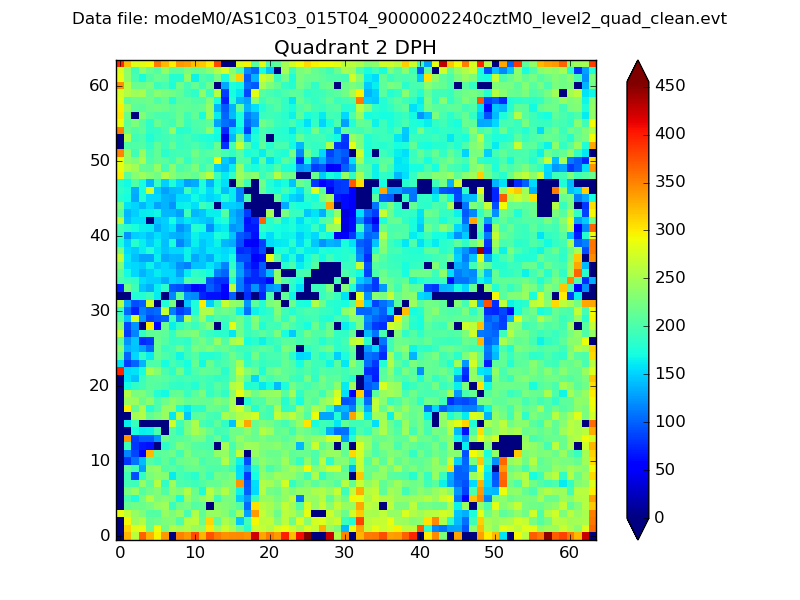
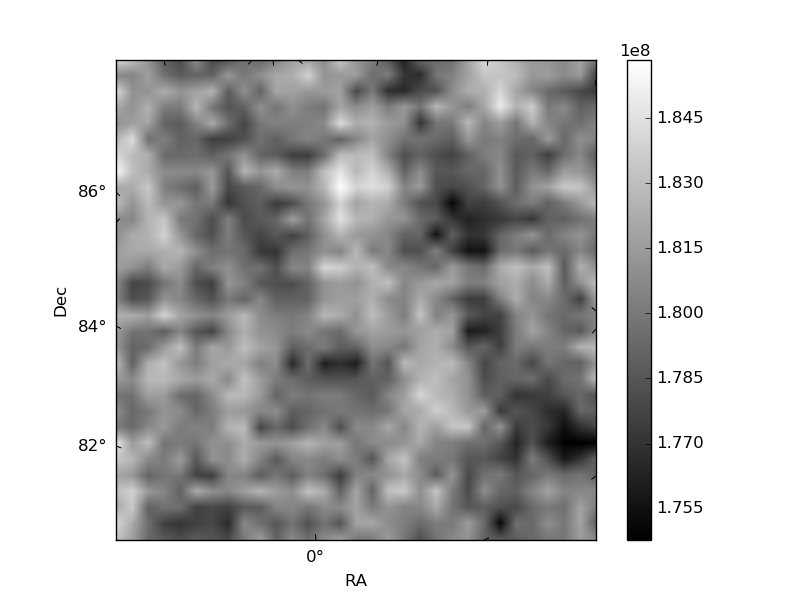
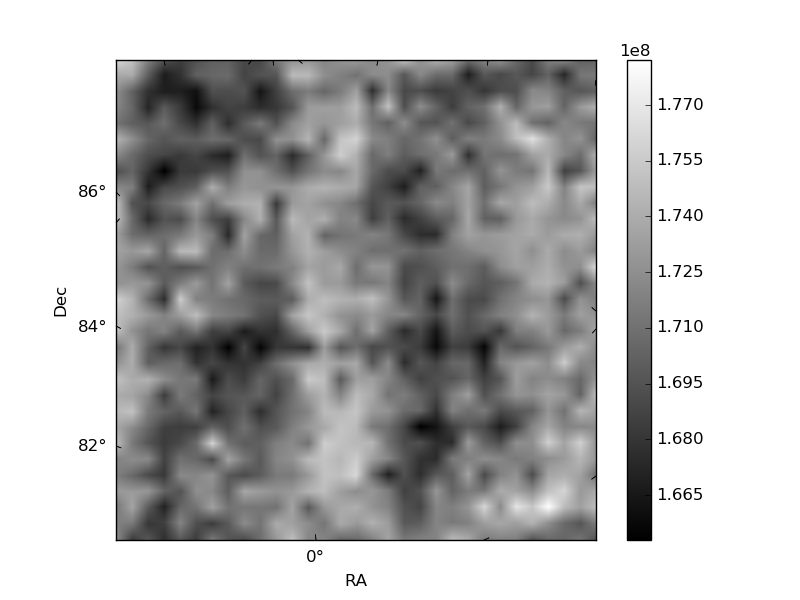
Histogram calculated using DETX and DETY for each event in the final _common_clean file
| Quadrant A |  |
 |
Quadrant B |
|---|---|---|---|
| Quadrant D |  |
 |
Quadrant C |
| Plot type | Count rate plots | Images |
|---|---|---|
| Comparison with Poisson distribution Blue bars denote a histogram of data divided into 1 sec bins. Red curve is a Poisson curve with rate = median count rate of data. |
 |
 |
| Quadrant-wise count rates Data is divided into 100 sec bins |
 |
|
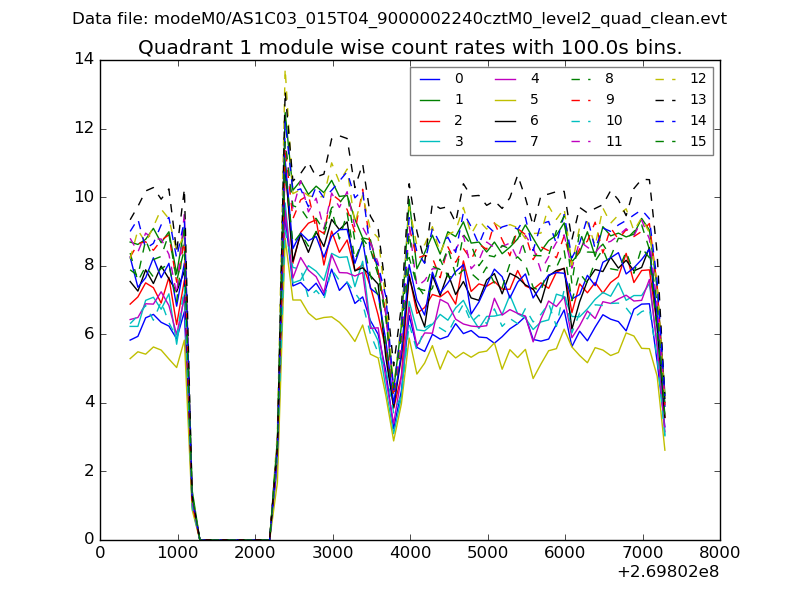
| Module-wise count rates for Quadrant A Data is divided into 100 sec bins |
 |
 |
| Module-wise count rates for Quadrant B Data is divided into 100 sec bins |
 |
 |
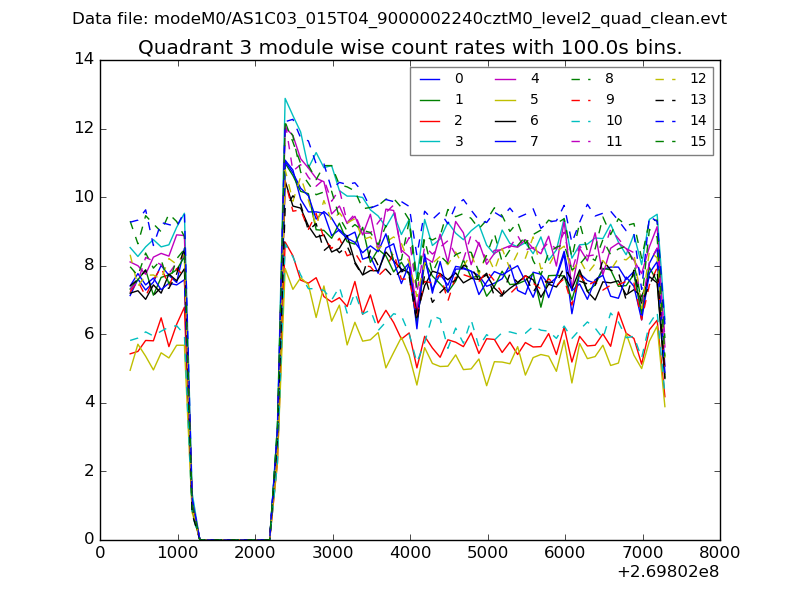
| Module-wise count rates for Quadrant C Data is divided into 100 sec bins |
 |
 |
| Module-wise count rates for Quadrant D Data is divided into 100 sec bins |
 |
 |
| Parameter | Plot |
|---|---|
| CZT HV Monitor |  |
| D_VDD |  |
| Temperature 1 |  |
| Veto HV Monitor |  |
| Veto LLD |  |
| Alpha Counter | 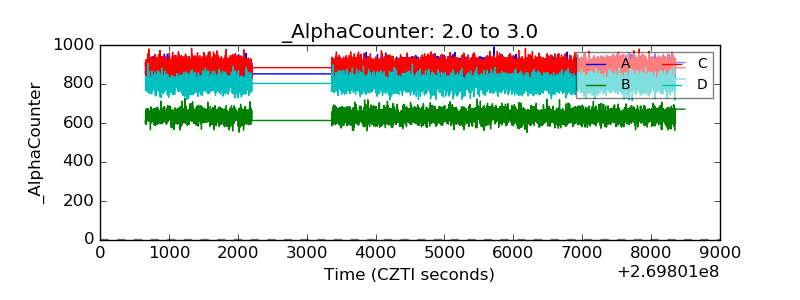 |
| _CPM_Rate |  |
| CZT Counter |  |
| +2.5 Volts monitor |  |
| +5 Volts monitor |  |
| _ROLL_ROT | 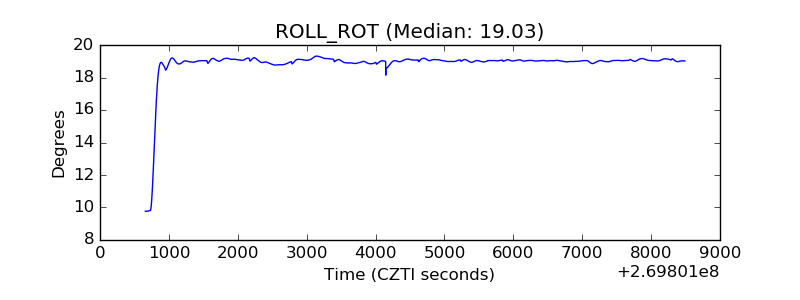 |
| _Roll_DEC | 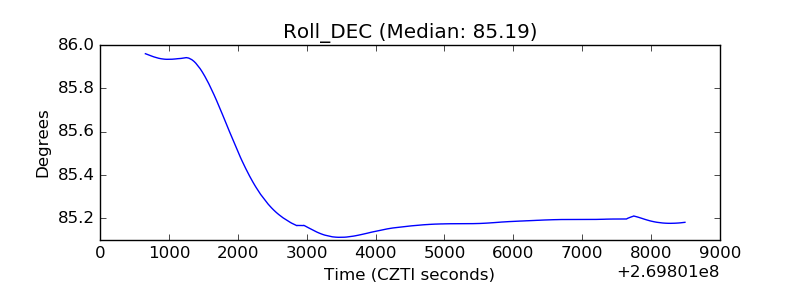 |
| _Roll_RA |  |
| Veto Counter | 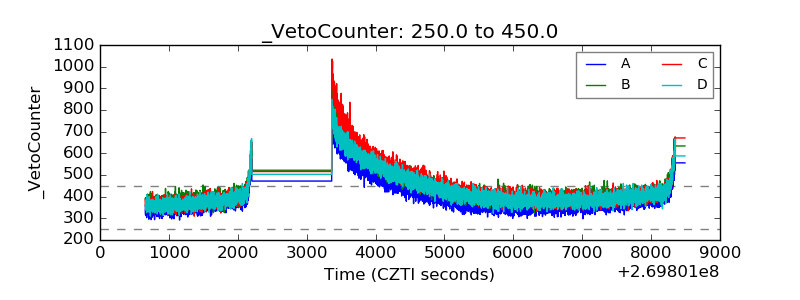 |