| Param | Original file | Final file |
|---|---|---|
| Filename | modeM0/AS1C03_015T04_9000002240_15194cztM0_level2.evt | modeM0/AS1C03_015T04_9000002240_15194cztM0_level2_quad_clean.evt |
| Size (bytes) | 258,180,480 | 57,101,760 |
| Size | 246.2 MB | 54.5 MB |
| Events in quadrant A | 1,489,002 | 388,223 |
| Events in quadrant B | 2,908,512 | 365,520 |
| Events in quadrant C | 1,704,925 | 392,213 |
| Events in quadrant D | 1,517,052 | 374,980 |
| Mode M9 | |||
|---|---|---|---|
| Quadrant | BADHDUFLAG | Total packets | Discarded packets |
| A | 0 | 11 | 0 |
| B | 0 | 11 | 0 |
| C | 0 | 11 | 0 |
| D | 0 | 11 | 0 |
| Mode M0 | |||
|---|---|---|---|
| Quadrant | BADHDUFLAG | Total packets | Discarded packets |
| A | 0 | 6353 | 2 |
| B | 0 | 10622 | 1 |
| C | 0 | 7092 | 1 |
| D | 0 | 6478 | 1 |
| Mode SS | |||
|---|---|---|---|
| Quadrant | BADHDUFLAG | Total packets | Discarded packets |
| A | 0 | 62 | 0 |
| B | 0 | 62 | 0 |
| C | 0 | 62 | 0 |
| D | 0 | 62 | 0 |
| Quadrant | Total seconds | Saturated seconds | Saturation percentage |
|---|---|---|---|
| A | 2907 | 32 | 1.100791% |
| B | 2907 | 559 | 19.229446% |
| C | 2907 | 33 | 1.135191% |
| D | 2907 | 37 | 1.272790% |
Noise dominated data is calculated using 1-second bins in cleaned event files. If a bin has >2000 counts, and if more than 50% of those come from <1% of pixels, then it is considered to be noise-dominated and hence unusable.
| Quadrant | # 1 sec bins | Bins with >0 counts | Bins with >2000 counts | High rate bins dominated by noise | Noise dominated (total time) | Noise dominated (detector-on time) | Marked lightcurve |
|---|---|---|---|---|---|---|---|
| A | 4068 | 2908 | 0 | 0 | 0.00% | 0.00% | 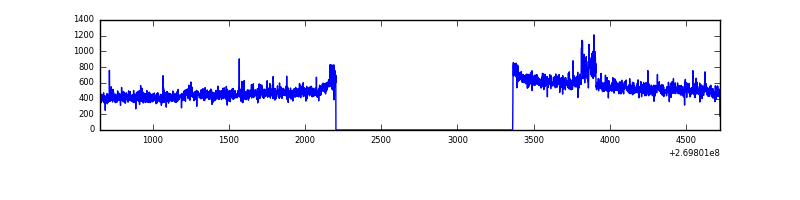 |
| B | 4068 | 2909 | 320 | 320 | 7.87% | 11.00% | 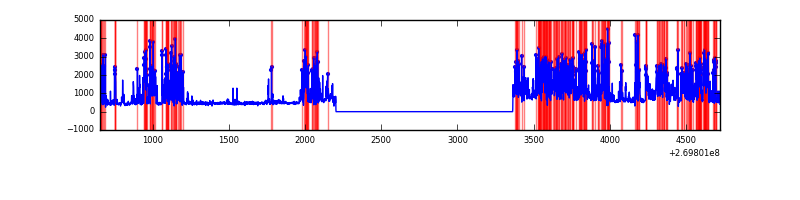 |
| C | 4068 | 2908 | 0 | 0 | 0.00% | 0.00% | 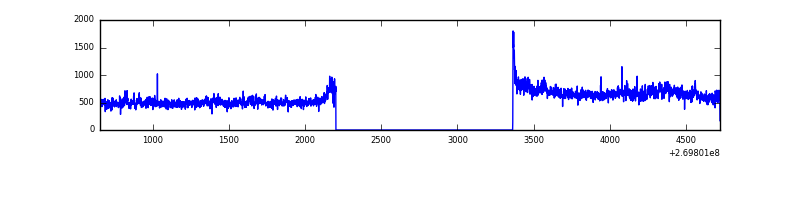 |
| D | 4068 | 2909 | 6 | 6 | 0.15% | 0.21% | 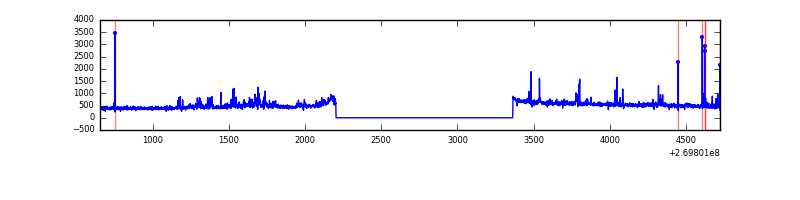 |
Top three noisy pixels from each quadrant. If the there are fewer than three noisy pixels in the level2.evt file, extra rows are filled as -1
| Pixel properties | Quadrant properties | ||||||
|---|---|---|---|---|---|---|---|
| Quadrant | DetID | PixID | Counts | Sigma | Mean | Median | Sigma |
| A | 12 | 189 | 54444 | 703.02 | 372 | 364 | 76.9 |
| A | 3 | 1 | 4161 | 49.36 | 372 | 364 | 76.9 |
| A | 0 | 226 | 3316 | 38.37 | 372 | 364 | 76.9 |
| B | 3 | 112 | 1332189 | 19573.84 | 351 | 341 | 68.0 |
| B | 3 | 64 | 66647 | 974.48 | 351 | 341 | 68.0 |
| B | 4 | 48 | 38693 | 563.65 | 351 | 341 | 68.0 |
| C | 3 | 233 | 282826 | 3345.89 | 363 | 364 | 84.4 |
| C | 0 | 207 | 5827 | 64.71 | 363 | 364 | 84.4 |
| C | 13 | 61 | 2592 | 26.39 | 363 | 364 | 84.4 |
| D | 9 | 68 | 74310 | 837.33 | 363 | 352 | 88.3 |
| D | 2 | 120 | 21911 | 244.08 | 363 | 352 | 88.3 |
| D | 7 | 38 | 19683 | 218.86 | 363 | 352 | 88.3 |
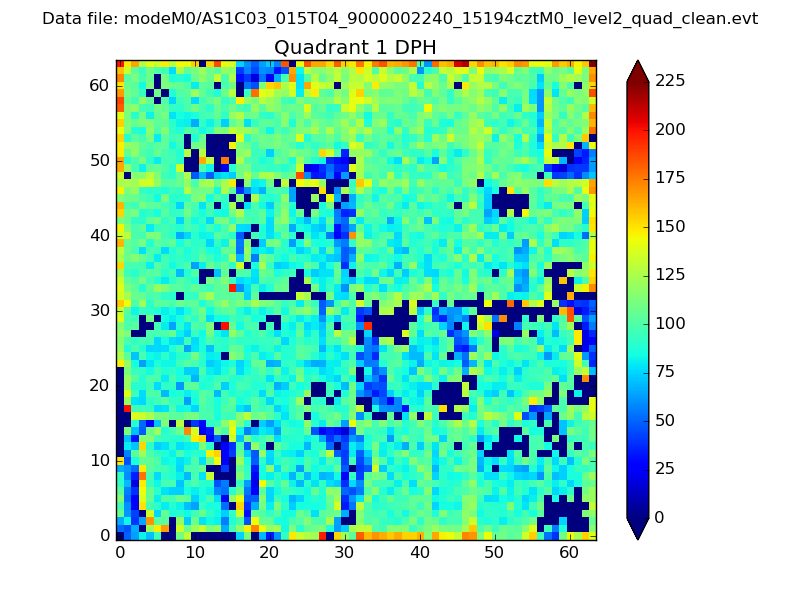
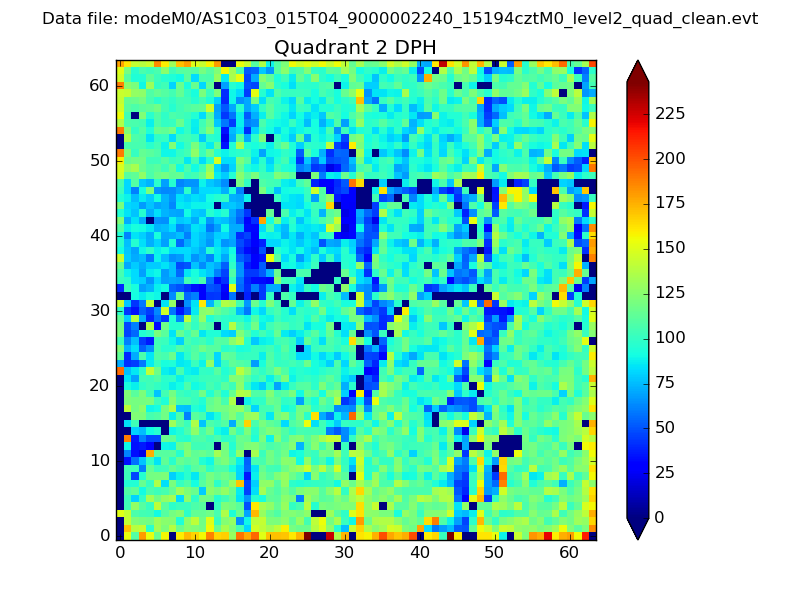
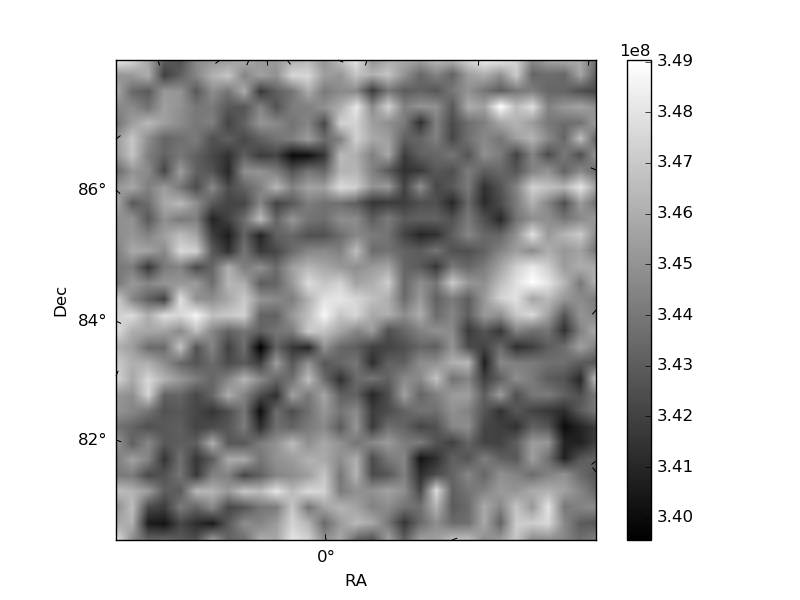
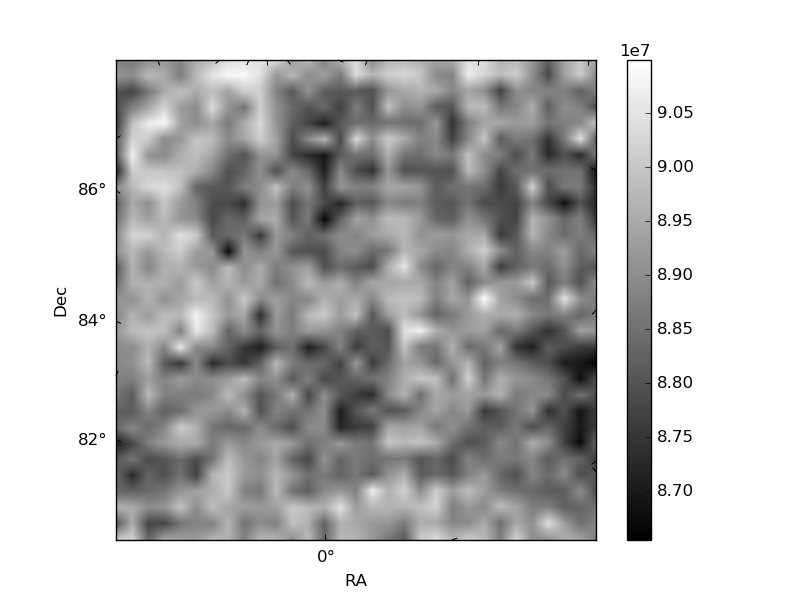
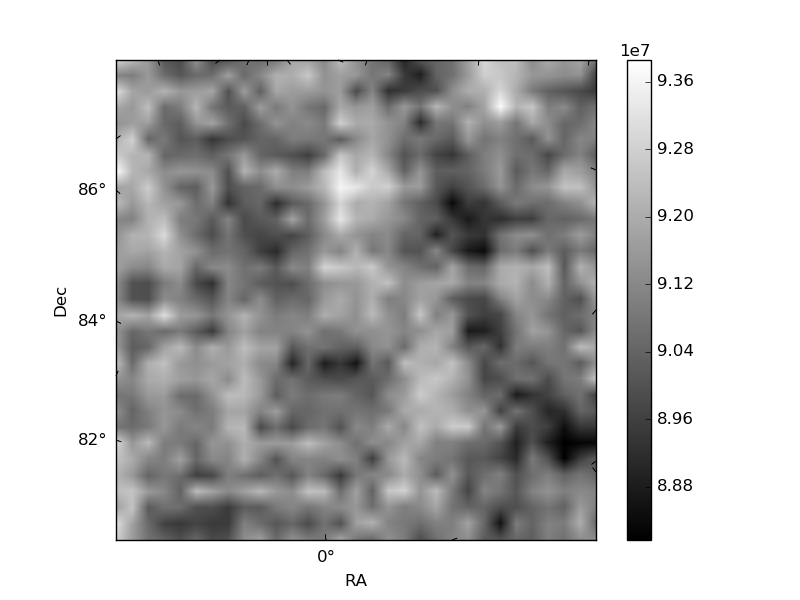
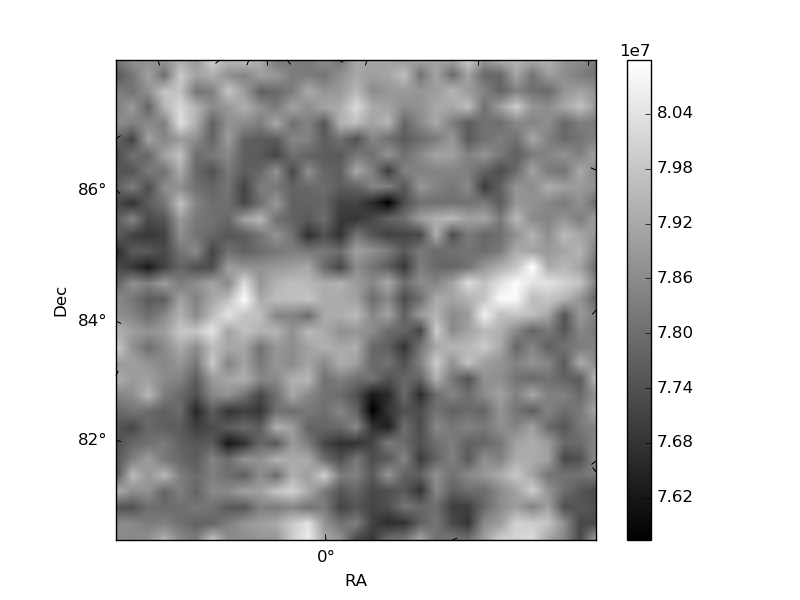
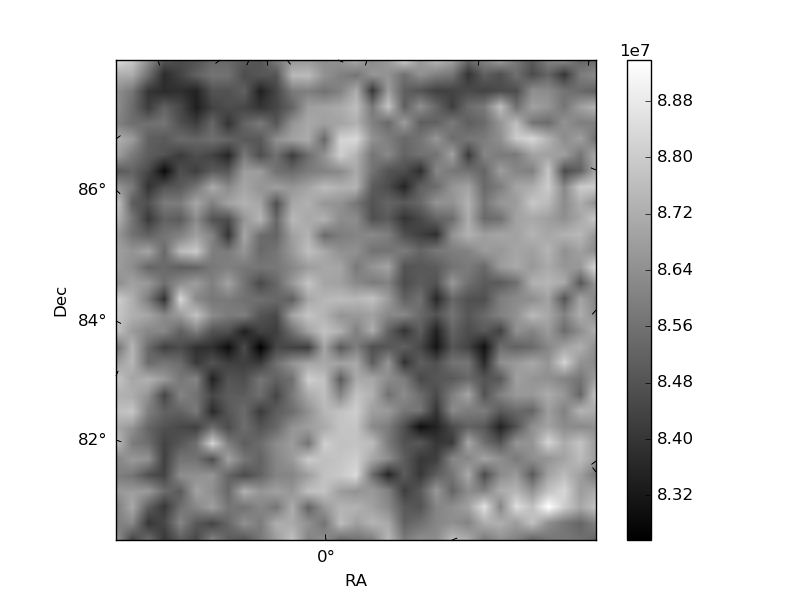
Histogram calculated using DETX and DETY for each event in the final _common_clean file
| Quadrant A |  |
 |
Quadrant B |
|---|---|---|---|
| Quadrant D | 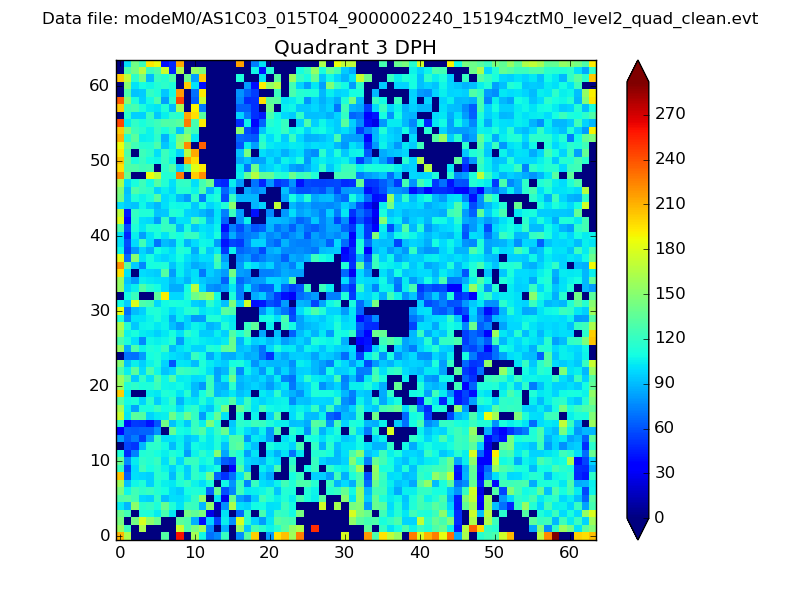 |
 |
Quadrant C |
| Plot type | Count rate plots | Images |
|---|---|---|
| Comparison with Poisson distribution Blue bars denote a histogram of data divided into 1 sec bins. Red curve is a Poisson curve with rate = median count rate of data. |
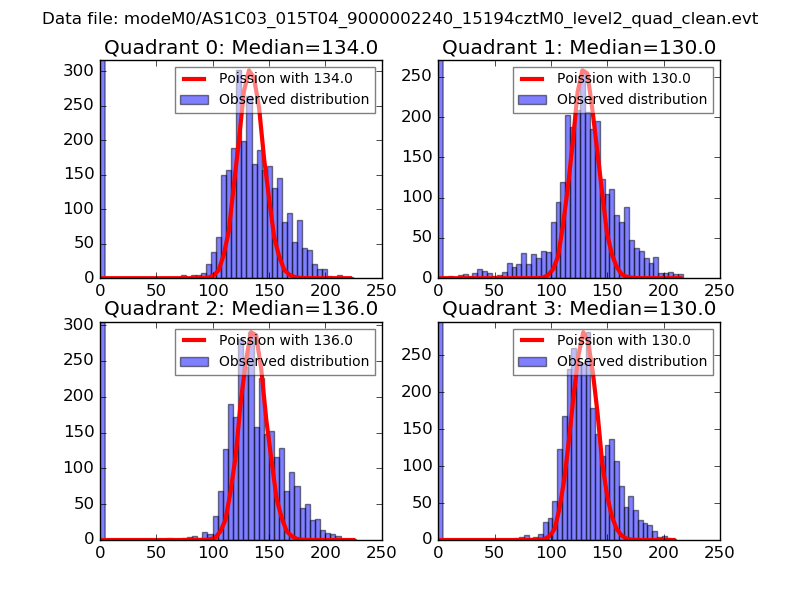 |
 |
| Quadrant-wise count rates Data is divided into 100 sec bins |
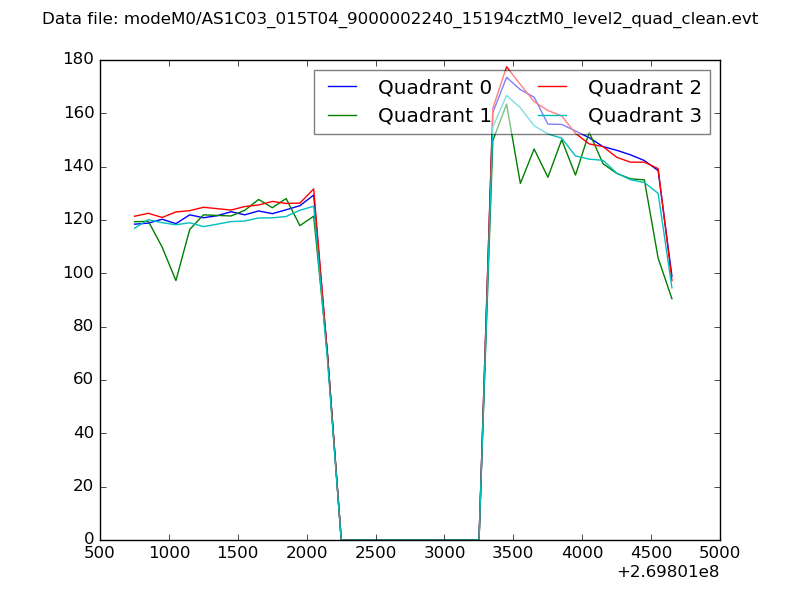 |
|
| Module-wise count rates for Quadrant A Data is divided into 100 sec bins |
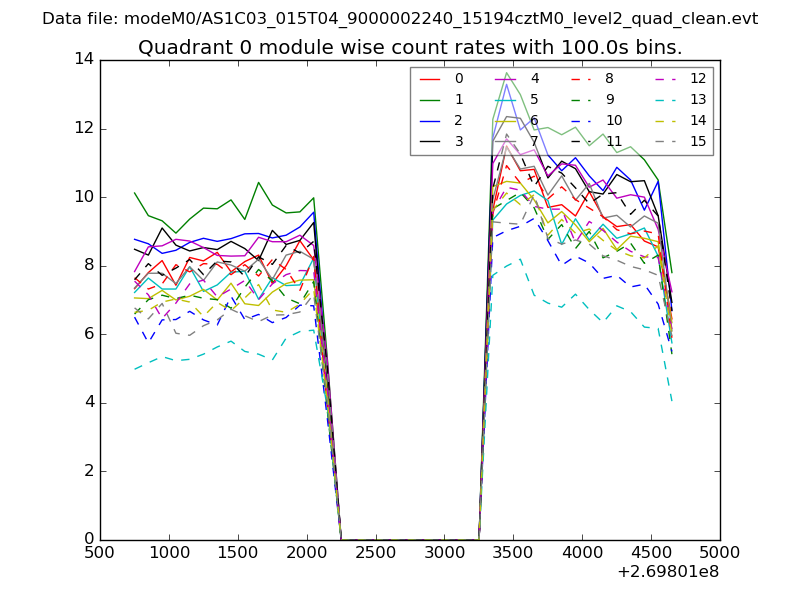 |
 |
| Module-wise count rates for Quadrant B Data is divided into 100 sec bins |
 |
 |
| Module-wise count rates for Quadrant C Data is divided into 100 sec bins |
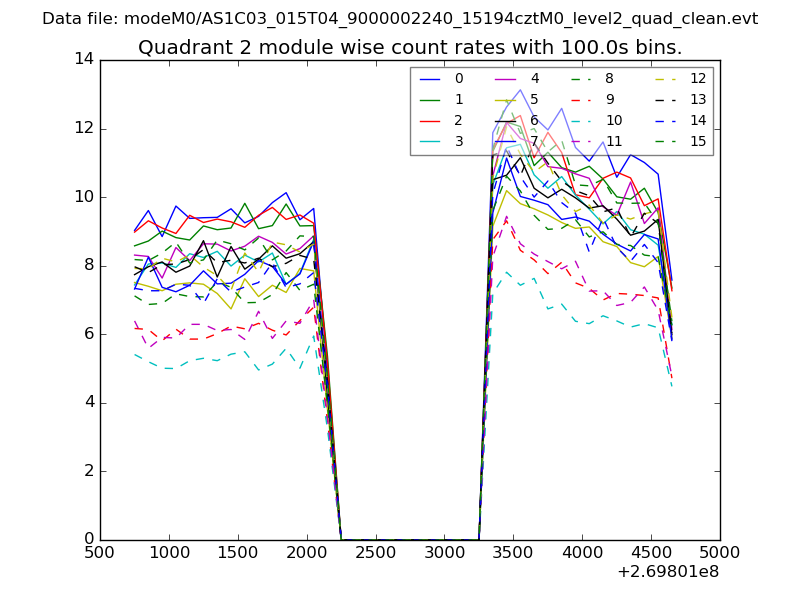 |
 |
| Module-wise count rates for Quadrant D Data is divided into 100 sec bins |
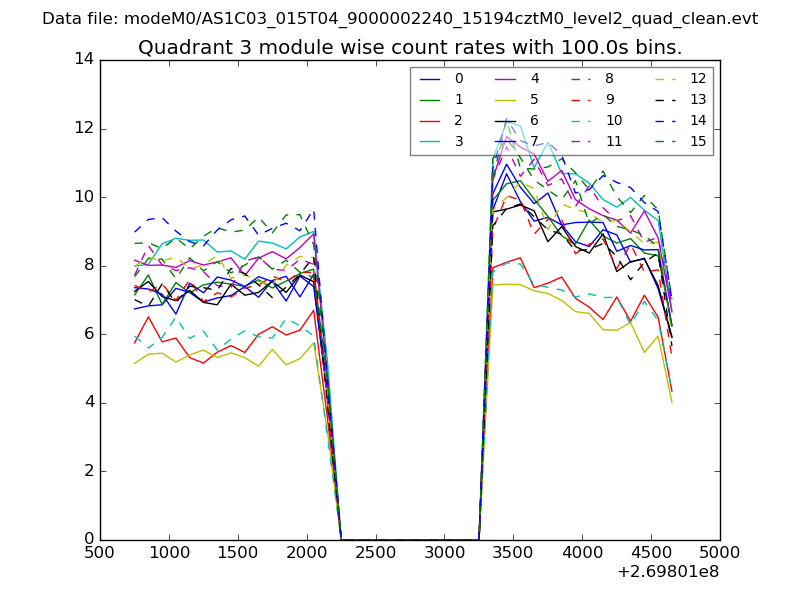 |
 |
| Parameter | Plot |
|---|---|
| CZT HV Monitor | 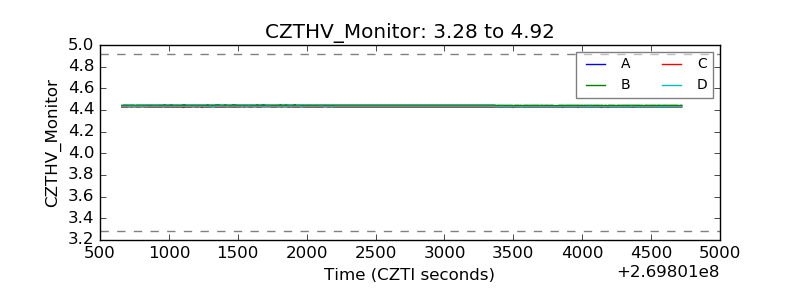 |
| D_VDD | 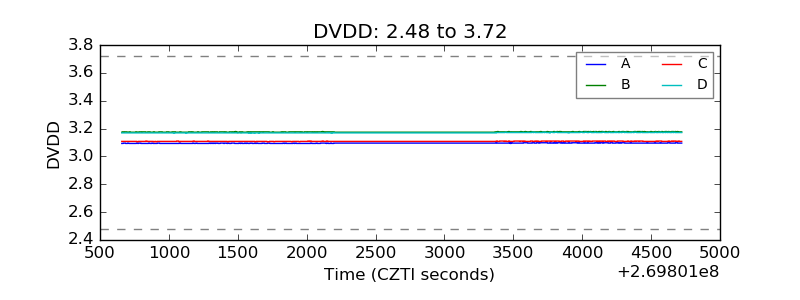 |
| Temperature 1 | 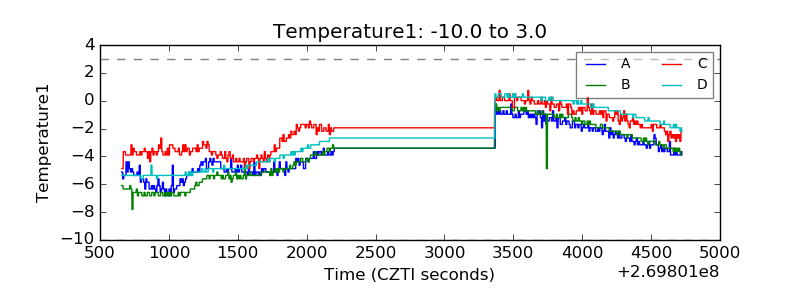 |
| Veto HV Monitor | 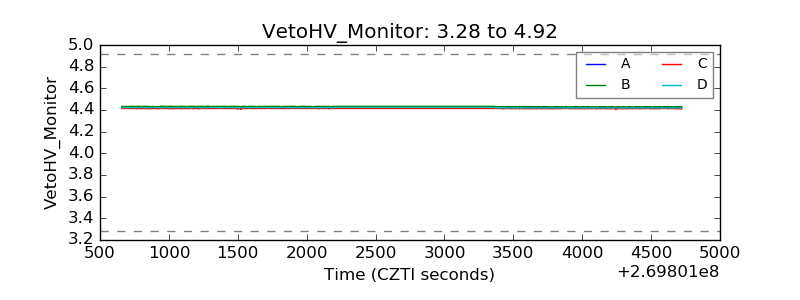 |
| Veto LLD |  |
| Alpha Counter | 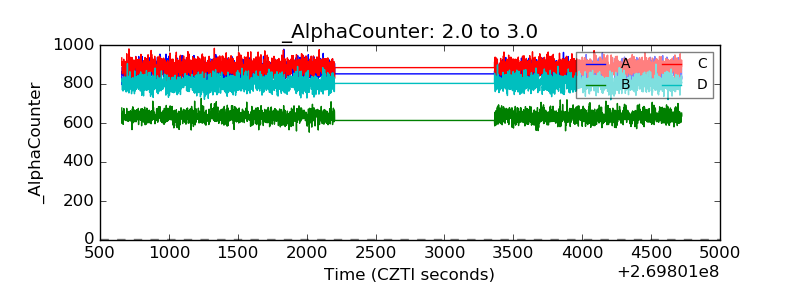 |
| _CPM_Rate | 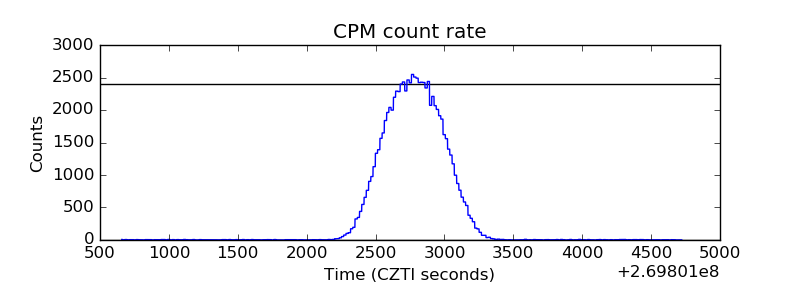 |
| CZT Counter | 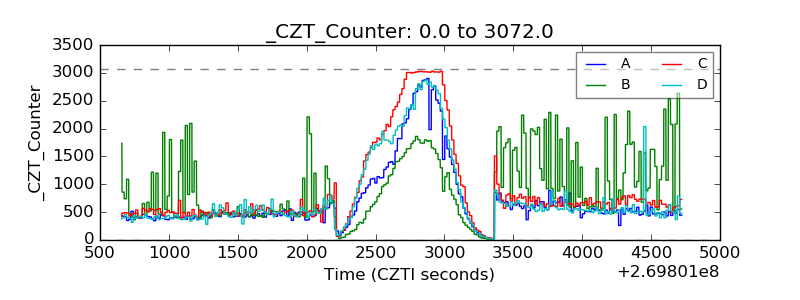 |
| +2.5 Volts monitor |  |
| +5 Volts monitor |  |
| _ROLL_ROT | 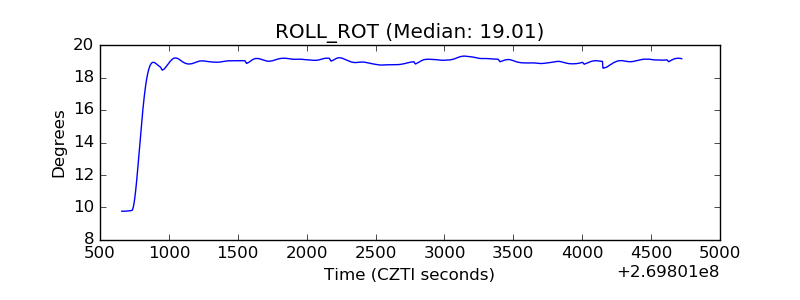 |
| _Roll_DEC | 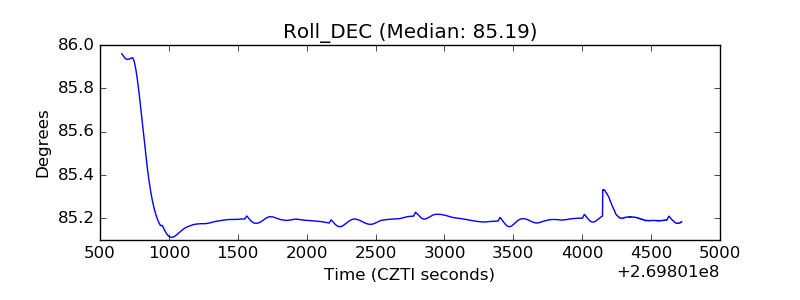 |
| _Roll_RA | 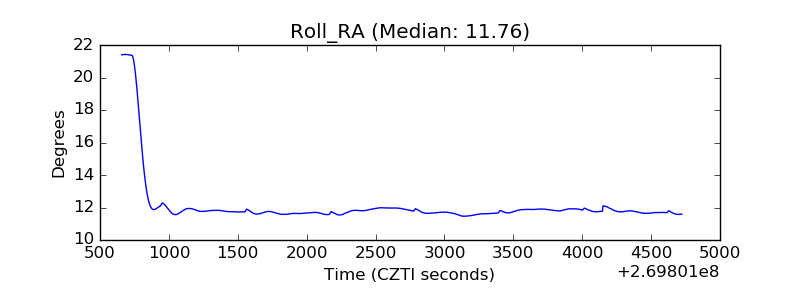 |
| Veto Counter | 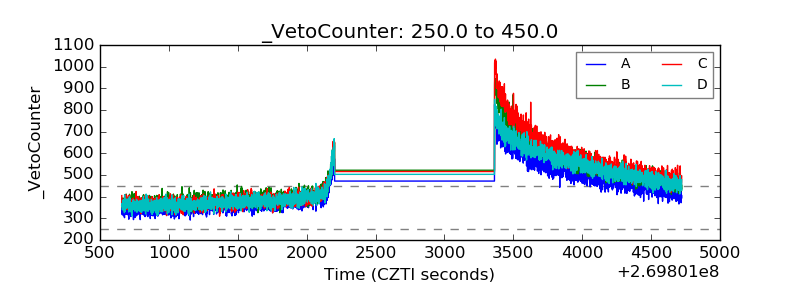 |