| Param | Original file | Final file |
|---|---|---|
| Filename | modeM0/AS1C03_015T04_9000002240_15196cztM0_level2.evt | modeM0/AS1C03_015T04_9000002240_15196cztM0_level2_quad_clean.evt |
| Size (bytes) | 389,122,560 | 89,424,000 |
| Size | 371.1 MB | 85.3 MB |
| Events in quadrant A | 2,180,628 | 604,553 |
| Events in quadrant B | 4,110,645 | 570,837 |
| Events in quadrant C | 2,681,219 | 617,055 |
| Events in quadrant D | 2,496,586 | 589,862 |
| Mode M9 | |||
|---|---|---|---|
| Quadrant | BADHDUFLAG | Total packets | Discarded packets |
| A | 0 | 2 | 0 |
| B | 0 | 2 | 0 |
| C | 0 | 2 | 0 |
| D | 0 | 2 | 0 |
| Mode M0 | |||
|---|---|---|---|
| Quadrant | BADHDUFLAG | Total packets | Discarded packets |
| A | 0 | 9618 | 0 |
| B | 0 | 15337 | 0 |
| C | 0 | 11140 | 0 |
| D | 0 | 10639 | 0 |
| Mode SS | |||
|---|---|---|---|
| Quadrant | BADHDUFLAG | Total packets | Discarded packets |
| A | 0 | 94 | 0 |
| B | 0 | 94 | 0 |
| C | 0 | 94 | 0 |
| D | 0 | 94 | 0 |
| Quadrant | Total seconds | Saturated seconds | Saturation percentage |
|---|---|---|---|
| A | 4637 | 38 | 0.819495% |
| B | 4637 | 698 | 15.052836% |
| C | 4637 | 34 | 0.733233% |
| D | 4637 | 106 | 2.285961% |
Noise dominated data is calculated using 1-second bins in cleaned event files. If a bin has >2000 counts, and if more than 50% of those come from <1% of pixels, then it is considered to be noise-dominated and hence unusable.
| Quadrant | # 1 sec bins | Bins with >0 counts | Bins with >2000 counts | High rate bins dominated by noise | Noise dominated (total time) | Noise dominated (detector-on time) | Marked lightcurve |
|---|---|---|---|---|---|---|---|
| A | 4638 | 4638 | 1 | 1 | 0.02% | 0.02% | 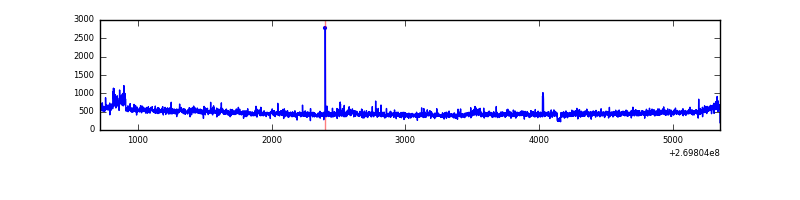 |
| B | 4638 | 4638 | 464 | 464 | 10.00% | 10.00% | 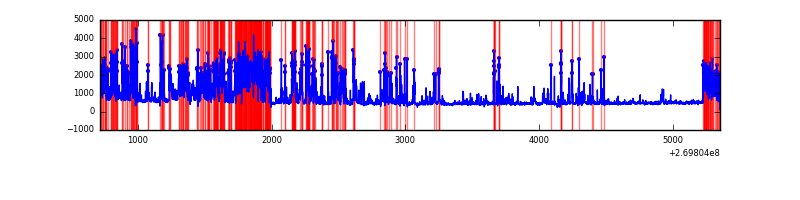 |
| C | 4638 | 4638 | 0 | 0 | 0.00% | 0.00% | 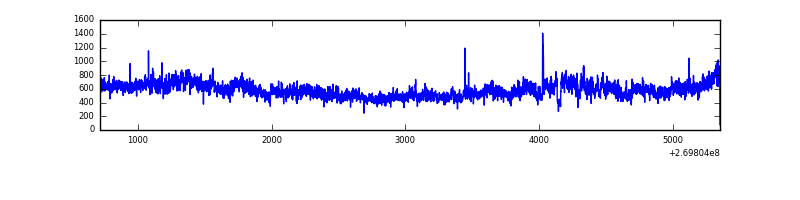 |
| D | 4637 | 4637 | 70 | 70 | 1.51% | 1.51% | 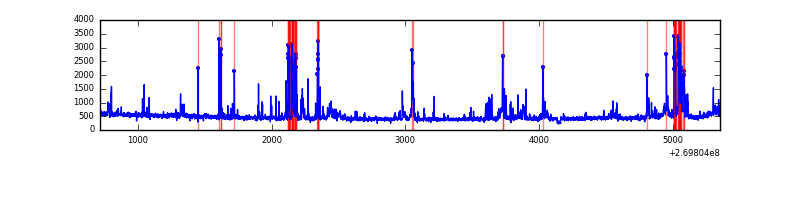 |
Top three noisy pixels from each quadrant. If the there are fewer than three noisy pixels in the level2.evt file, extra rows are filled as -1
| Pixel properties | Quadrant properties | ||||||
|---|---|---|---|---|---|---|---|
| Quadrant | DetID | PixID | Counts | Sigma | Mean | Median | Sigma |
| A | 12 | 189 | 86342 | 785.26 | 539 | 529 | 109.3 |
| A | 13 | 248 | 9412 | 81.29 | 539 | 529 | 109.3 |
| A | 3 | 1 | 6035 | 50.38 | 539 | 529 | 109.3 |
| B | 3 | 112 | 1886627 | 19776.46 | 510 | 498 | 95.4 |
| B | 3 | 64 | 83698 | 872.37 | 510 | 498 | 95.4 |
| B | 0 | 189 | 43485 | 450.73 | 510 | 498 | 95.4 |
| C | 3 | 233 | 590129 | 4795.42 | 533 | 535 | 122.9 |
| C | 0 | 207 | 5985 | 44.33 | 533 | 535 | 122.9 |
| C | 13 | 61 | 3958 | 27.84 | 533 | 535 | 122.9 |
| D | 2 | 33 | 157337 | 1232.68 | 526 | 510 | 127.2 |
| D | 7 | 38 | 153053 | 1199.01 | 526 | 510 | 127.2 |
| D | 4 | 95 | 119851 | 938.04 | 526 | 510 | 127.2 |
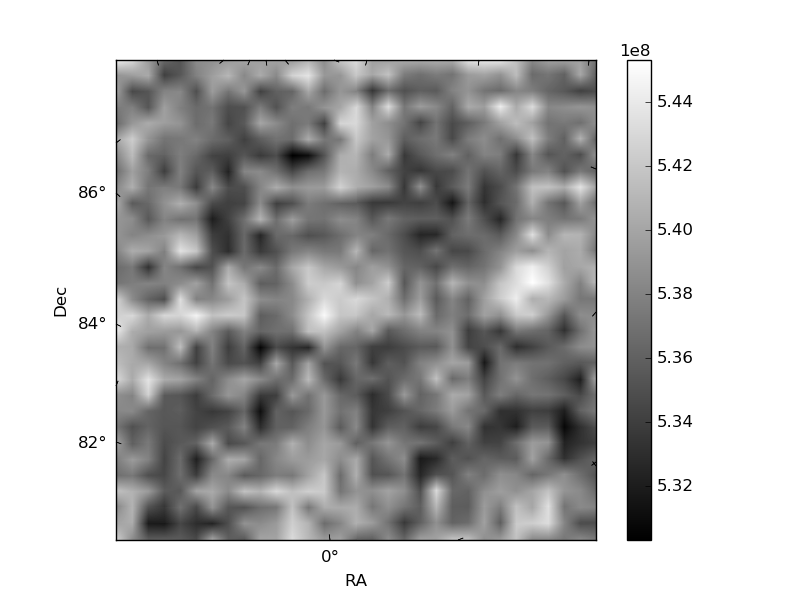
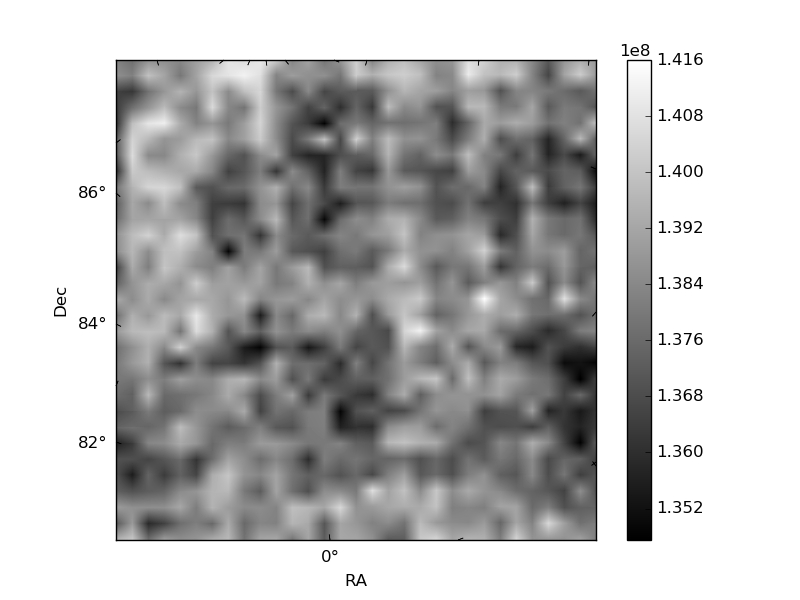
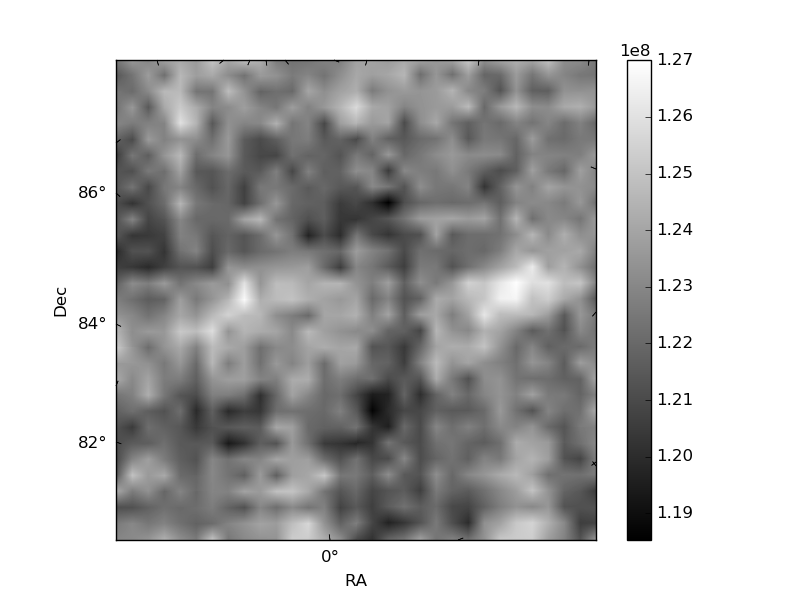
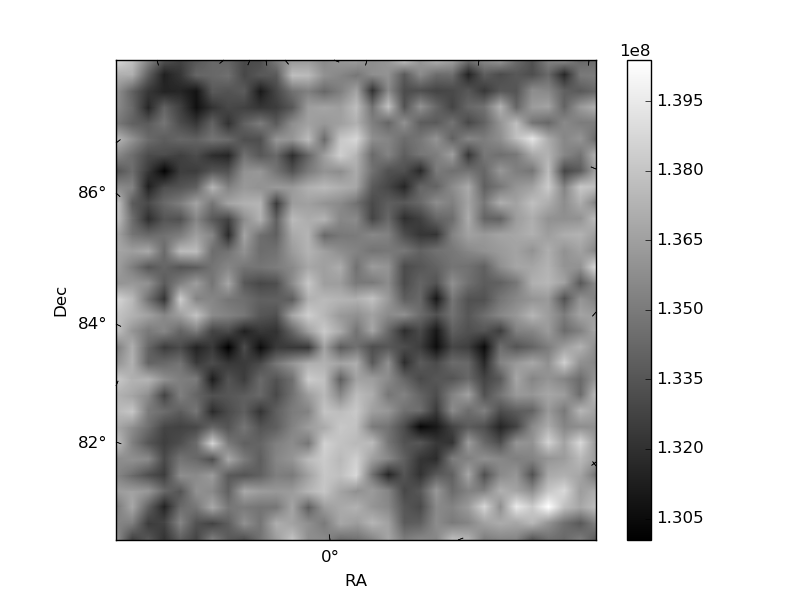
Histogram calculated using DETX and DETY for each event in the final _common_clean file
| Quadrant A | 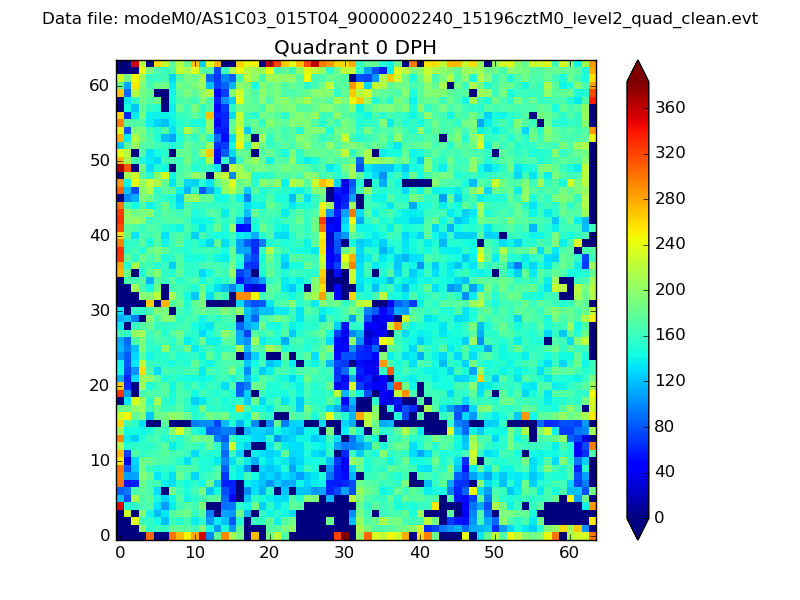 |
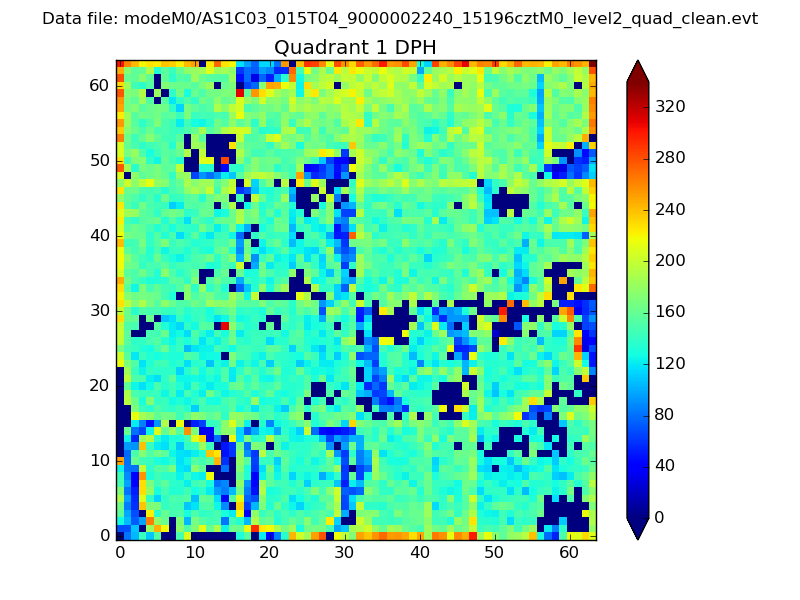 |
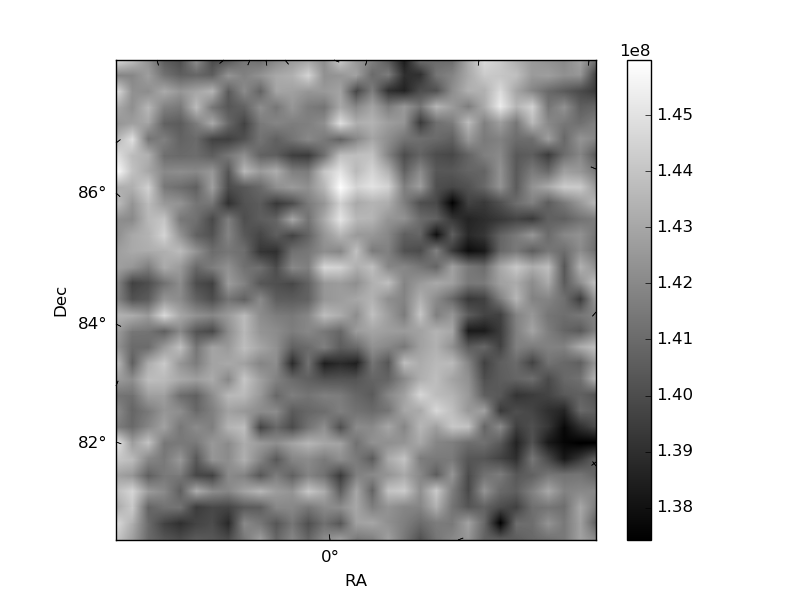
Quadrant B |
|---|---|---|---|
| Quadrant D | 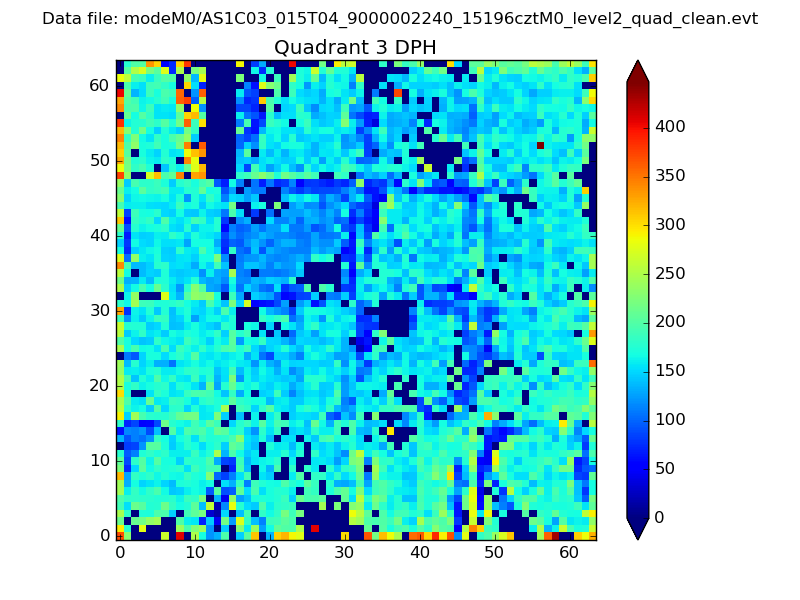 |
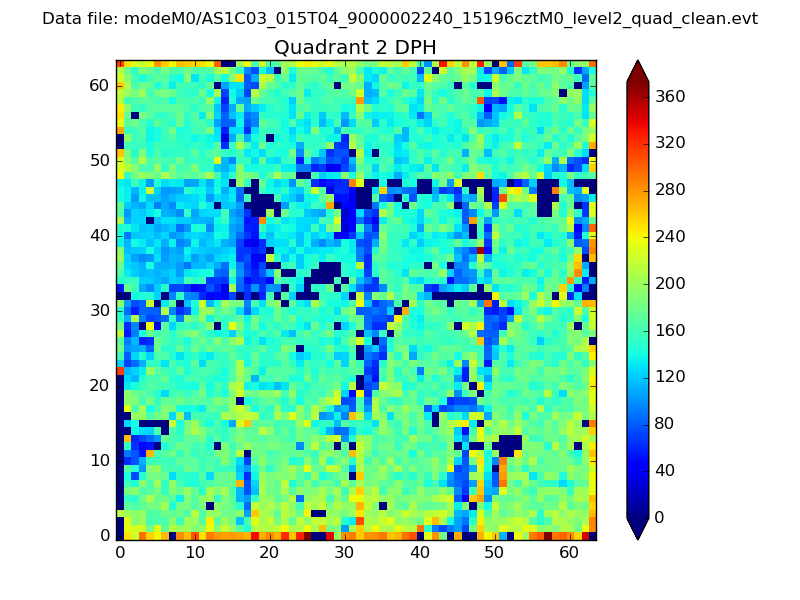 |
Quadrant C |
| Plot type | Count rate plots | Images |
|---|---|---|
| Comparison with Poisson distribution Blue bars denote a histogram of data divided into 1 sec bins. Red curve is a Poisson curve with rate = median count rate of data. |
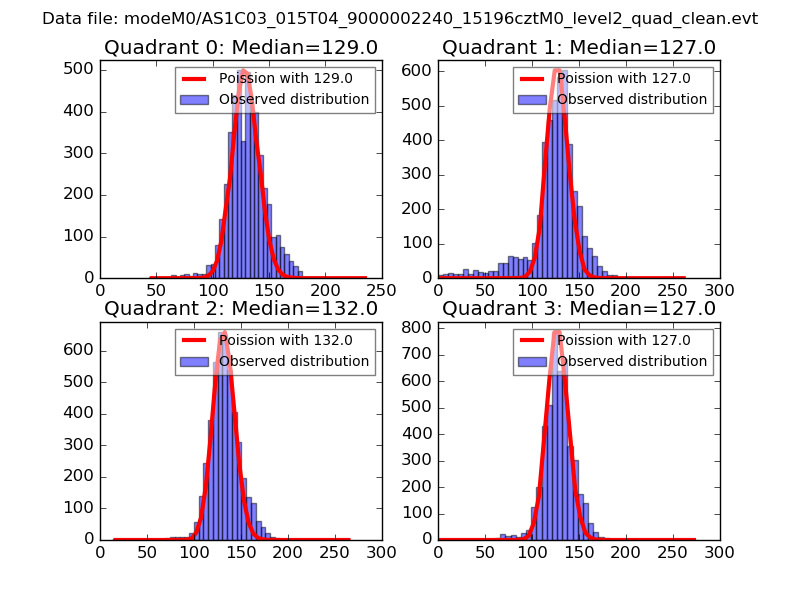 |
 |
| Quadrant-wise count rates Data is divided into 100 sec bins |
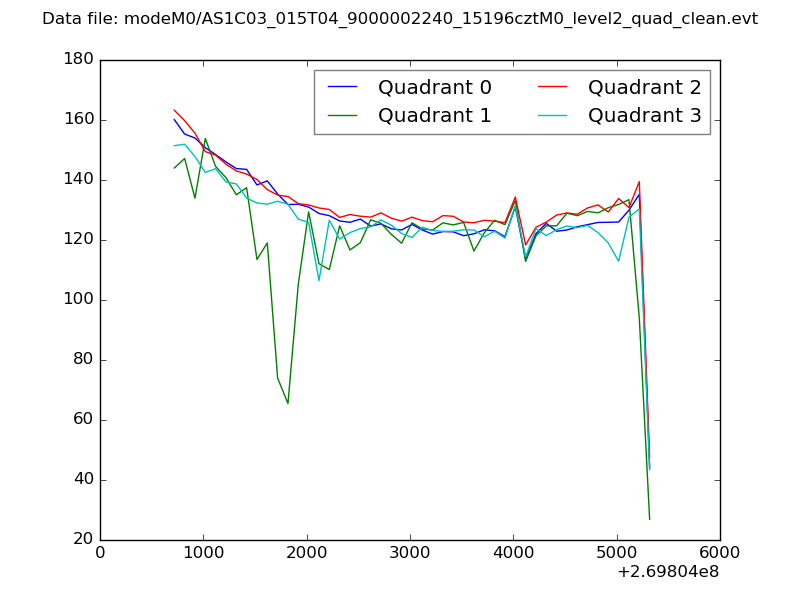 |
|
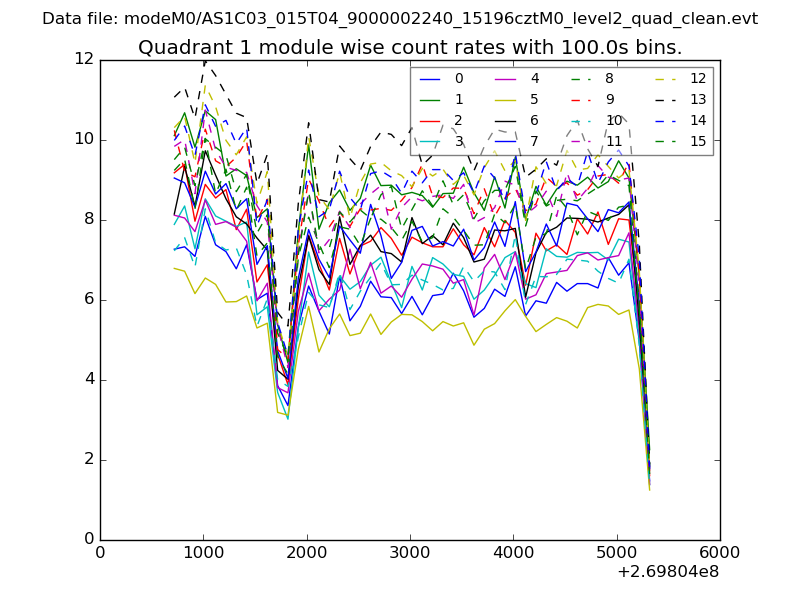
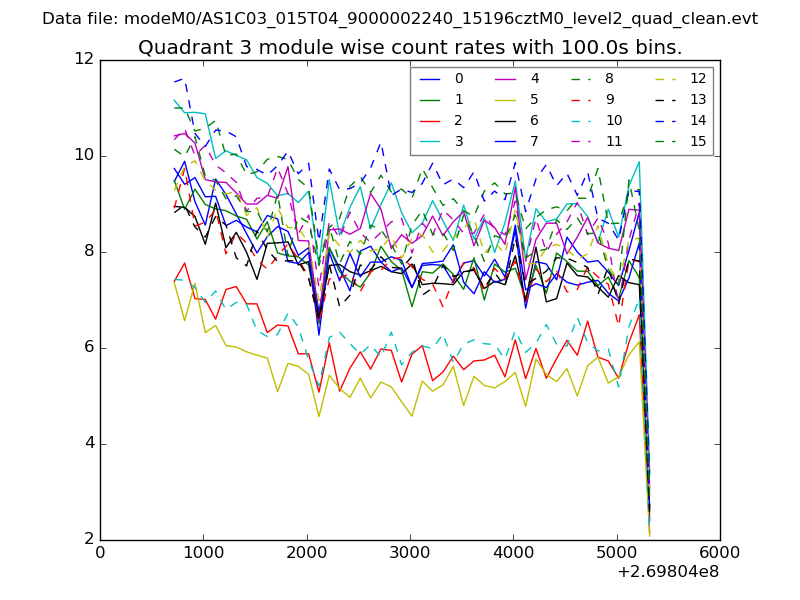
| Module-wise count rates for Quadrant A Data is divided into 100 sec bins |
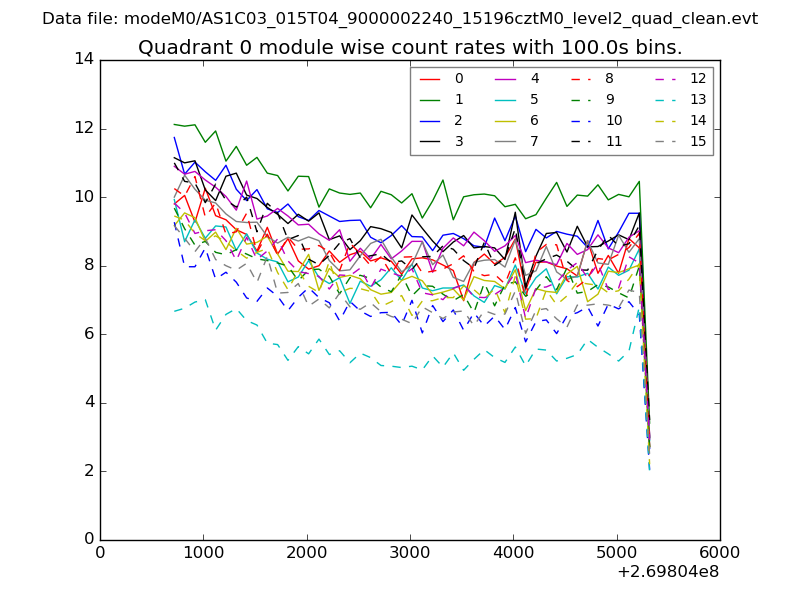 |
 |
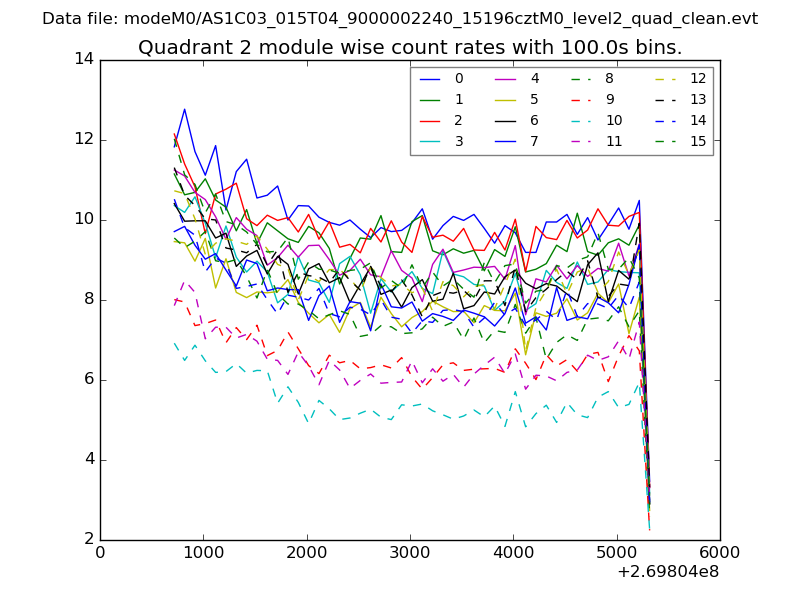
| Module-wise count rates for Quadrant B Data is divided into 100 sec bins |
 |
 |
| Module-wise count rates for Quadrant C Data is divided into 100 sec bins |
 |
 |
| Module-wise count rates for Quadrant D Data is divided into 100 sec bins |
 |
 |
| Parameter | Plot |
|---|---|
| CZT HV Monitor | 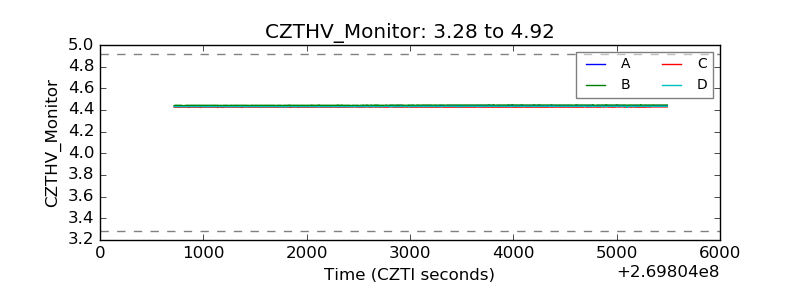 |
| D_VDD | 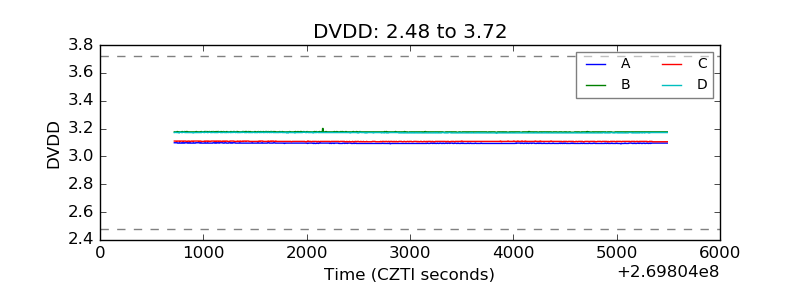 |
| Temperature 1 | 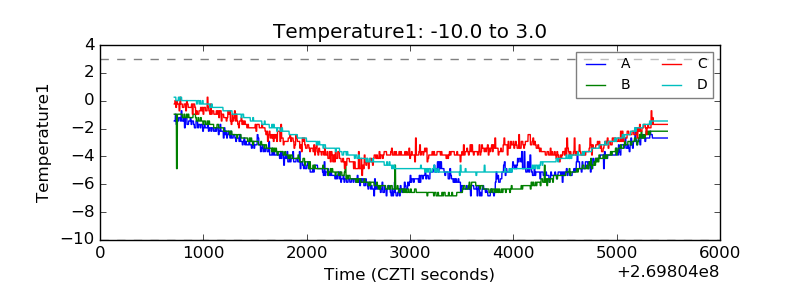 |
| Veto HV Monitor | 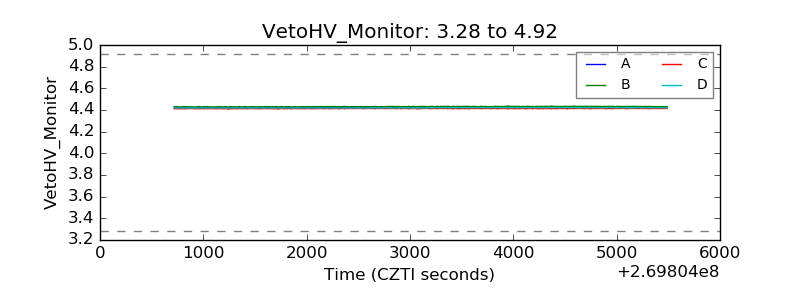 |
| Veto LLD |  |
| Alpha Counter | 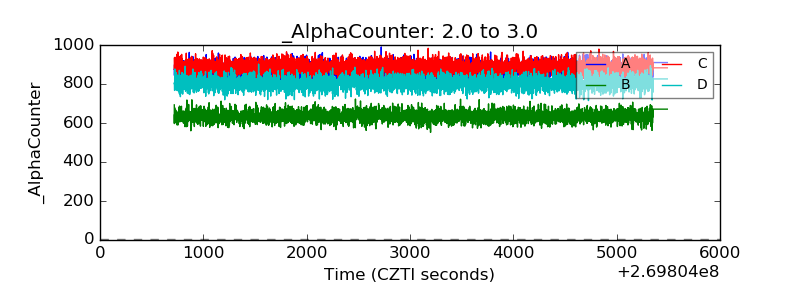 |
| _CPM_Rate | 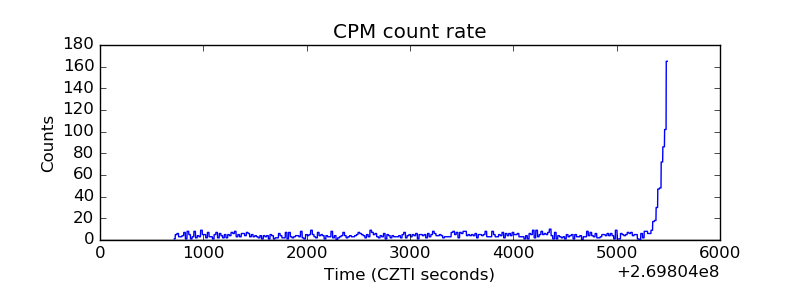 |
| CZT Counter | 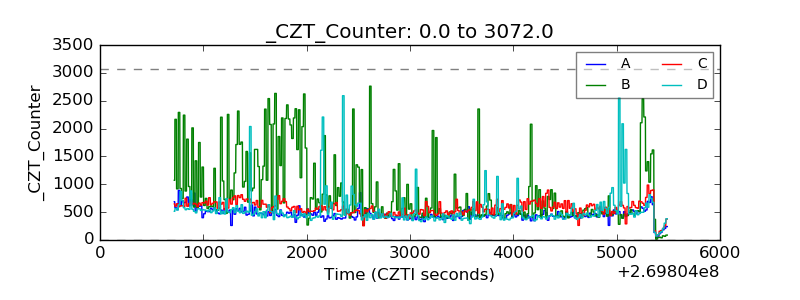 |
| +2.5 Volts monitor |  |
| +5 Volts monitor |  |
| _ROLL_ROT | 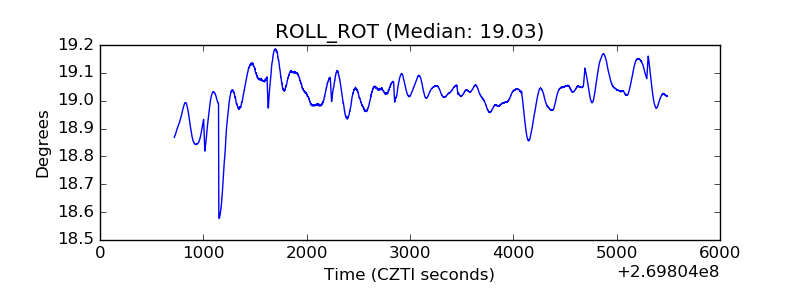 |
| _Roll_DEC | 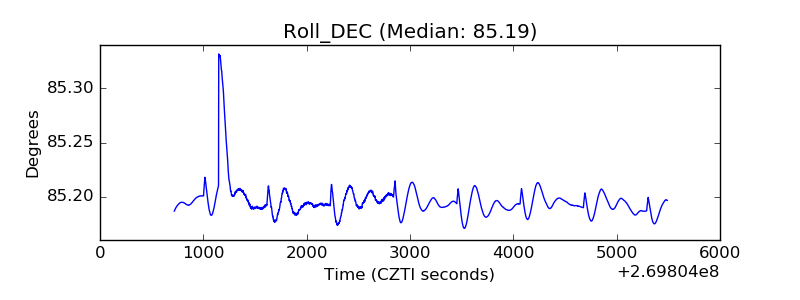 |
| _Roll_RA | 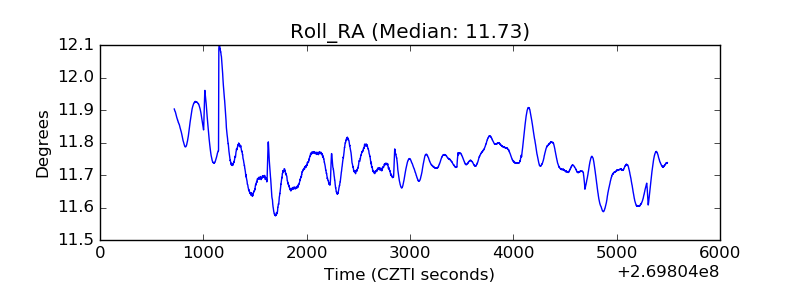 |
| Veto Counter | 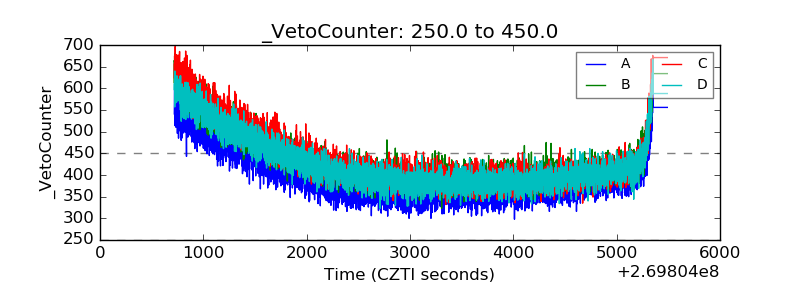 |