| Param | Original file | Final file |
|---|---|---|
| Filename | modeM0/AS1T02_069T01_9000002242cztM0_level2.fits | modeM0/AS1T02_069T01_9000002242cztM0_level2_quad_clean.evt |
| Size (bytes) | 463,538,880 | 394,217,280 |
| Size | 442.1 MB | 376.0 MB |
| Events in quadrant A | 2,864,602 | 2,300,509 |
| Events in quadrant B | 2,647,286 | 2,186,530 |
| Events in quadrant C | 2,752,304 | 2,102,761 |
| Events in quadrant D | 2,426,080 | 2,002,116 |
| Mode M0 | |||
|---|---|---|---|
| Quadrant | BADHDUFLAG | Total packets | Discarded packets |
| A | 0 | 102594 | 0 |
| B | 0 | 134703 | 0 |
| C | 0 | 118799 | 0 |
| D | 0 | 107464 | 0 |
| Mode SS | |||
|---|---|---|---|
| Quadrant | BADHDUFLAG | Total packets | Discarded packets |
| A | 0 | 996 | 0 |
| B | 0 | 996 | 0 |
| C | 0 | 996 | 0 |
| D | 0 | 996 | 0 |
| Mode M9 | |||
|---|---|---|---|
| Quadrant | BADHDUFLAG | Total packets | Discarded packets |
| A | 0 | 63 | 0 |
| B | 0 | 63 | 0 |
| C | 0 | 63 | 0 |
| D | 0 | 64 | 0 |
| Quadrant | Total seconds | Saturated seconds | Saturation percentage |
|---|---|---|---|
| A | 48732 | 747 | 1.532874% |
| B | 48732 | 4085 | 8.382582% |
| C | 48732 | 2245 | 4.606829% |
| D | 48732 | 932 | 1.912501% |
Noise dominated data is calculated using 1-second bins in cleaned event files. If a bin has >2000 counts, and if more than 50% of those come from <1% of pixels, then it is considered to be noise-dominated and hence unusable.
| Quadrant | # 1 sec bins | Bins with >0 counts | Bins with >2000 counts | High rate bins dominated by noise | Noise dominated (total time) | Noise dominated (detector-on time) | Marked lightcurve |
|---|---|---|---|---|---|---|---|
| A | 59365 | 48709 | 0 | 0 | 0.00% | 0.00% |  |
| B | 59365 | 48596 | 0 | 0 | 0.00% | 0.00% |  |
| C | 59365 | 48683 | 0 | 0 | 0.00% | 0.00% |  |
| D | 59365 | 48702 | 0 | 0 | 0.00% | 0.00% |  |
Top three noisy pixels from each quadrant. If the there are fewer than three noisy pixels in the level2.evt file, extra rows are filled as -1
| Pixel properties | Quadrant properties | ||||||
|---|---|---|---|---|---|---|---|
| Quadrant | DetID | PixID | Counts | Sigma | Mean | Median | Sigma |
| A | 0 | 29 | 2763 | 11.13 | 744 | 696 | 185.8 |
| A | 7 | 110 | 2311 | 8.69 | 744 | 696 | 185.8 |
| A | 15 | 236 | 2183 | 8.01 | 744 | 696 | 185.8 |
| B | 2 | 9 | 2273 | 11.77 | 699 | 666 | 136.6 |
| B | 3 | 17 | 1761 | 8.02 | 699 | 666 | 136.6 |
| B | 5 | 225 | 1737 | 7.84 | 699 | 666 | 136.6 |
| C | 12 | 241 | 1900 | 6.48 | 727 | 676 | 188.9 |
| C | 2 | 191 | 1896 | 6.46 | 727 | 676 | 188.9 |
| C | 7 | 111 | 1778 | 5.83 | 727 | 676 | 188.9 |
| D | 6 | 231 | 1781 | 6.05 | 693 | 629 | 190.4 |
| D | 3 | 14 | 1743 | 5.85 | 693 | 629 | 190.4 |
| D | 3 | 31 | 1732 | 5.79 | 693 | 629 | 190.4 |
Histogram calculated using DETX and DETY for each event in the final _common_clean file
| Quadrant A |  |
 |
Quadrant B |
|---|---|---|---|
| Quadrant D | 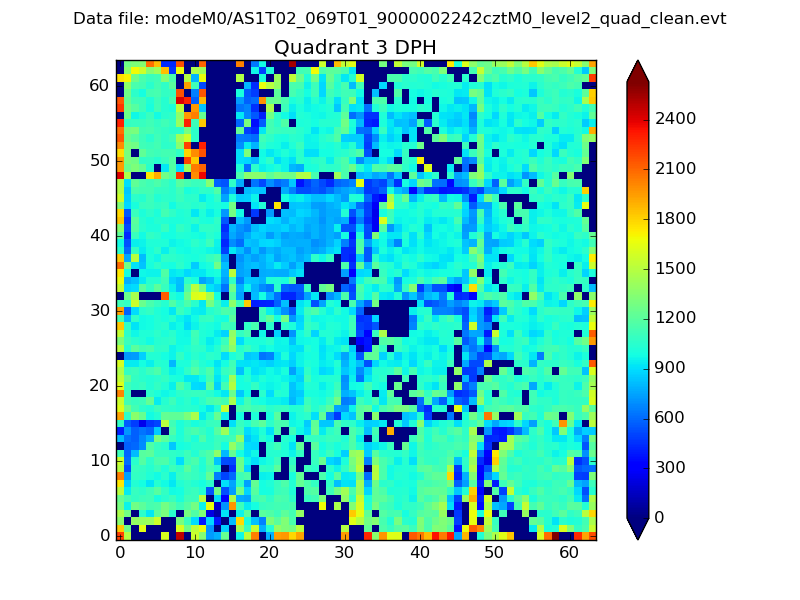 |
 |
Quadrant C |
| Plot type | Count rate plots | Images |
|---|---|---|
| Comparison with Poisson distribution Blue bars denote a histogram of data divided into 1 sec bins. Red curve is a Poisson curve with rate = median count rate of data. |
 |
 |
| Quadrant-wise count rates Data is divided into 100 sec bins |
 |
|
| Module-wise count rates for Quadrant A Data is divided into 100 sec bins |
 |
 |
| Module-wise count rates for Quadrant B Data is divided into 100 sec bins |
 |
 |
| Module-wise count rates for Quadrant C Data is divided into 100 sec bins |
 |
 |
| Module-wise count rates for Quadrant D Data is divided into 100 sec bins |
 |
 |
| Parameter | Plot |
|---|---|
| CZT HV Monitor |  |
| D_VDD | 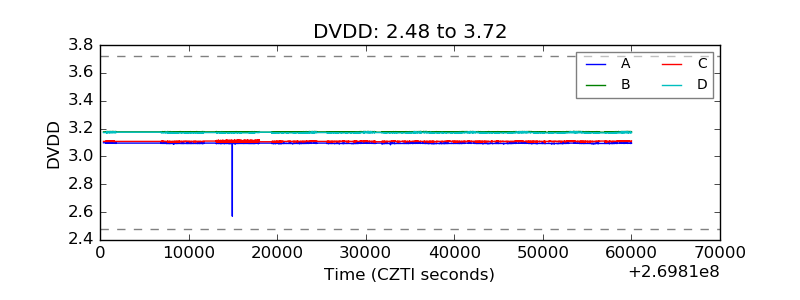 |
| Temperature 1 |  |
| Veto HV Monitor |  |
| Veto LLD |  |
| Alpha Counter |  |
| _CPM_Rate |  |
| CZT Counter |  |
| +2.5 Volts monitor |  |
| +5 Volts monitor |  |
| _ROLL_ROT |  |
| _Roll_DEC |  |
| _Roll_RA |  |
| Veto Counter | 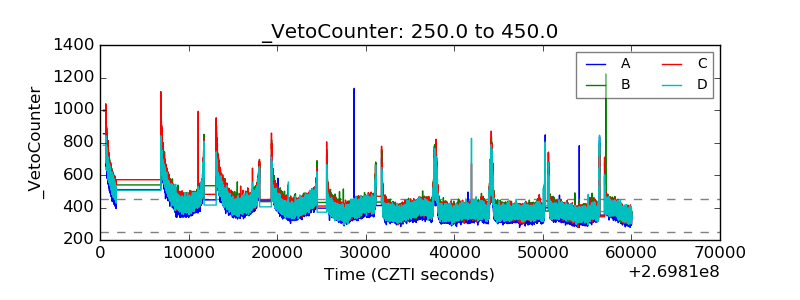 |