| Param | Original file | Final file |
|---|---|---|
| Filename | modeM0/AS1T02_069T01_9000002242_15196cztM0_level2.evt | modeM0/AS1T02_069T01_9000002242_15196cztM0_level2_quad_clean.evt |
| Size (bytes) | 127,123,200 | 27,544,320 |
| Size | 121.2 MB | 26.3 MB |
| Events in quadrant A | 647,340 | 194,089 |
| Events in quadrant B | 1,534,555 | 165,789 |
| Events in quadrant C | 845,908 | 196,806 |
| Events in quadrant D | 738,084 | 186,465 |
| Mode M0 | |||
|---|---|---|---|
| Quadrant | BADHDUFLAG | Total packets | Discarded packets |
| A | 0 | 2638 | 2 |
| B | 0 | 5445 | 1 |
| C | 0 | 3425 | 1 |
| D | 0 | 2959 | 1 |
| Mode SS | |||
|---|---|---|---|
| Quadrant | BADHDUFLAG | Total packets | Discarded packets |
| A | 0 | 24 | 0 |
| B | 0 | 24 | 0 |
| C | 0 | 24 | 0 |
| D | 0 | 24 | 0 |
| Mode M9 | |||
|---|---|---|---|
| Quadrant | BADHDUFLAG | Total packets | Discarded packets |
| A | 0 | 3 | 0 |
| B | 0 | 3 | 0 |
| C | 0 | 3 | 0 |
| D | 0 | 3 | 0 |
| Quadrant | Total seconds | Saturated seconds | Saturation percentage |
|---|---|---|---|
| A | 1196 | 2 | 0.167224% |
| B | 1196 | 377 | 31.521739% |
| C | 1196 | 15 | 1.254181% |
| D | 1196 | 15 | 1.254181% |
Noise dominated data is calculated using 1-second bins in cleaned event files. If a bin has >2000 counts, and if more than 50% of those come from <1% of pixels, then it is considered to be noise-dominated and hence unusable.
| Quadrant | # 1 sec bins | Bins with >0 counts | Bins with >2000 counts | High rate bins dominated by noise | Noise dominated (total time) | Noise dominated (detector-on time) | Marked lightcurve |
|---|---|---|---|---|---|---|---|
| A | 1197 | 1197 | 0 | 0 | 0.00% | 0.00% | 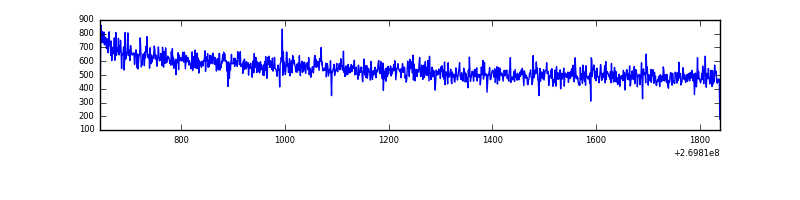 |
| B | 1197 | 1197 | 267 | 267 | 22.31% | 22.31% | 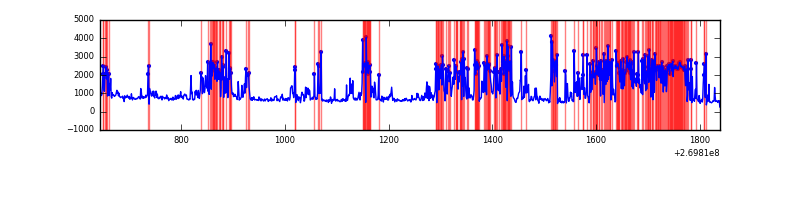 |
| C | 1197 | 1197 | 0 | 0 | 0.00% | 0.00% | 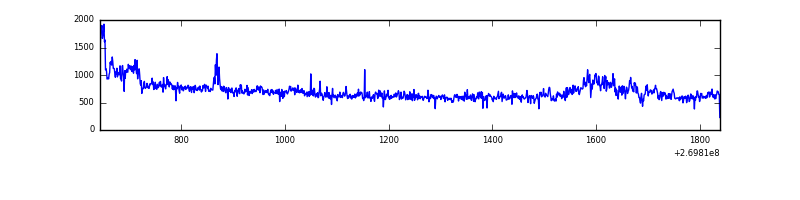 |
| D | 1197 | 1197 | 11 | 11 | 0.92% | 0.92% | 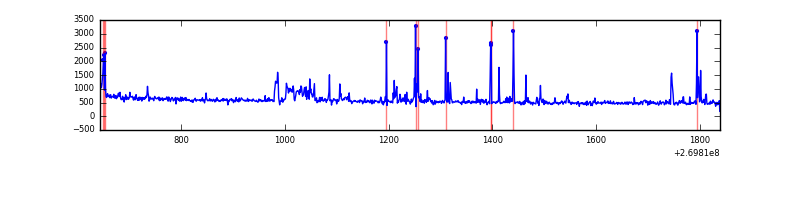 |
Top three noisy pixels from each quadrant. If the there are fewer than three noisy pixels in the level2.evt file, extra rows are filled as -1
| Pixel properties | Quadrant properties | ||||||
|---|---|---|---|---|---|---|---|
| Quadrant | DetID | PixID | Counts | Sigma | Mean | Median | Sigma |
| A | 12 | 189 | 4415 | 121.24 | 166 | 163 | 35.1 |
| A | 0 | 226 | 1536 | 39.15 | 166 | 163 | 35.1 |
| A | 12 | 194 | 1277 | 31.76 | 166 | 163 | 35.1 |
| B | 3 | 112 | 827293 | 29616.6 | 143 | 140 | 27.9 |
| B | 3 | 64 | 41729 | 1489.11 | 143 | 140 | 27.9 |
| B | 0 | 189 | 26119 | 930.19 | 143 | 140 | 27.9 |
| C | 3 | 233 | 183352 | 4576.33 | 168 | 169 | 40.0 |
| C | 0 | 207 | 5004 | 120.79 | 168 | 169 | 40.0 |
| C | 7 | 247 | 2005 | 45.87 | 168 | 169 | 40.0 |
| D | 7 | 38 | 42752 | 1037.64 | 166 | 161 | 41.0 |
| D | 9 | 68 | 25943 | 628.13 | 166 | 161 | 41.0 |
| D | 7 | 55 | 13422 | 323.08 | 166 | 161 | 41.0 |
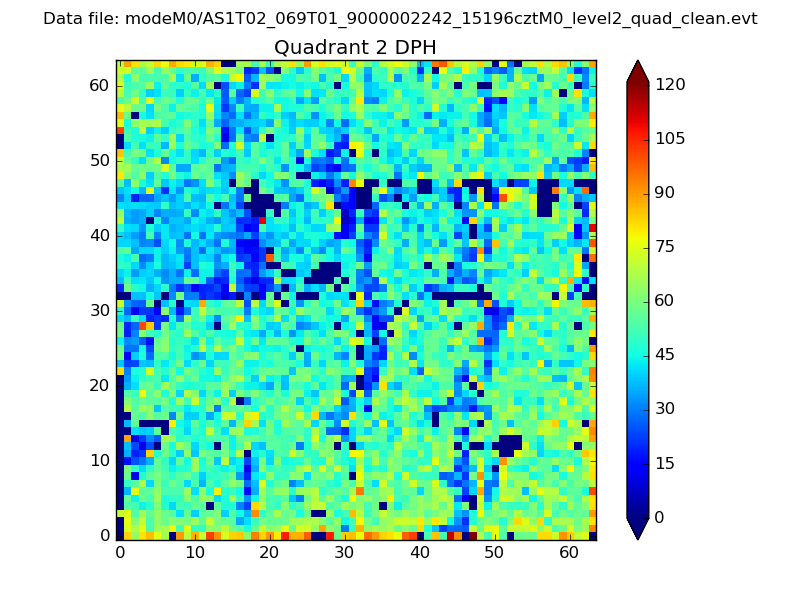
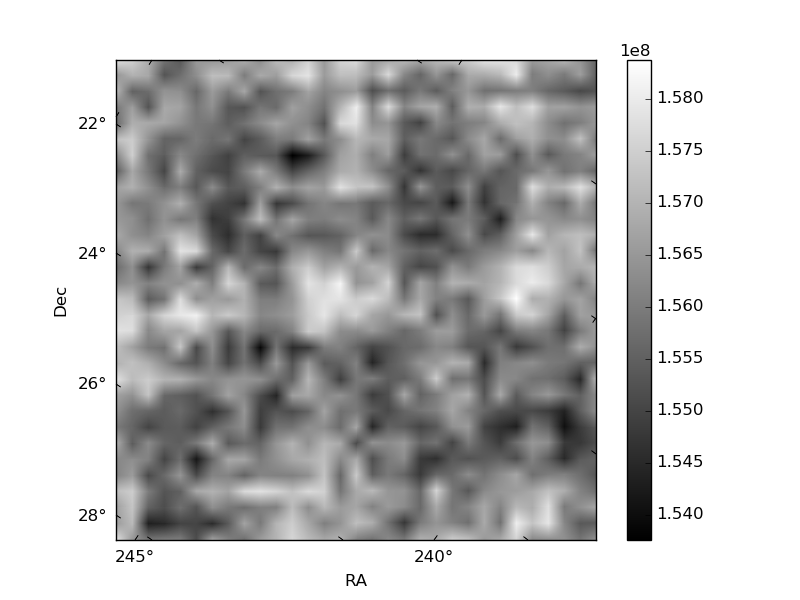
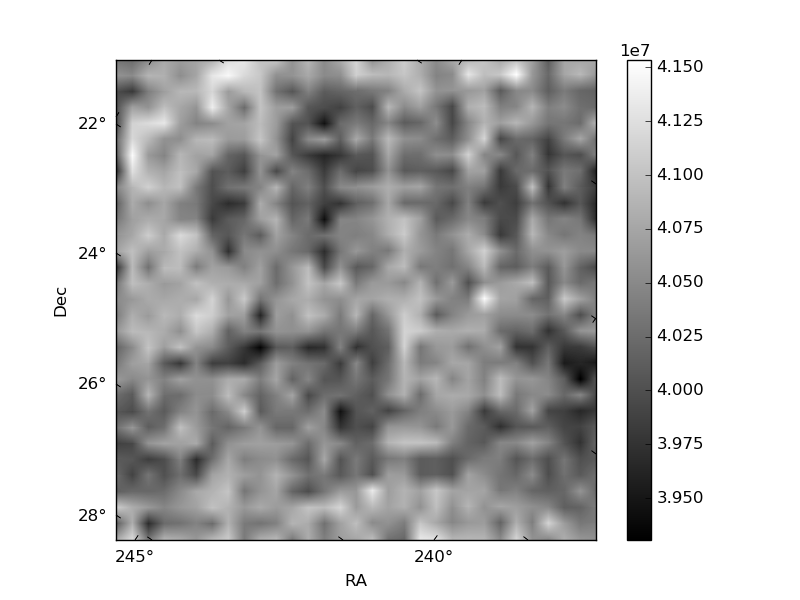
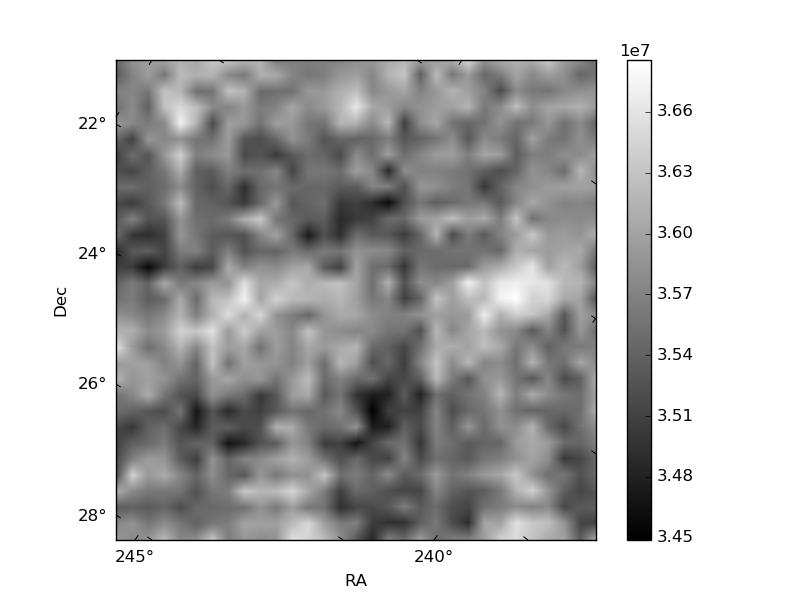
Histogram calculated using DETX and DETY for each event in the final _common_clean file
| Quadrant A | 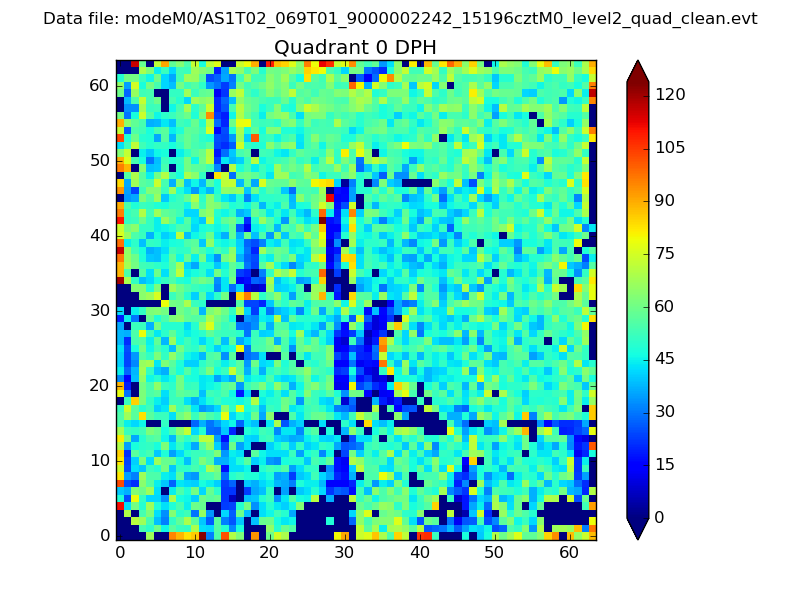 |
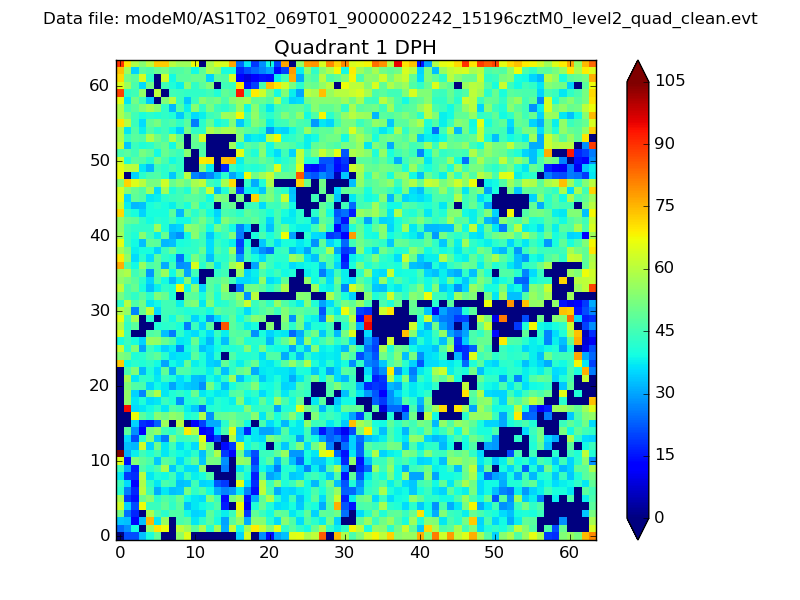 |
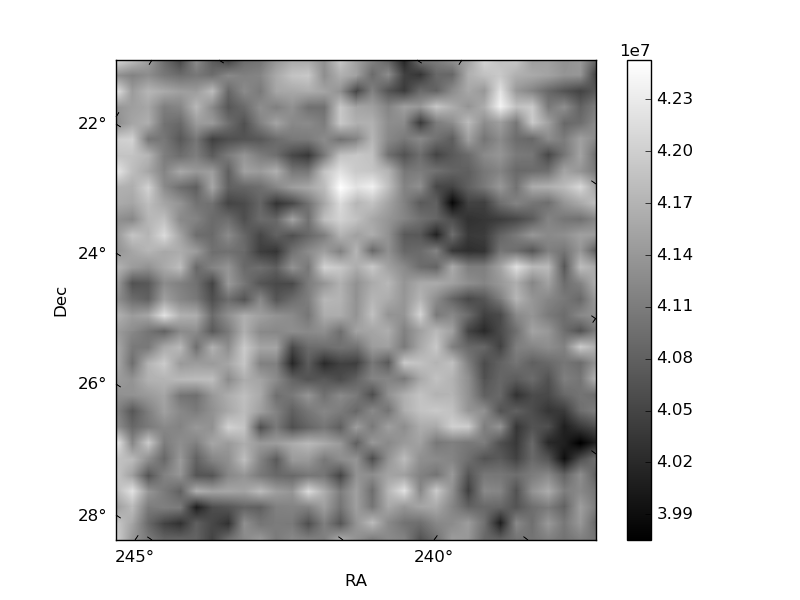
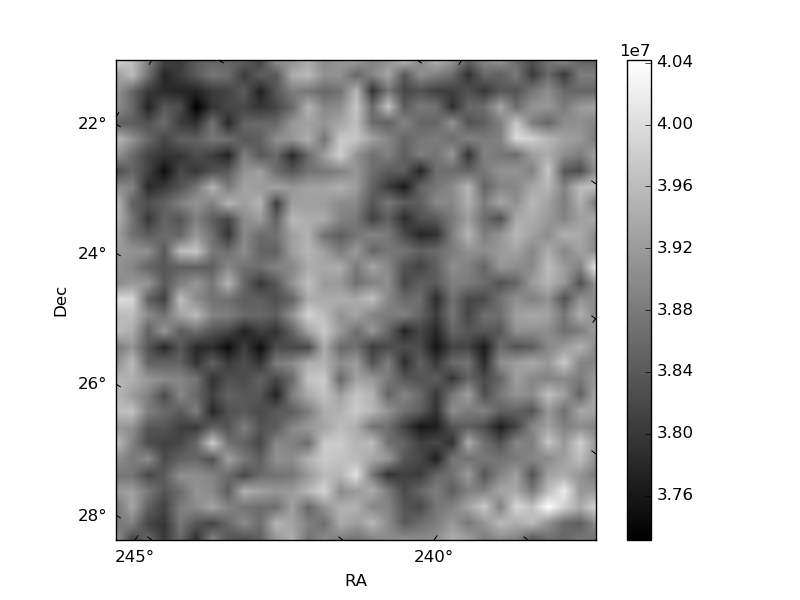
Quadrant B |
|---|---|---|---|
| Quadrant D | 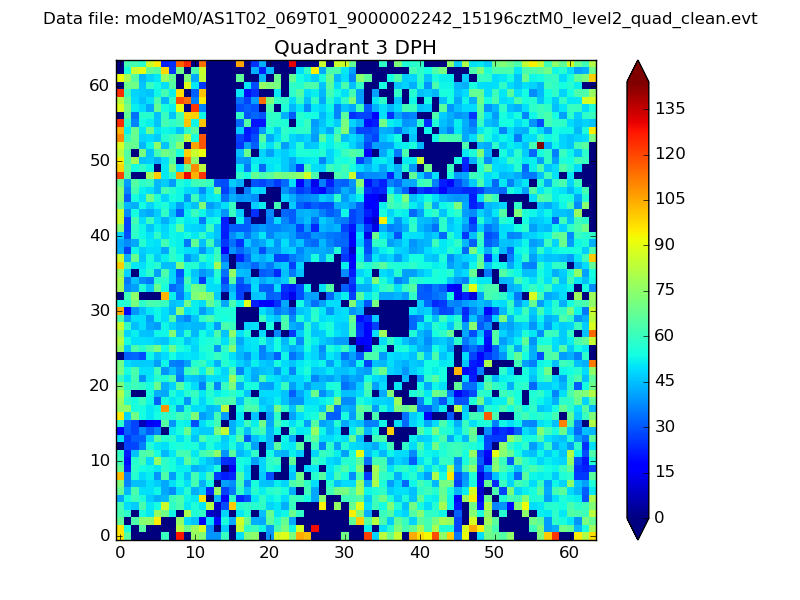 |
 |
Quadrant C |
| Plot type | Count rate plots | Images |
|---|---|---|
| Comparison with Poisson distribution Blue bars denote a histogram of data divided into 1 sec bins. Red curve is a Poisson curve with rate = median count rate of data. |
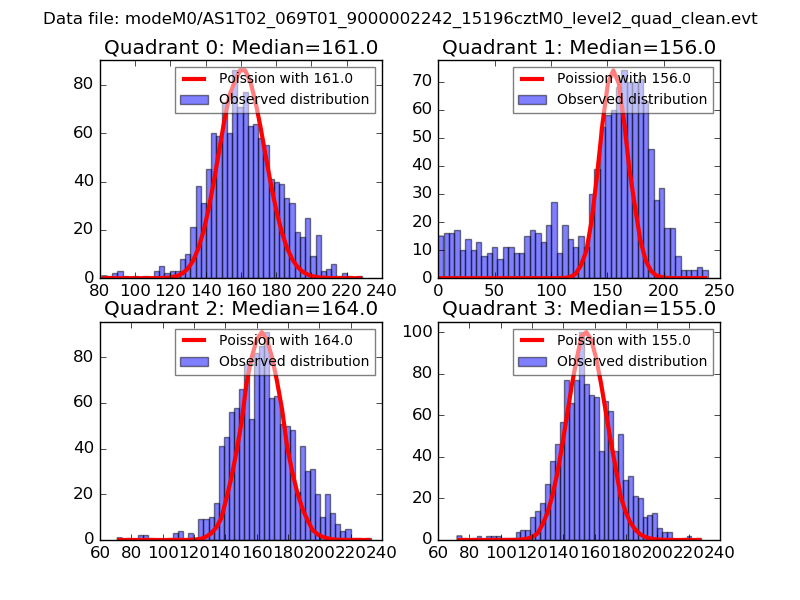 |
 |
| Quadrant-wise count rates Data is divided into 100 sec bins |
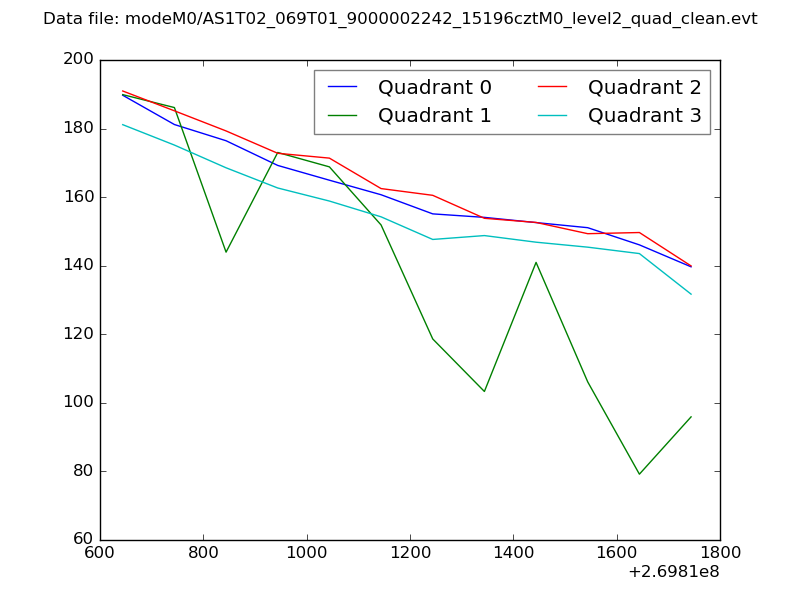 |
|
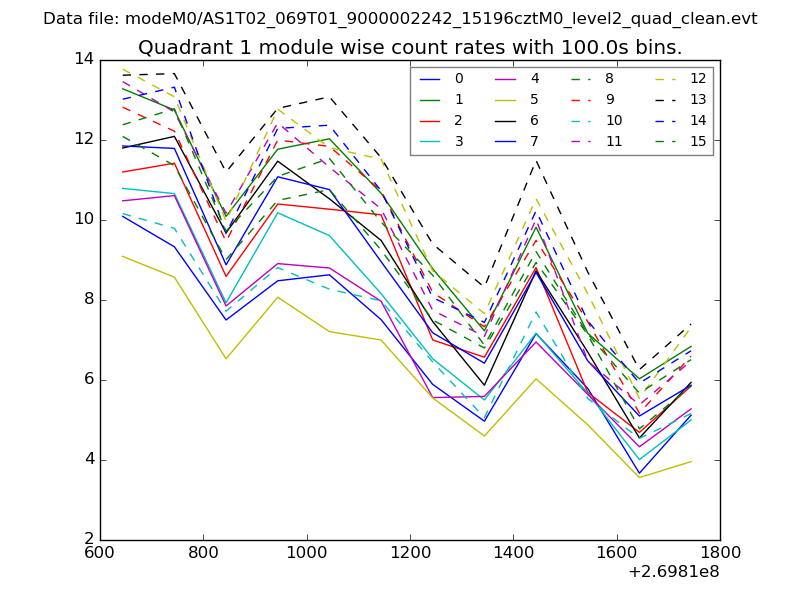
| Module-wise count rates for Quadrant A Data is divided into 100 sec bins |
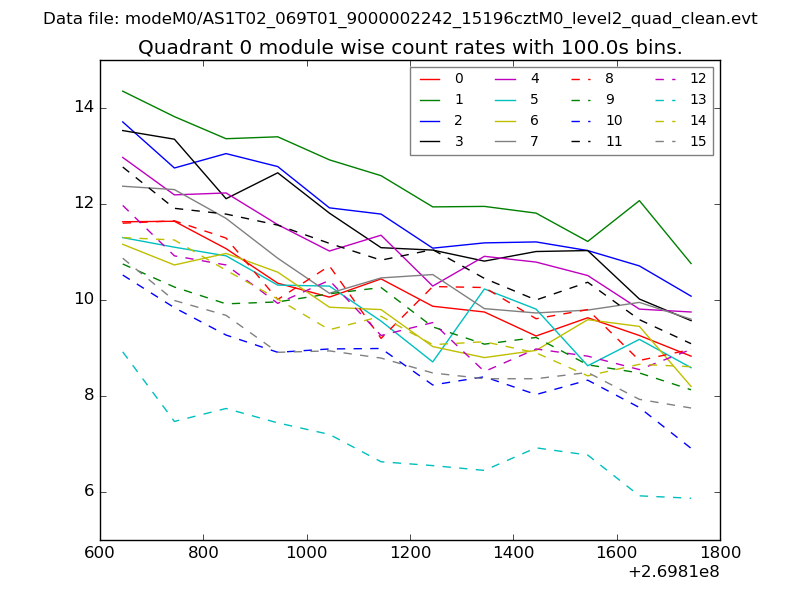 |
 |
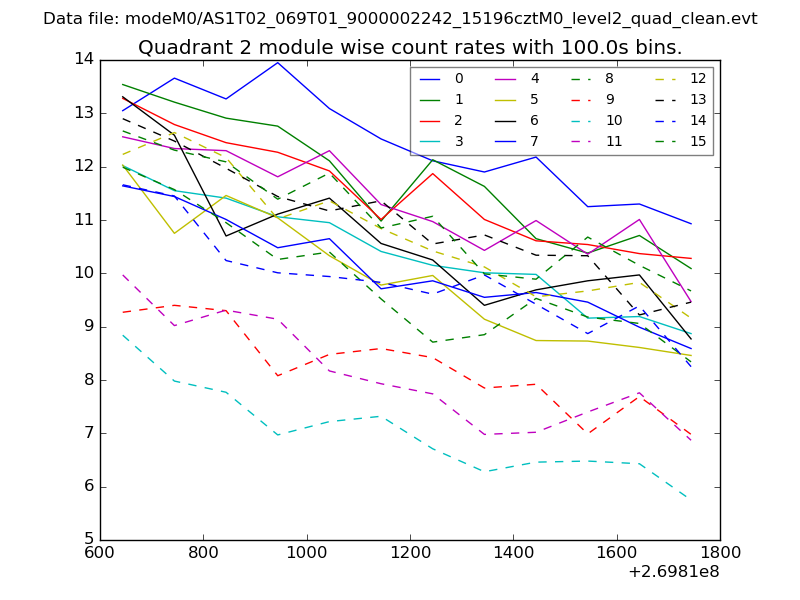
| Module-wise count rates for Quadrant B Data is divided into 100 sec bins |
 |
 |
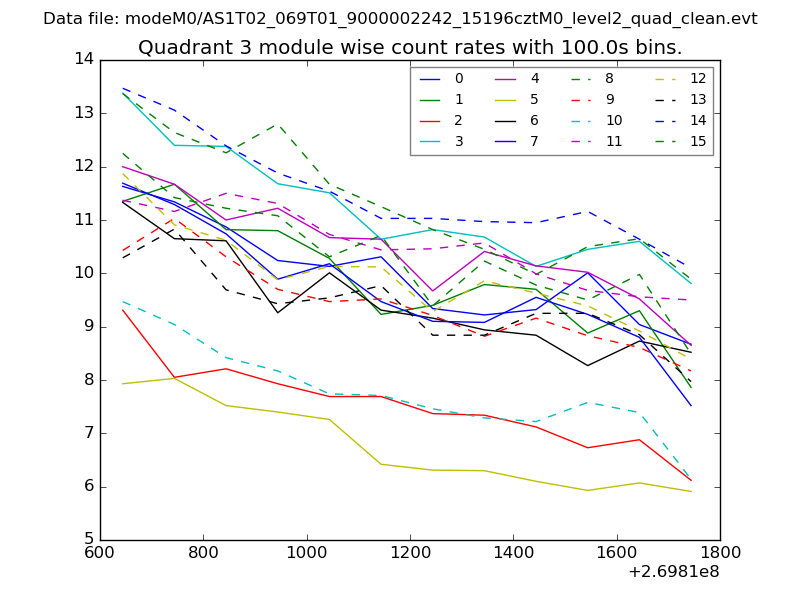
| Module-wise count rates for Quadrant C Data is divided into 100 sec bins |
 |
 |
| Module-wise count rates for Quadrant D Data is divided into 100 sec bins |
 |
 |
| Parameter | Plot |
|---|---|
| CZT HV Monitor | 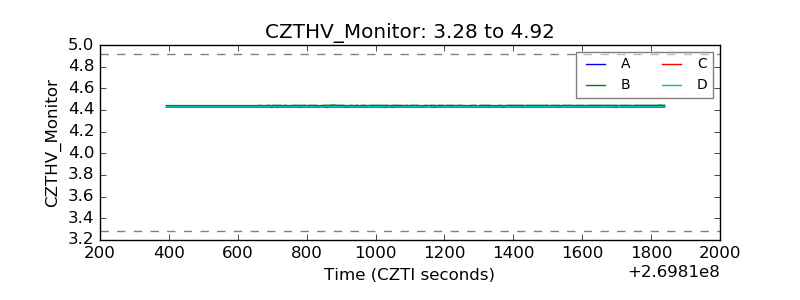 |
| D_VDD | 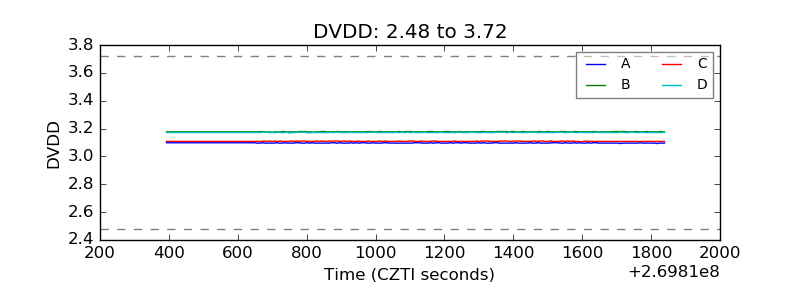 |
| Temperature 1 | 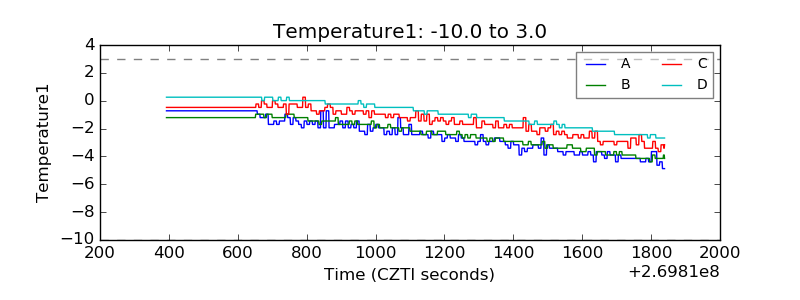 |
| Veto HV Monitor | 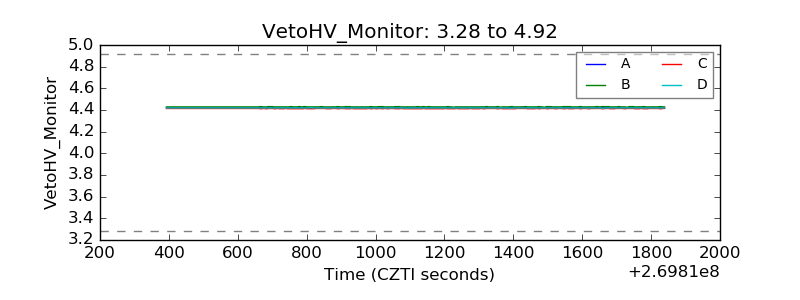 |
| Veto LLD | 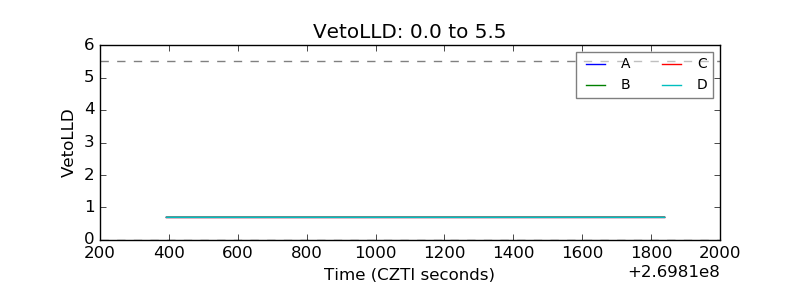 |
| Alpha Counter | 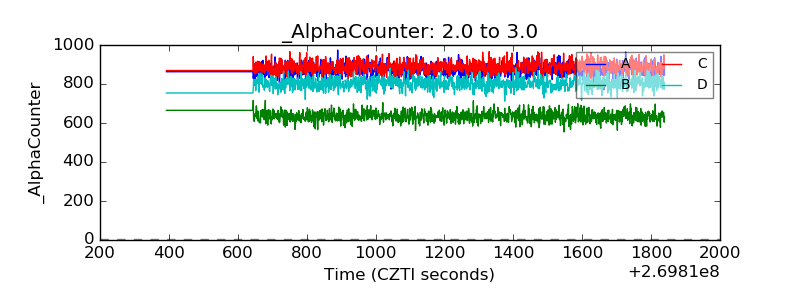 |
| _CPM_Rate | 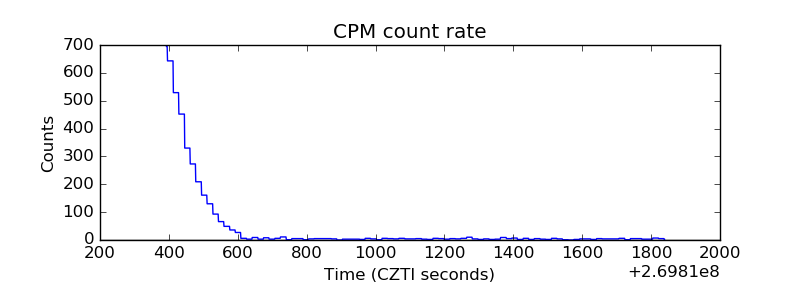 |
| CZT Counter | 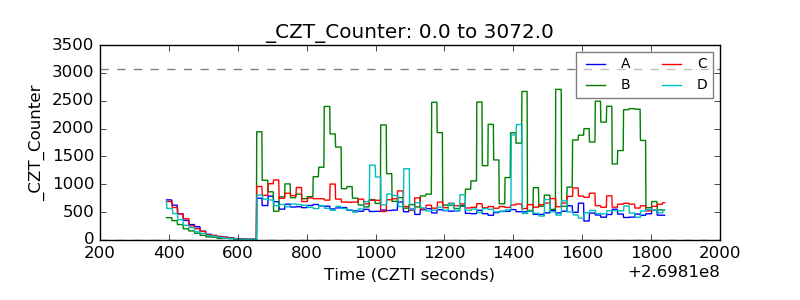 |
| +2.5 Volts monitor | 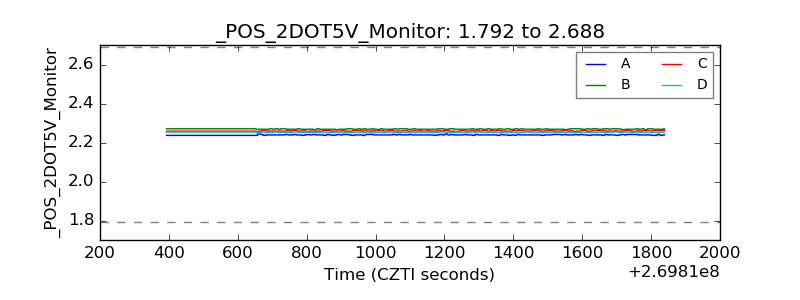 |
| +5 Volts monitor | 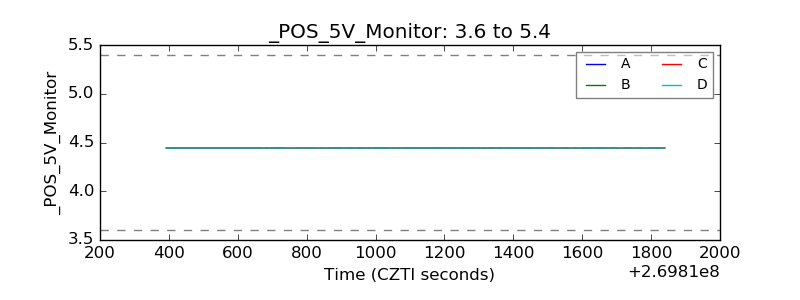 |
| _ROLL_ROT | 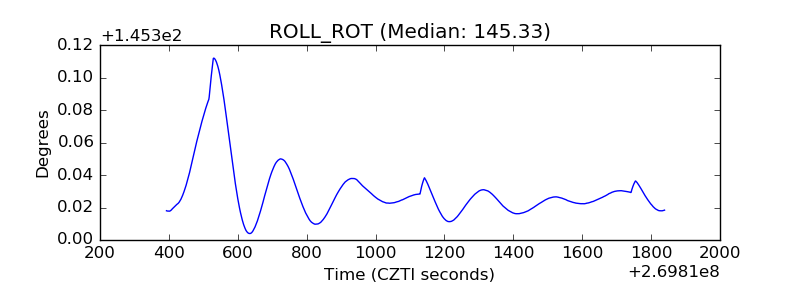 |
| _Roll_DEC | 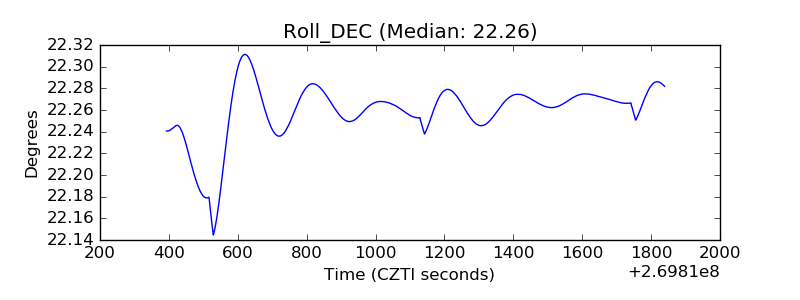 |
| _Roll_RA | 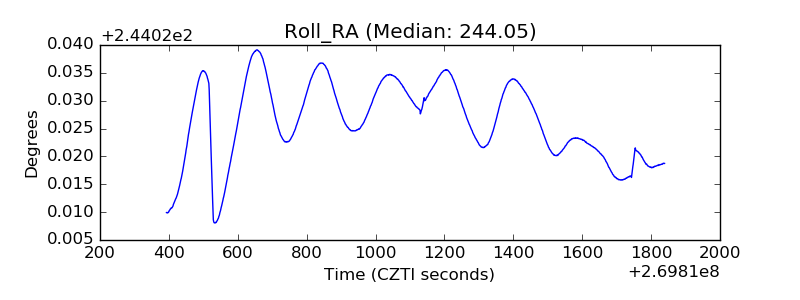 |
| Veto Counter | 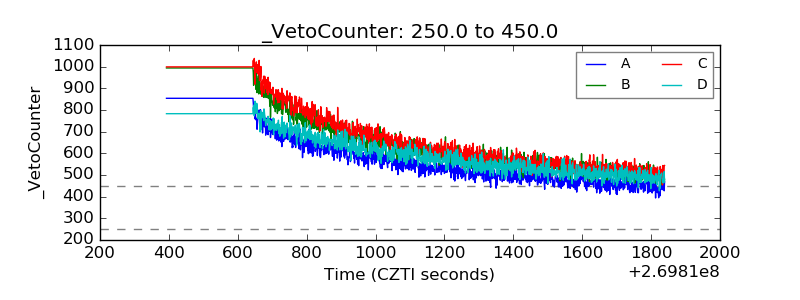 |