| Param | Original file | Final file |
|---|---|---|
| Filename | modeM0/AS1T02_069T01_9000002242_15198cztM0_level2.evt | modeM0/AS1T02_069T01_9000002242_15198cztM0_level2_quad_clean.evt |
| Size (bytes) | 540,590,400 | 91,725,120 |
| Size | 515.5 MB | 87.5 MB |
| Events in quadrant A | 3,160,592 | 610,787 |
| Events in quadrant B | 6,135,083 | 565,569 |
| Events in quadrant C | 3,193,550 | 603,144 |
| Events in quadrant D | 3,462,464 | 565,282 |
| Mode M0 | |||
|---|---|---|---|
| Quadrant | BADHDUFLAG | Total packets | Discarded packets |
| A | 0 | 13205 | 3 |
| B | 0 | 22461 | 2 |
| C | 0 | 13310 | 2 |
| D | 0 | 14538 | 2 |
| Mode SS | |||
|---|---|---|---|
| Quadrant | BADHDUFLAG | Total packets | Discarded packets |
| A | 0 | 126 | 0 |
| B | 0 | 126 | 0 |
| C | 0 | 126 | 0 |
| D | 0 | 126 | 0 |
| Mode M9 | |||
|---|---|---|---|
| Quadrant | BADHDUFLAG | Total packets | Discarded packets |
| A | 0 | 20 | 0 |
| B | 0 | 20 | 0 |
| C | 0 | 20 | 0 |
| D | 0 | 21 | 0 |
| Quadrant | Total seconds | Saturated seconds | Saturation percentage |
|---|---|---|---|
| A | 6198 | 39 | 0.629235% |
| B | 6198 | 934 | 15.069377% |
| C | 6198 | 19 | 0.306551% |
| D | 6198 | 96 | 1.548887% |
Noise dominated data is calculated using 1-second bins in cleaned event files. If a bin has >2000 counts, and if more than 50% of those come from <1% of pixels, then it is considered to be noise-dominated and hence unusable.
| Quadrant | # 1 sec bins | Bins with >0 counts | Bins with >2000 counts | High rate bins dominated by noise | Noise dominated (total time) | Noise dominated (detector-on time) | Marked lightcurve |
|---|---|---|---|---|---|---|---|
| A | 7570 | 6191 | 0 | 0 | 0.00% | 0.00% | 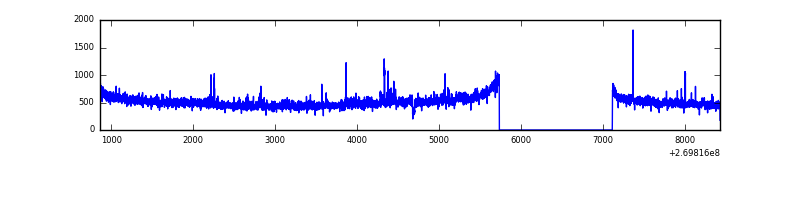 |
| B | 7570 | 6191 | 627 | 627 | 8.28% | 10.13% | 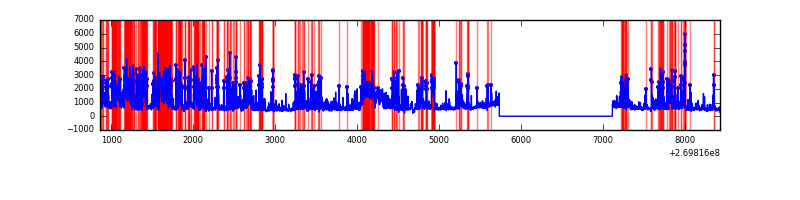 |
| C | 7570 | 6191 | 0 | 0 | 0.00% | 0.00% | 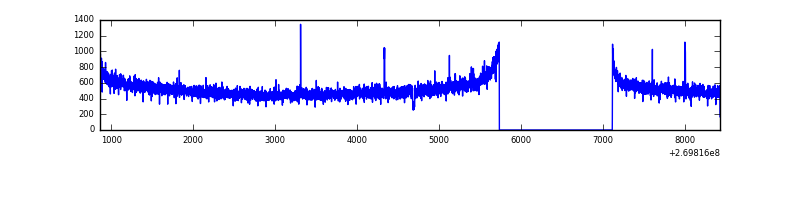 |
| D | 7570 | 6191 | 73 | 73 | 0.96% | 1.18% | 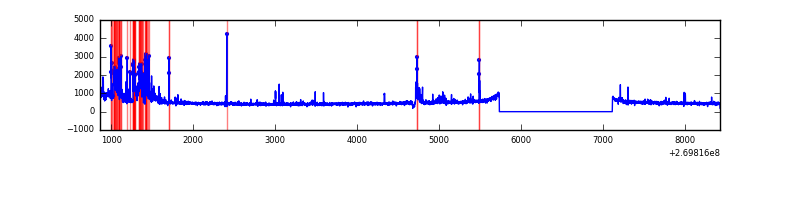 |
Top three noisy pixels from each quadrant. If the there are fewer than three noisy pixels in the level2.evt file, extra rows are filled as -1
| Pixel properties | Quadrant properties | ||||||
|---|---|---|---|---|---|---|---|
| Quadrant | DetID | PixID | Counts | Sigma | Mean | Median | Sigma |
| A | 12 | 189 | 78796 | 487.24 | 799 | 786 | 160.1 |
| A | 9 | 143 | 7550 | 42.25 | 799 | 786 | 160.1 |
| A | 0 | 226 | 7139 | 39.68 | 799 | 786 | 160.1 |
| B | 3 | 112 | 2803124 | 19753.82 | 759 | 743 | 141.9 |
| B | 3 | 64 | 259370 | 1823.05 | 759 | 743 | 141.9 |
| B | 10 | 245 | 39258 | 271.49 | 759 | 743 | 141.9 |
| C | 3 | 233 | 136470 | 759.01 | 780 | 788 | 178.8 |
| C | 7 | 247 | 5773 | 27.89 | 780 | 788 | 178.8 |
| C | 13 | 61 | 5497 | 26.34 | 780 | 788 | 178.8 |
| D | 13 | 172 | 328145 | 1752.3 | 767 | 744 | 186.8 |
| D | 7 | 38 | 109906 | 584.25 | 767 | 744 | 186.8 |
| D | 13 | 104 | 65590 | 347.06 | 767 | 744 | 186.8 |
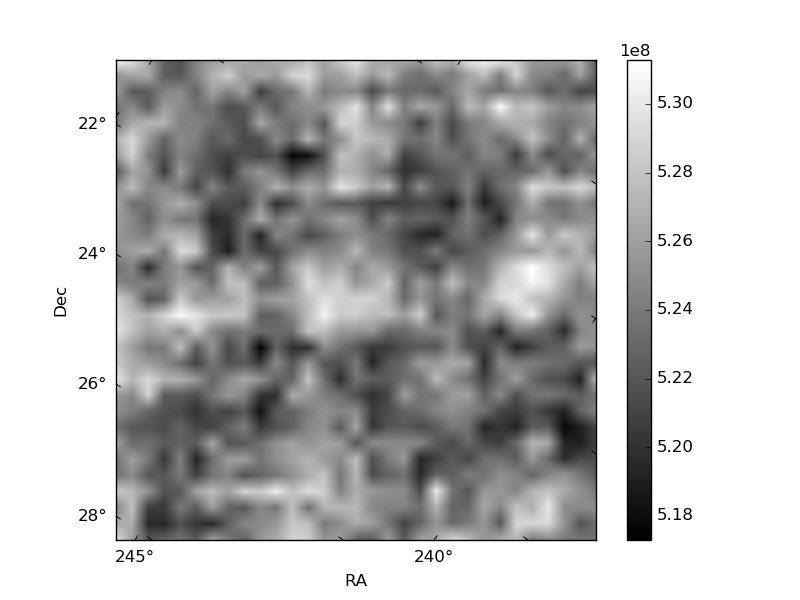
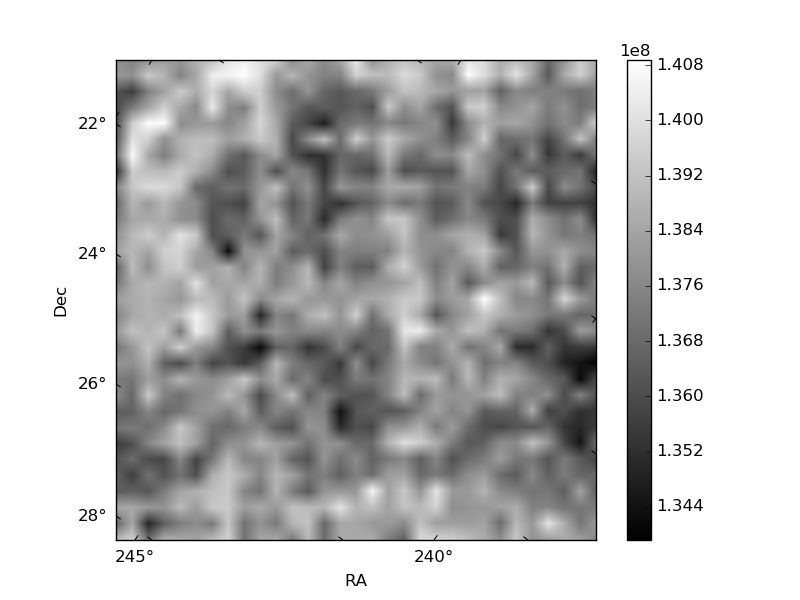
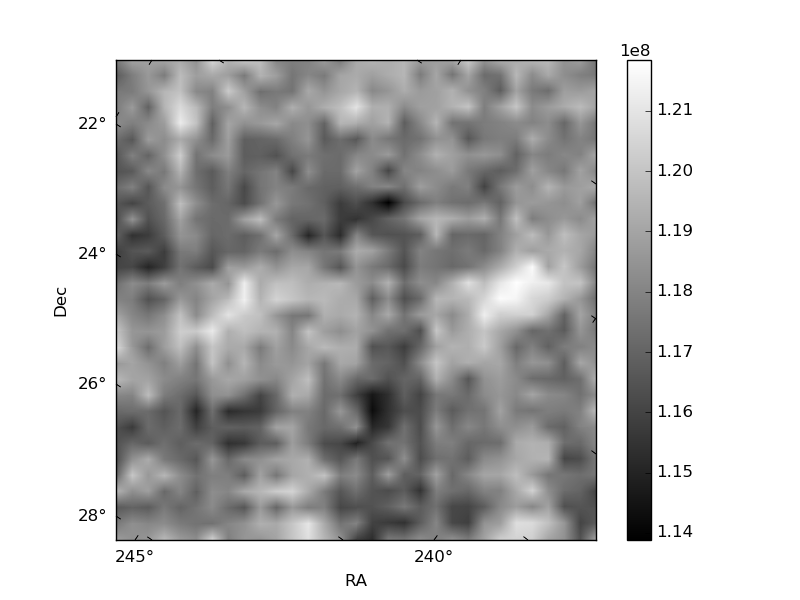
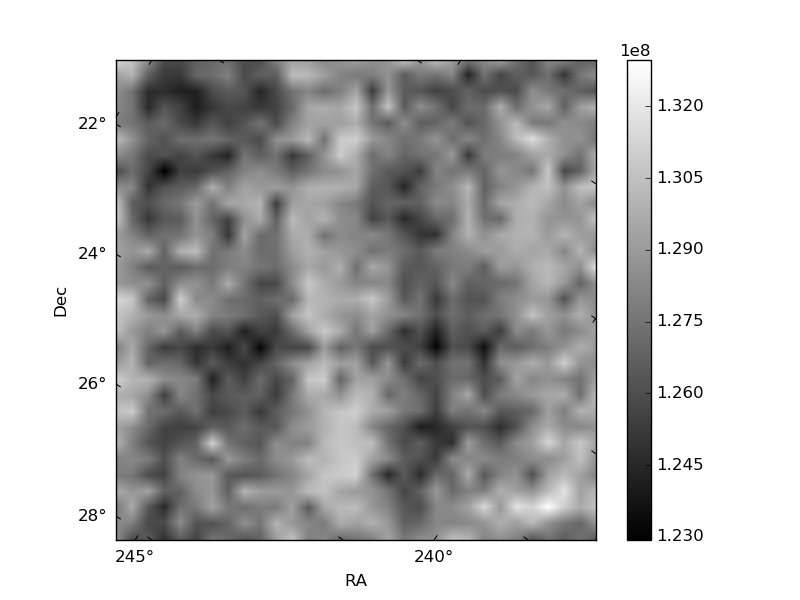
Histogram calculated using DETX and DETY for each event in the final _common_clean file
| Quadrant A | 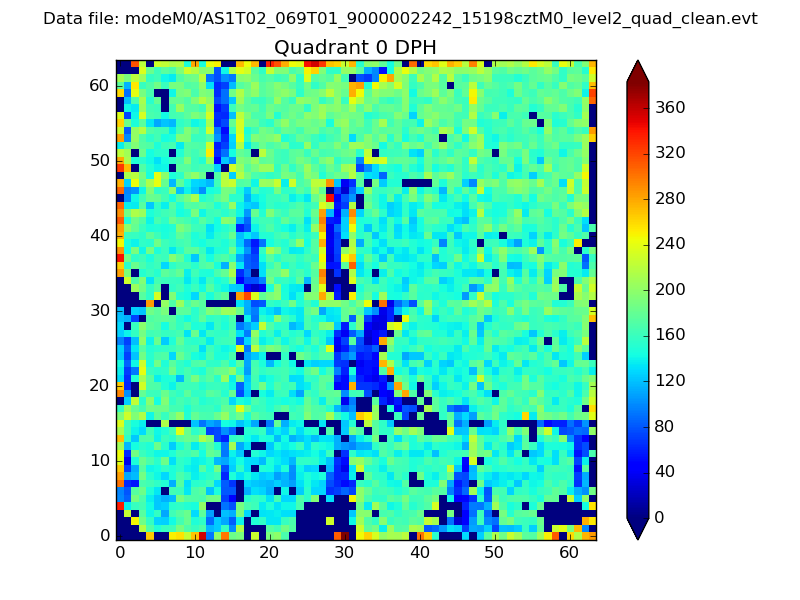 |
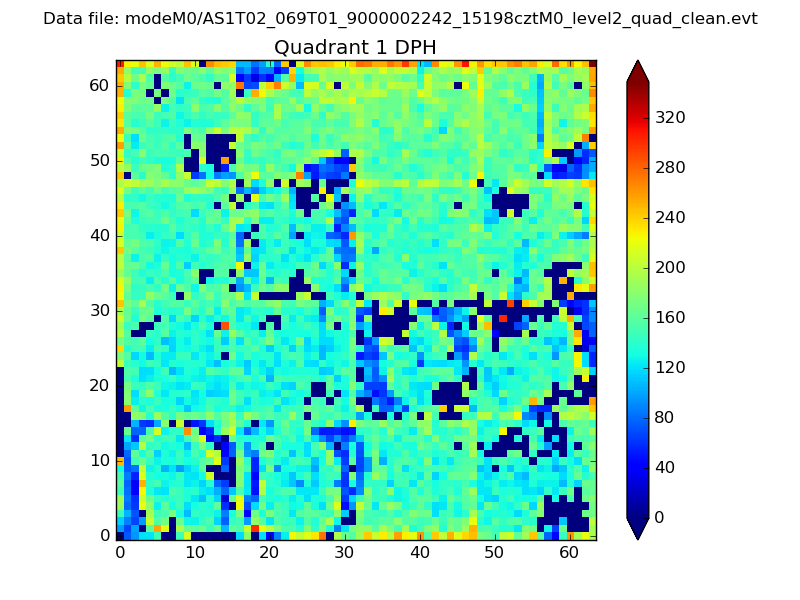 |
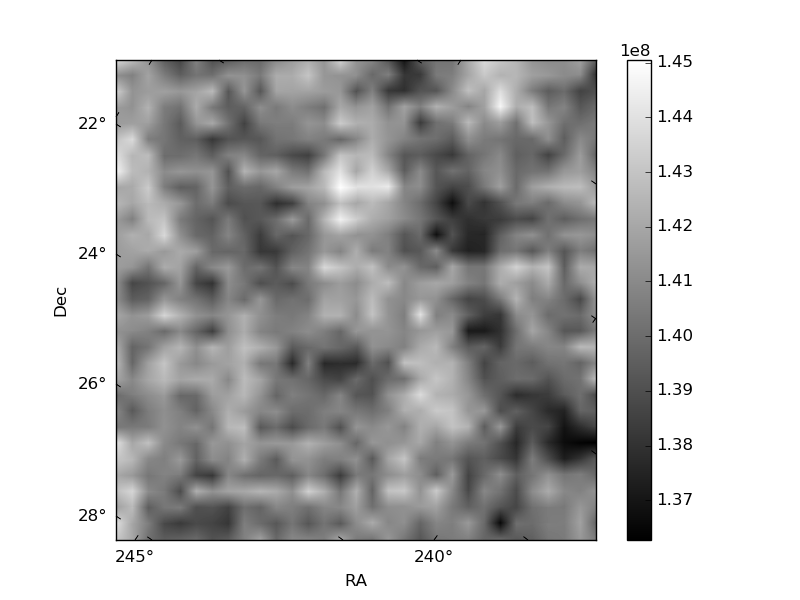
Quadrant B |
|---|---|---|---|
| Quadrant D | 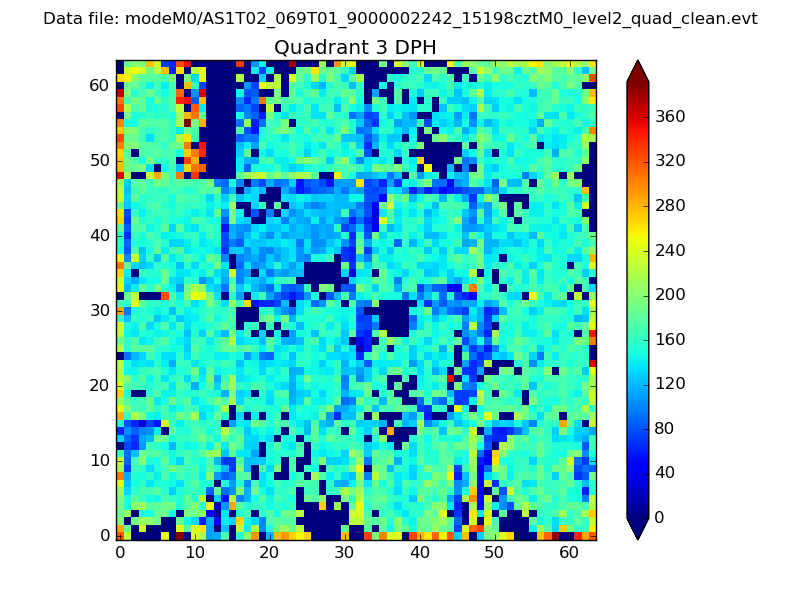 |
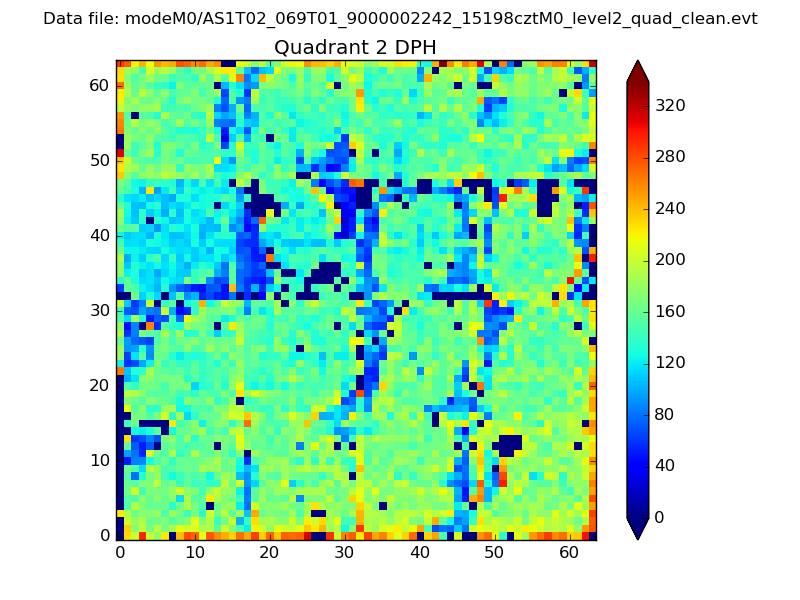 |
Quadrant C |
| Plot type | Count rate plots | Images |
|---|---|---|
| Comparison with Poisson distribution Blue bars denote a histogram of data divided into 1 sec bins. Red curve is a Poisson curve with rate = median count rate of data. |
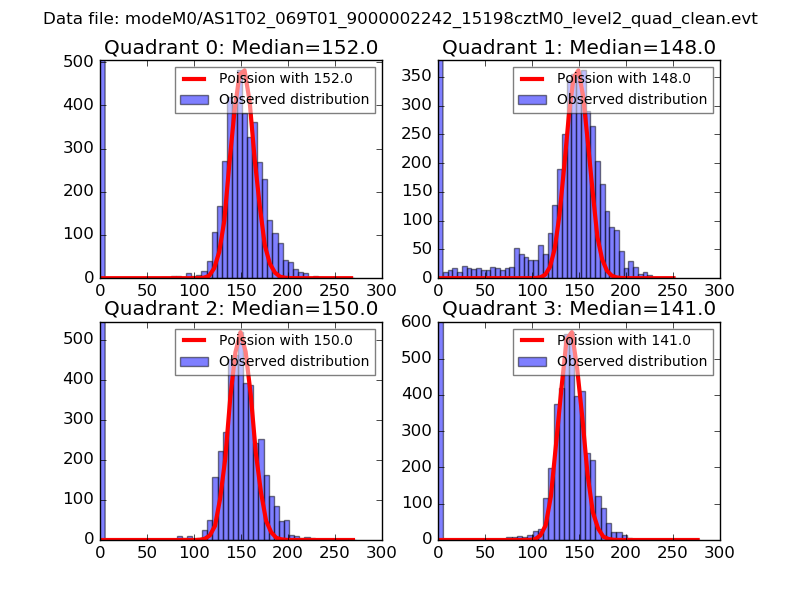 |
 |
| Quadrant-wise count rates Data is divided into 100 sec bins |
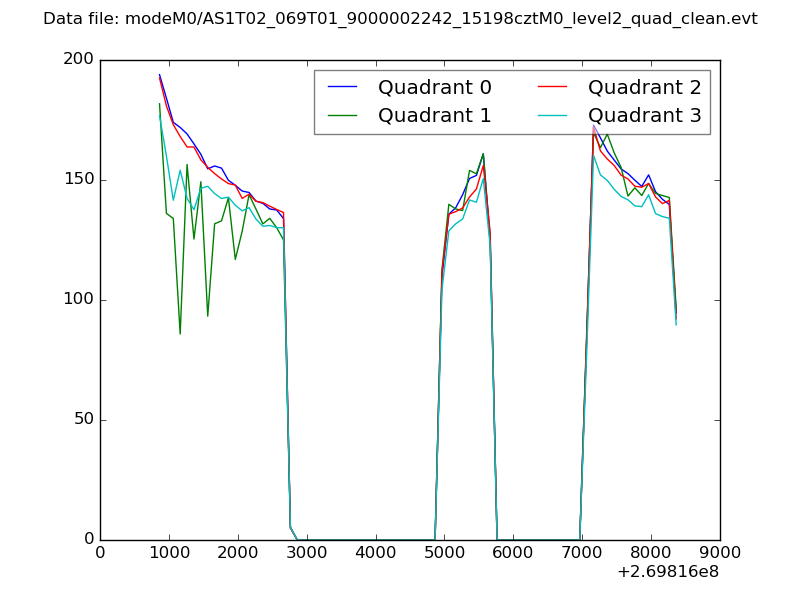 |
|
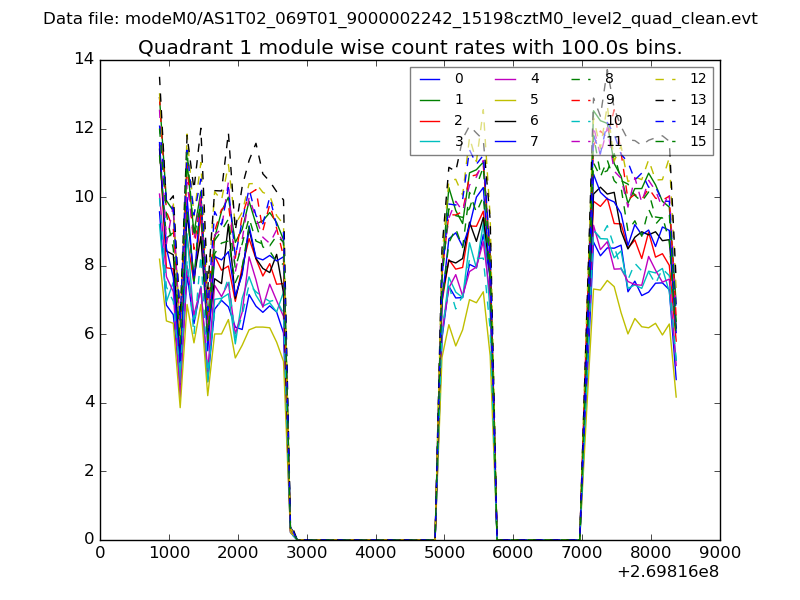
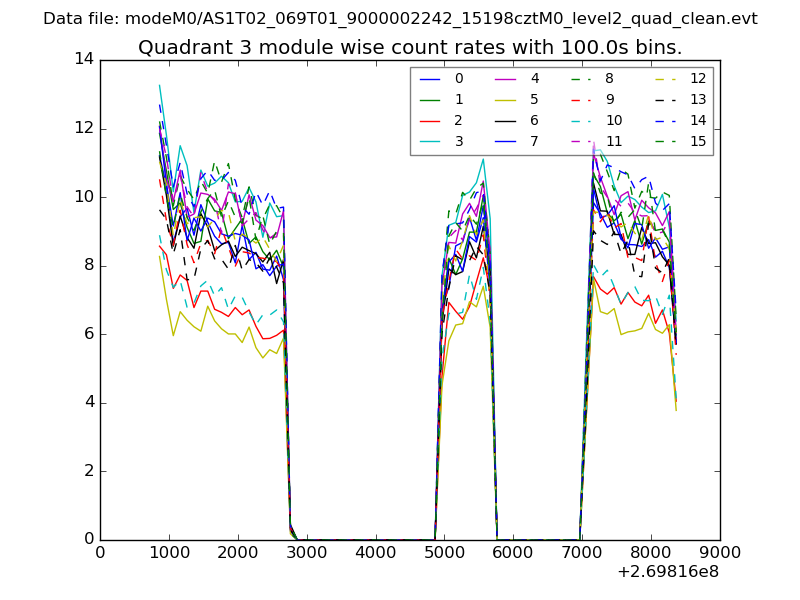
| Module-wise count rates for Quadrant A Data is divided into 100 sec bins |
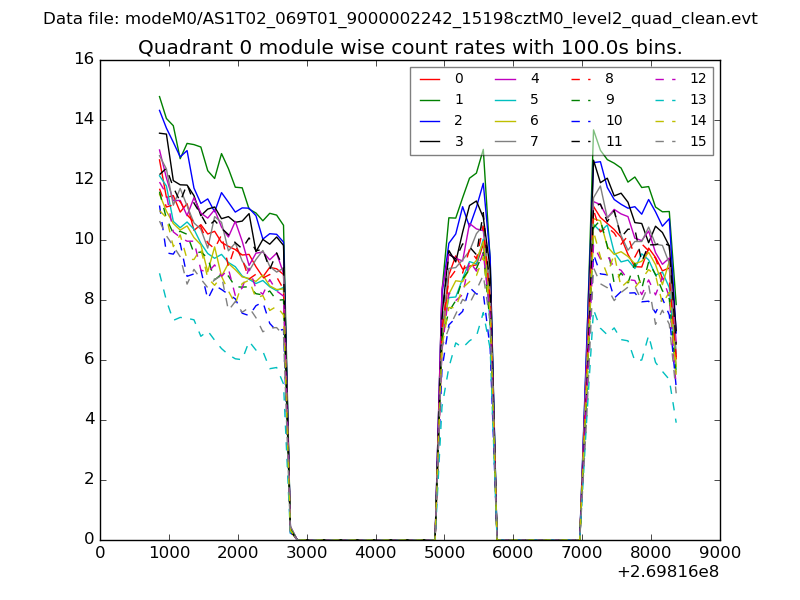 |
 |
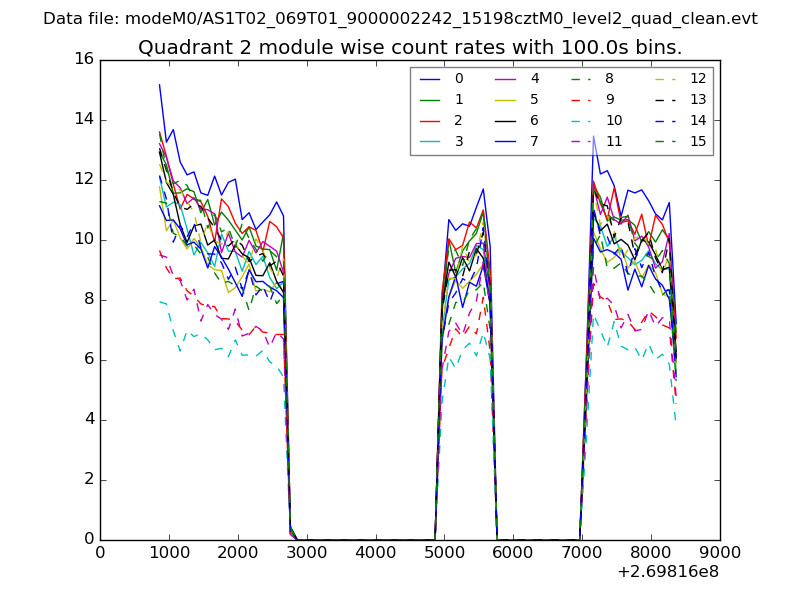
| Module-wise count rates for Quadrant B Data is divided into 100 sec bins |
 |
 |
| Module-wise count rates for Quadrant C Data is divided into 100 sec bins |
 |
 |
| Module-wise count rates for Quadrant D Data is divided into 100 sec bins |
 |
 |
| Parameter | Plot |
|---|---|
| CZT HV Monitor | 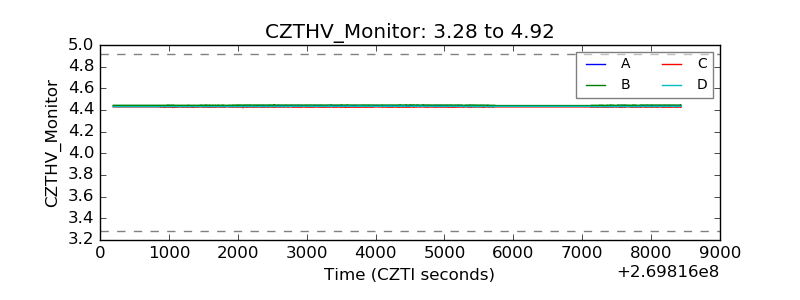 |
| D_VDD | 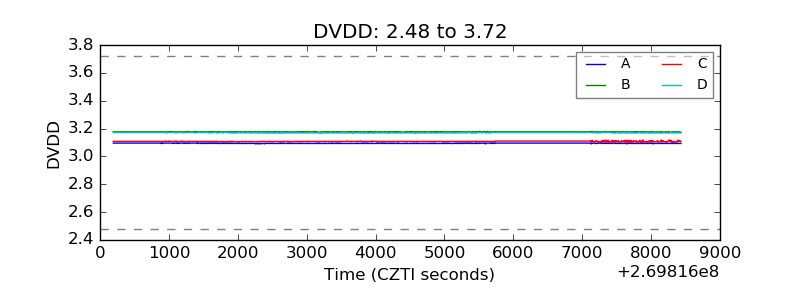 |
| Temperature 1 | 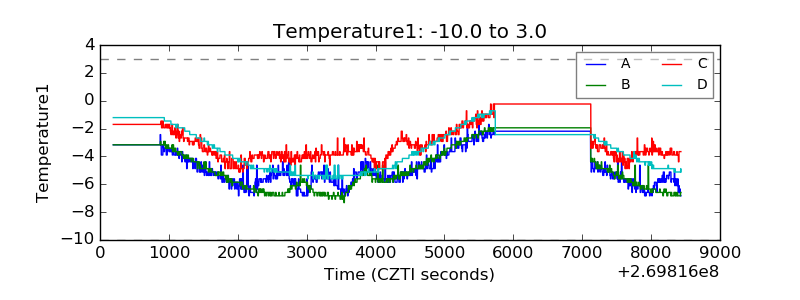 |
| Veto HV Monitor | 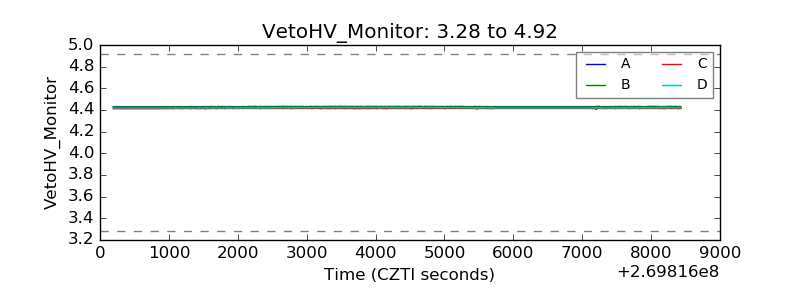 |
| Veto LLD | 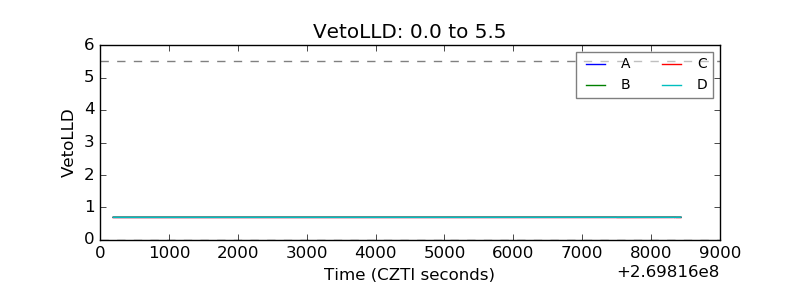 |
| Alpha Counter | 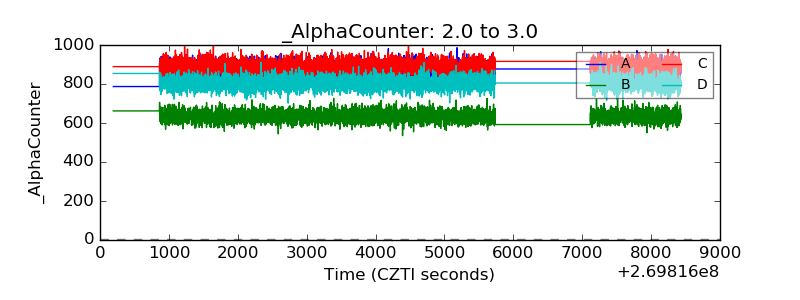 |
| _CPM_Rate | 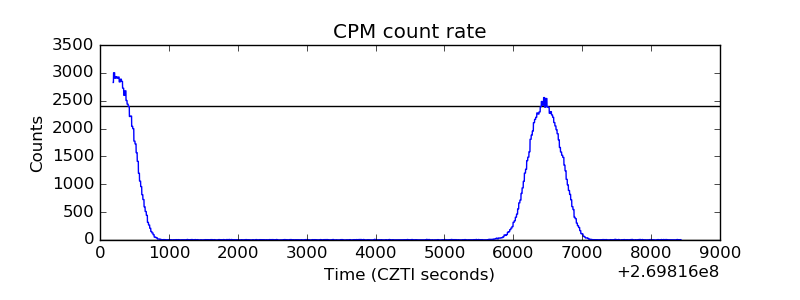 |
| CZT Counter | 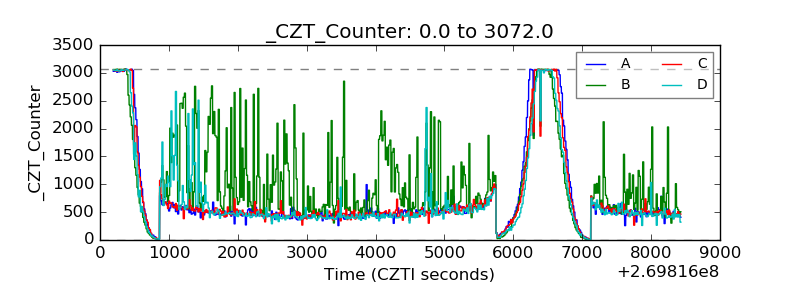 |
| +2.5 Volts monitor |  |
| +5 Volts monitor |  |
| _ROLL_ROT | 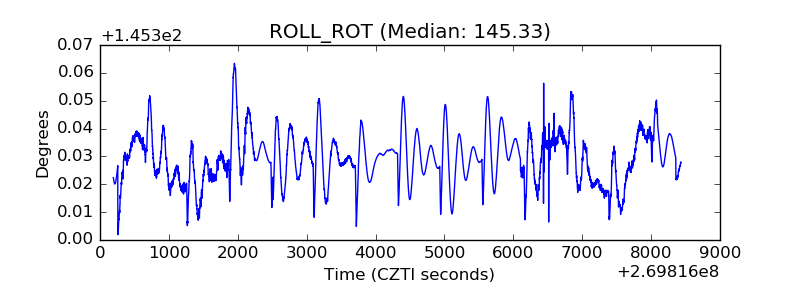 |
| _Roll_DEC | 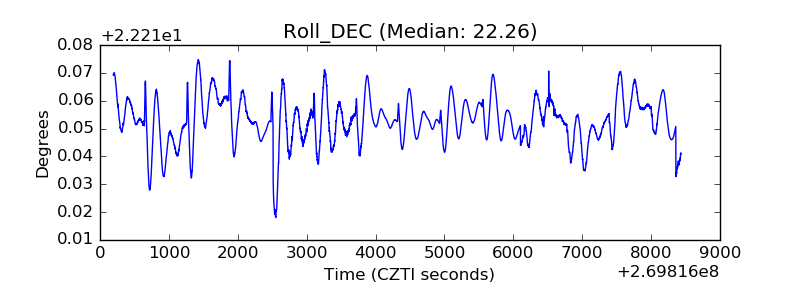 |
| _Roll_RA | 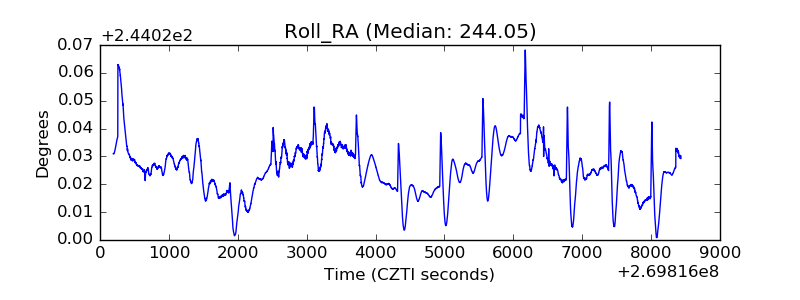 |
| Veto Counter | 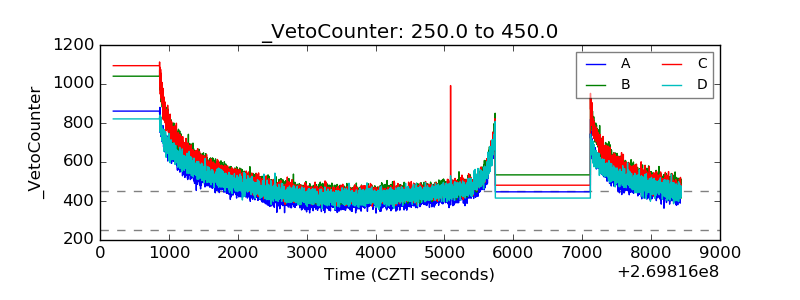 |