| Param | Original file | Final file |
|---|---|---|
| Filename | modeM0/AS1T02_069T01_9000002242_15200cztM0_level2.evt | modeM0/AS1T02_069T01_9000002242_15200cztM0_level2_quad_clean.evt |
| Size (bytes) | 501,215,040 | 80,464,320 |
| Size | 478.0 MB | 76.7 MB |
| Events in quadrant A | 3,147,157 | 507,964 |
| Events in quadrant B | 4,437,008 | 499,124 |
| Events in quadrant C | 3,503,211 | 499,170 |
| Events in quadrant D | 3,649,946 | 475,919 |
| Mode M0 | |||
|---|---|---|---|
| Quadrant | BADHDUFLAG | Total packets | Discarded packets |
| A | 0 | 13463 | 3 |
| B | 0 | 17411 | 2 |
| C | 0 | 14536 | 2 |
| D | 0 | 15058 | 2 |
| Mode SS | |||
|---|---|---|---|
| Quadrant | BADHDUFLAG | Total packets | Discarded packets |
| A | 0 | 134 | 0 |
| B | 0 | 134 | 0 |
| C | 0 | 134 | 0 |
| D | 0 | 134 | 0 |
| Mode M9 | |||
|---|---|---|---|
| Quadrant | BADHDUFLAG | Total packets | Discarded packets |
| A | 0 | 17 | 0 |
| B | 0 | 17 | 0 |
| C | 0 | 17 | 0 |
| D | 0 | 18 | 0 |
| Quadrant | Total seconds | Saturated seconds | Saturation percentage |
|---|---|---|---|
| A | 6507 | 20 | 0.307361% |
| B | 6507 | 347 | 5.332719% |
| C | 6507 | 15 | 0.230521% |
| D | 6507 | 126 | 1.936376% |
Noise dominated data is calculated using 1-second bins in cleaned event files. If a bin has >2000 counts, and if more than 50% of those come from <1% of pixels, then it is considered to be noise-dominated and hence unusable.
| Quadrant | # 1 sec bins | Bins with >0 counts | Bins with >2000 counts | High rate bins dominated by noise | Noise dominated (total time) | Noise dominated (detector-on time) | Marked lightcurve |
|---|---|---|---|---|---|---|---|
| A | 7578 | 6500 | 0 | 0 | 0.00% | 0.00% | 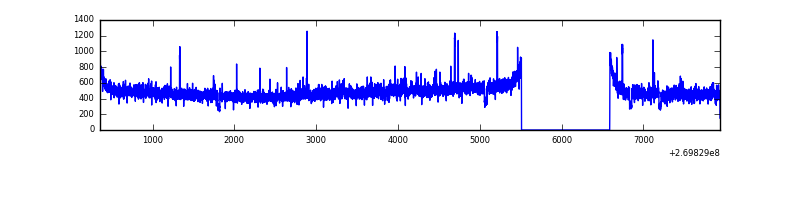 |
| B | 7578 | 6500 | 212 | 212 | 2.80% | 3.26% | 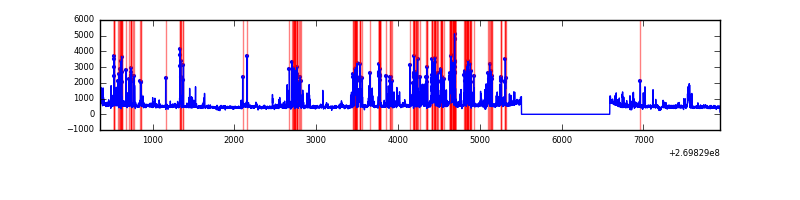 |
| C | 7578 | 6500 | 0 | 0 | 0.00% | 0.00% |  |
| D | 7578 | 6500 | 117 | 117 | 1.54% | 1.80% | 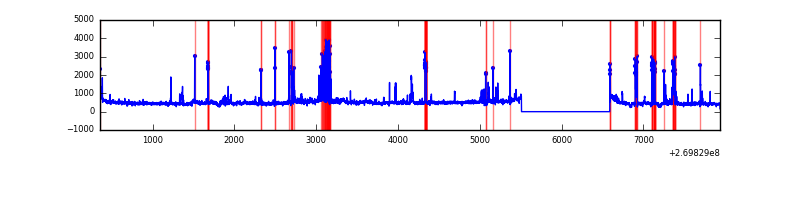 |
Top three noisy pixels from each quadrant. If the there are fewer than three noisy pixels in the level2.evt file, extra rows are filled as -1
| Pixel properties | Quadrant properties | ||||||
|---|---|---|---|---|---|---|---|
| Quadrant | DetID | PixID | Counts | Sigma | Mean | Median | Sigma |
| A | 12 | 189 | 66877 | 411.25 | 798 | 780 | 160.7 |
| A | 0 | 226 | 7027 | 38.87 | 798 | 780 | 160.7 |
| A | 15 | 239 | 6462 | 35.35 | 798 | 780 | 160.7 |
| B | 3 | 112 | 1165322 | 7739.88 | 790 | 771 | 150.5 |
| B | 4 | 173 | 46281 | 302.47 | 790 | 771 | 150.5 |
| B | 0 | 229 | 25464 | 164.11 | 790 | 771 | 150.5 |
| C | 3 | 233 | 385186 | 2147.62 | 774 | 779 | 179.0 |
| C | 7 | 247 | 99243 | 550.1 | 774 | 779 | 179.0 |
| C | 13 | 61 | 5628 | 27.09 | 774 | 779 | 179.0 |
| D | 13 | 104 | 184585 | 983.95 | 763 | 741 | 186.8 |
| D | 2 | 33 | 137638 | 732.69 | 763 | 741 | 186.8 |
| D | 1 | 255 | 127006 | 675.78 | 763 | 741 | 186.8 |
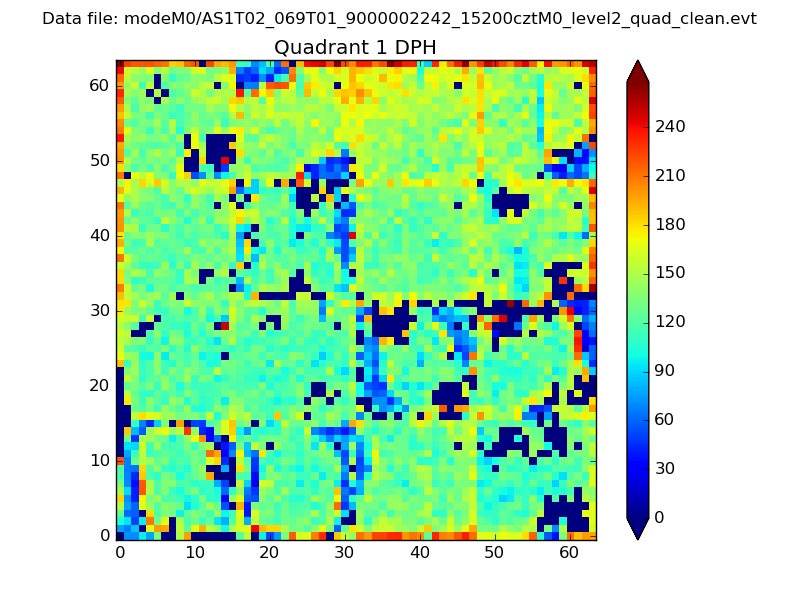
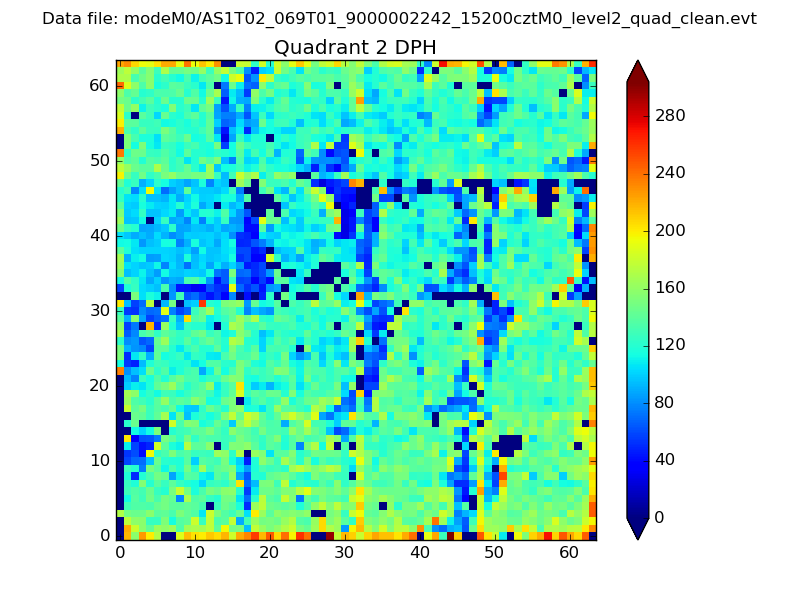
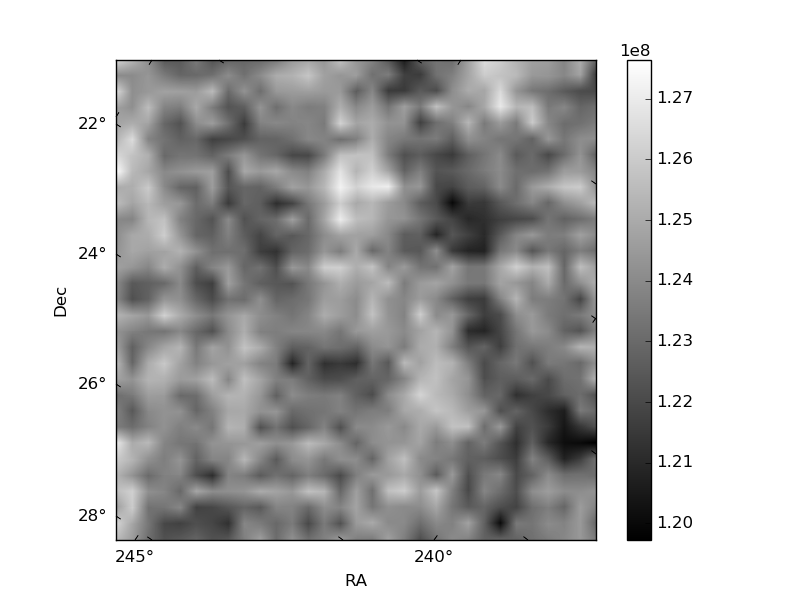
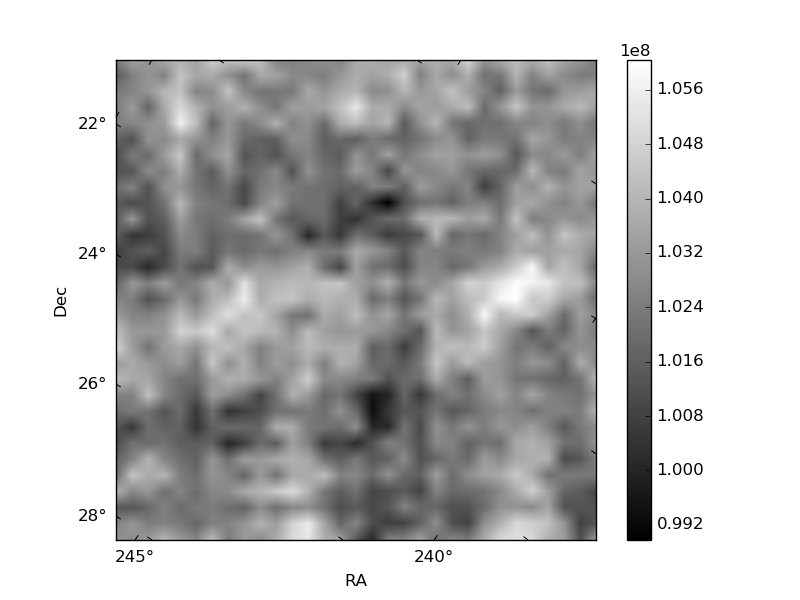
Histogram calculated using DETX and DETY for each event in the final _common_clean file
| Quadrant A | 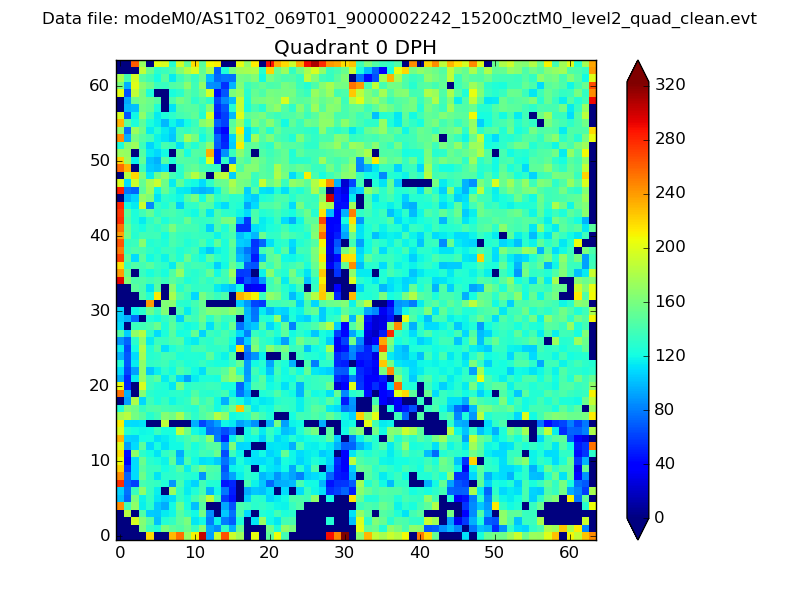 |
 |
Quadrant B |
|---|---|---|---|
| Quadrant D | 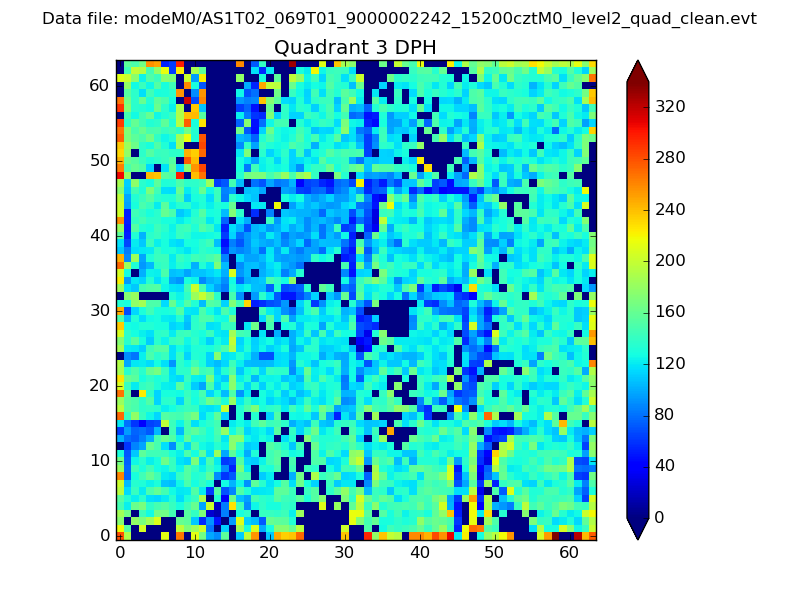 |
 |
Quadrant C |
| Plot type | Count rate plots | Images |
|---|---|---|
| Comparison with Poisson distribution Blue bars denote a histogram of data divided into 1 sec bins. Red curve is a Poisson curve with rate = median count rate of data. |
 |
 |
| Quadrant-wise count rates Data is divided into 100 sec bins |
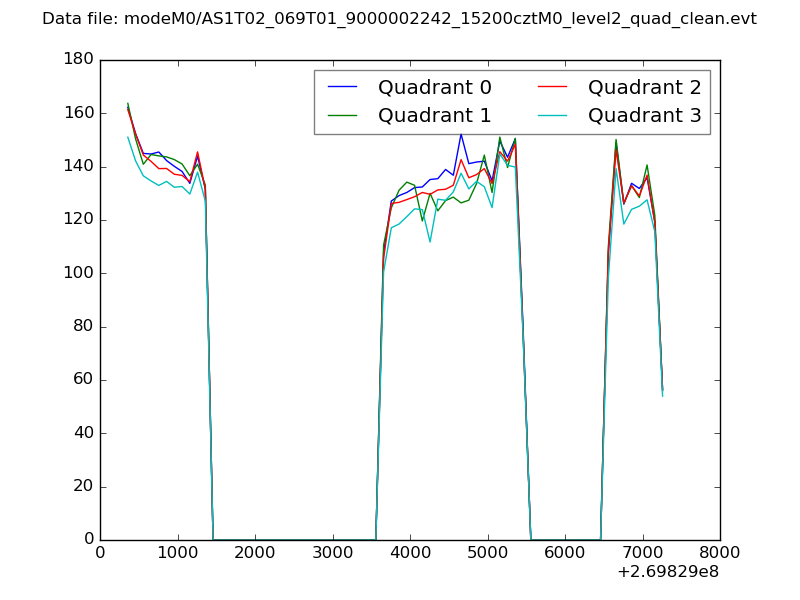 |
|
| Module-wise count rates for Quadrant A Data is divided into 100 sec bins |
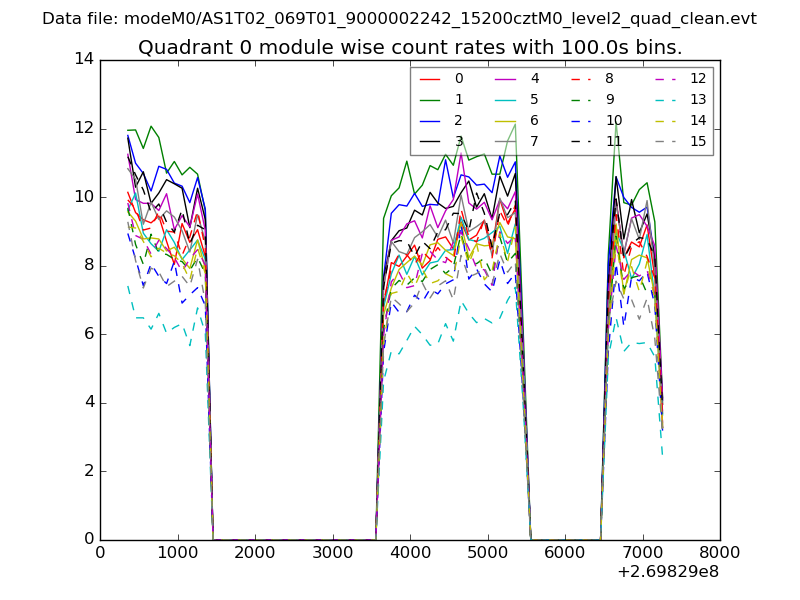 |
 |
| Module-wise count rates for Quadrant B Data is divided into 100 sec bins |
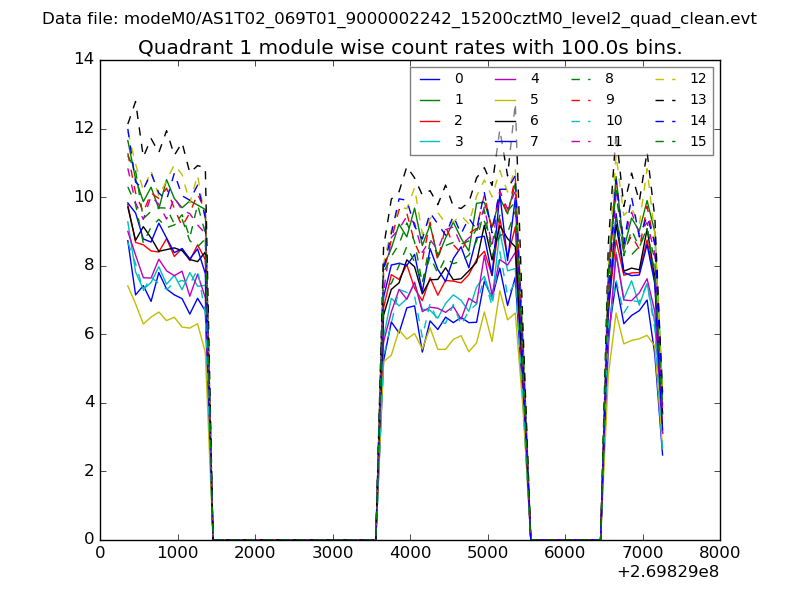 |
 |
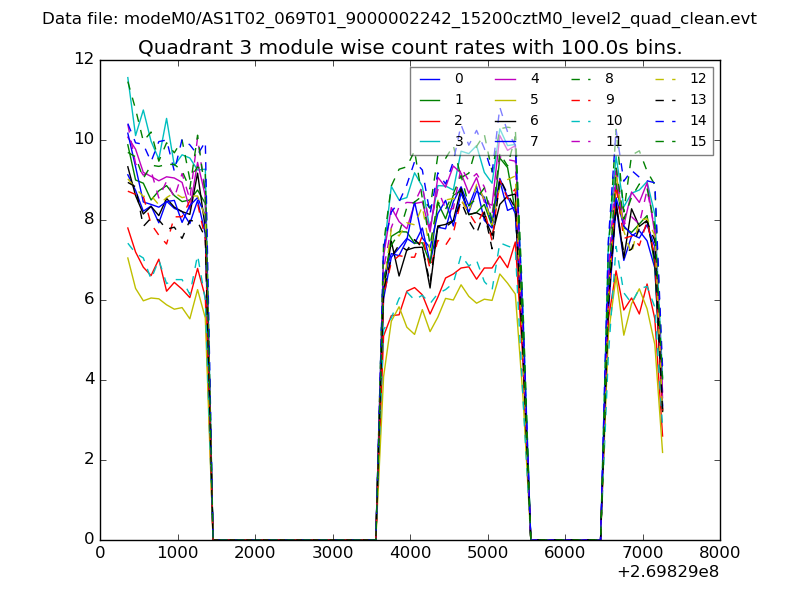
| Module-wise count rates for Quadrant C Data is divided into 100 sec bins |
 |
 |
| Module-wise count rates for Quadrant D Data is divided into 100 sec bins |
 |
 |
| Parameter | Plot |
|---|---|
| CZT HV Monitor |  |
| D_VDD | 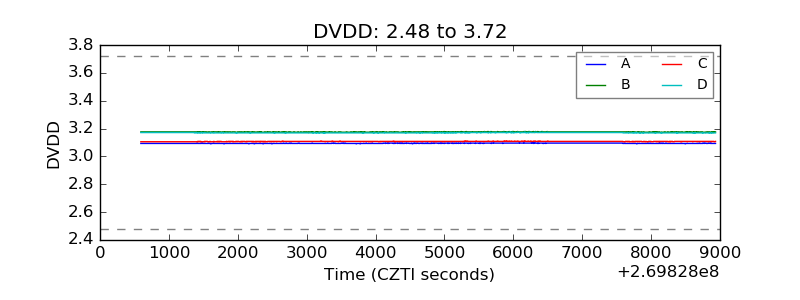 |
| Temperature 1 | 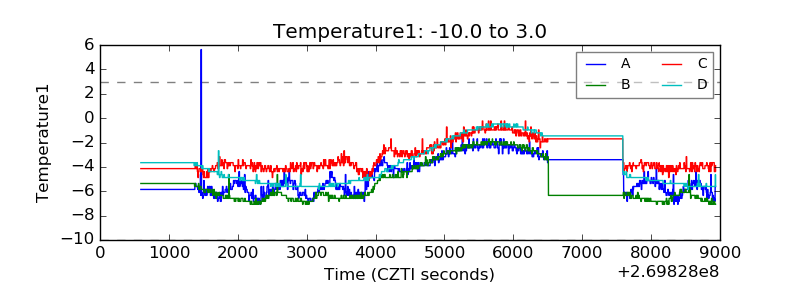 |
| Veto HV Monitor | 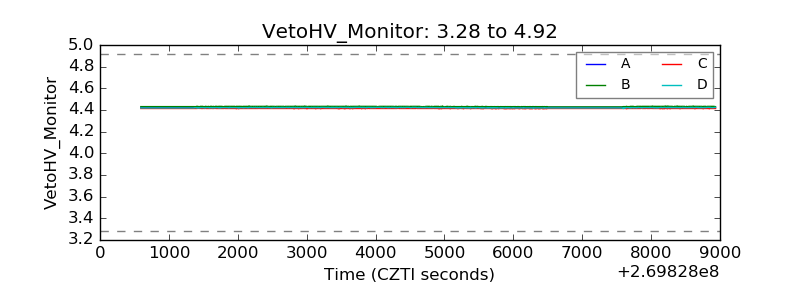 |
| Veto LLD | 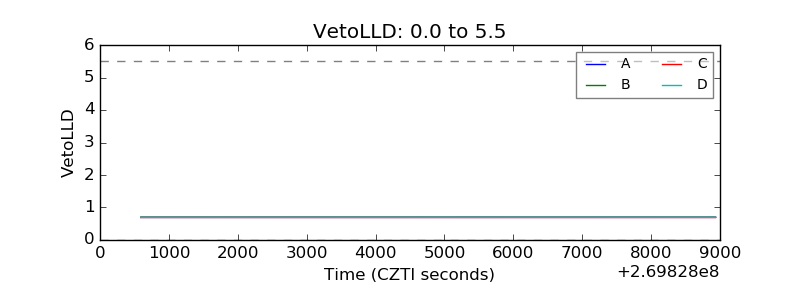 |
| Alpha Counter | 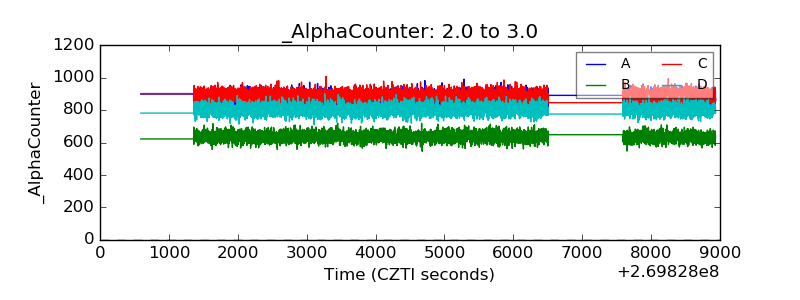 |
| _CPM_Rate | 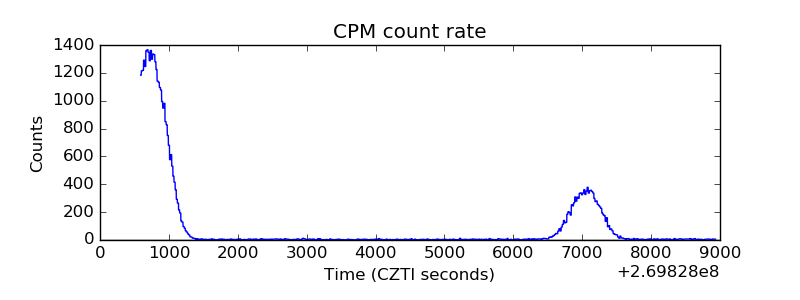 |
| CZT Counter | 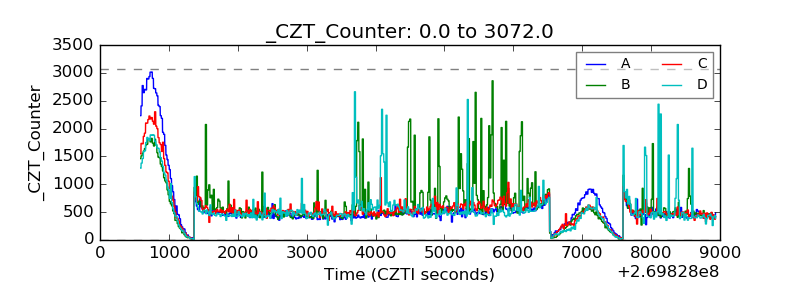 |
| +2.5 Volts monitor |  |
| +5 Volts monitor |  |
| _ROLL_ROT | 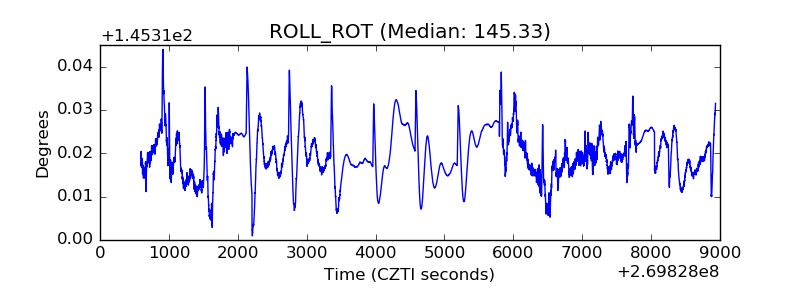 |
| _Roll_DEC | 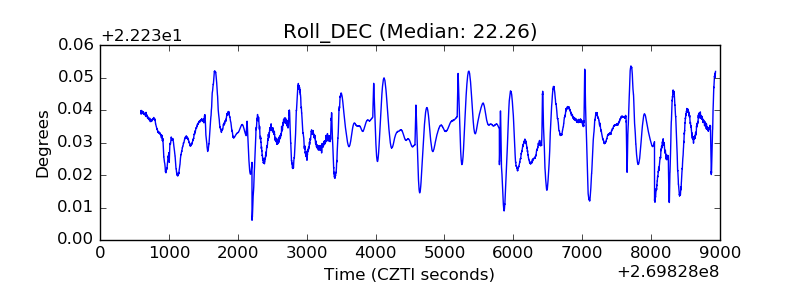 |
| _Roll_RA | 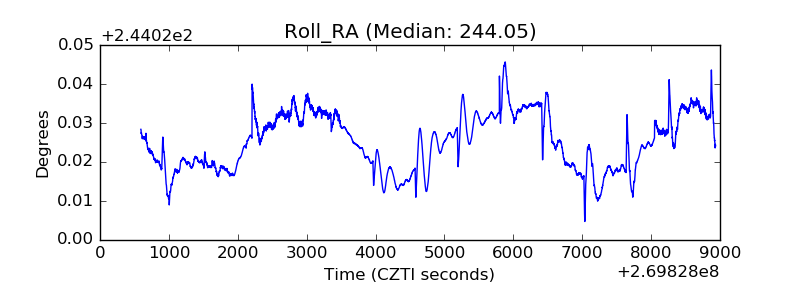 |
| Veto Counter | 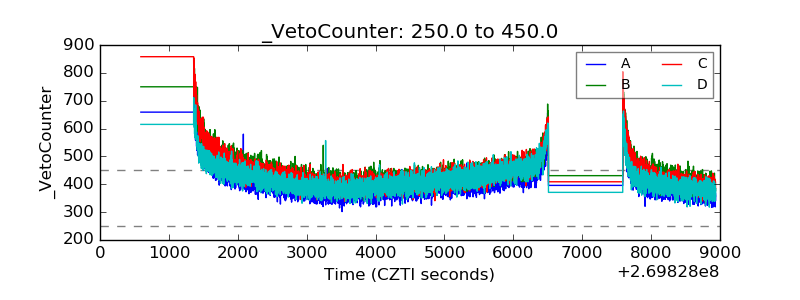 |