| Param | Original file | Final file |
|---|---|---|
| Filename | modeM0/AS1T02_069T01_9000002242_15201cztM0_level2.evt | modeM0/AS1T02_069T01_9000002242_15201cztM0_level2_quad_clean.evt |
| Size (bytes) | 500,860,800 | 79,657,920 |
| Size | 477.7 MB | 76.0 MB |
| Events in quadrant A | 3,423,769 | 491,759 |
| Events in quadrant B | 4,191,765 | 484,399 |
| Events in quadrant C | 3,557,139 | 482,310 |
| Events in quadrant D | 3,517,781 | 462,908 |
| Mode M0 | |||
|---|---|---|---|
| Quadrant | BADHDUFLAG | Total packets | Discarded packets |
| A | 0 | 14668 | 3 |
| B | 0 | 16934 | 2 |
| C | 0 | 14899 | 2 |
| D | 0 | 15467 | 2 |
| Mode SS | |||
|---|---|---|---|
| Quadrant | BADHDUFLAG | Total packets | Discarded packets |
| A | 0 | 144 | 0 |
| B | 0 | 144 | 0 |
| C | 0 | 144 | 0 |
| D | 0 | 144 | 0 |
| Mode M9 | |||
|---|---|---|---|
| Quadrant | BADHDUFLAG | Total packets | Discarded packets |
| A | 0 | 7 | 0 |
| B | 0 | 7 | 0 |
| C | 0 | 7 | 0 |
| D | 0 | 8 | 0 |
| Quadrant | Total seconds | Saturated seconds | Saturation percentage |
|---|---|---|---|
| A | 7040 | 47 | 0.667614% |
| B | 7040 | 248 | 3.522727% |
| C | 7040 | 31 | 0.440341% |
| D | 7040 | 71 | 1.008523% |
Noise dominated data is calculated using 1-second bins in cleaned event files. If a bin has >2000 counts, and if more than 50% of those come from <1% of pixels, then it is considered to be noise-dominated and hence unusable.
| Quadrant | # 1 sec bins | Bins with >0 counts | Bins with >2000 counts | High rate bins dominated by noise | Noise dominated (total time) | Noise dominated (detector-on time) | Marked lightcurve |
|---|---|---|---|---|---|---|---|
| A | 7696 | 7042 | 0 | 0 | 0.00% | 0.00% | 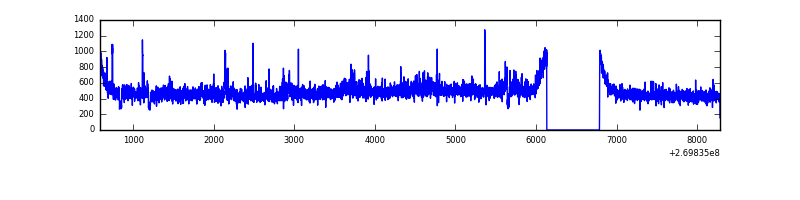 |
| B | 7696 | 7042 | 120 | 120 | 1.56% | 1.70% | 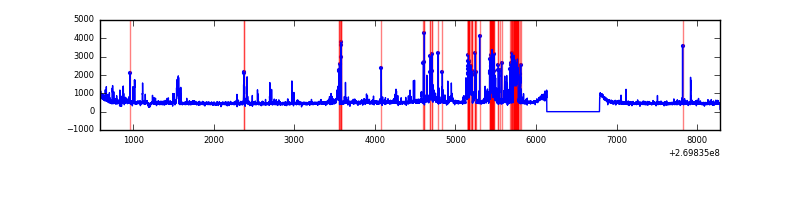 |
| C | 7696 | 7042 | 1 | 1 | 0.01% | 0.01% | 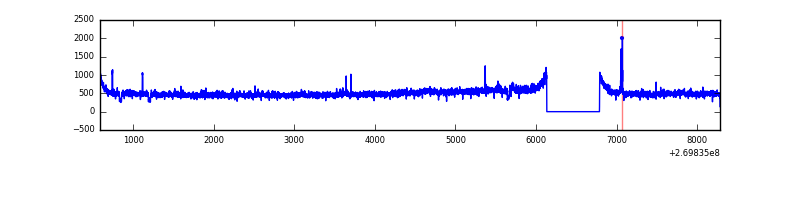 |
| D | 7696 | 7042 | 52 | 52 | 0.68% | 0.74% | 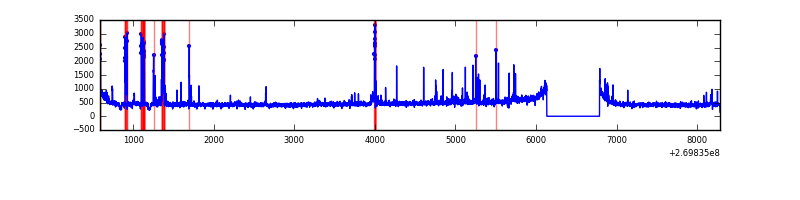 |
Top three noisy pixels from each quadrant. If the there are fewer than three noisy pixels in the level2.evt file, extra rows are filled as -1
| Pixel properties | Quadrant properties | ||||||
|---|---|---|---|---|---|---|---|
| Quadrant | DetID | PixID | Counts | Sigma | Mean | Median | Sigma |
| A | 12 | 189 | 133660 | 769.3 | 852 | 834 | 172.7 |
| A | 15 | 239 | 9613 | 50.85 | 852 | 834 | 172.7 |
| A | 0 | 226 | 7618 | 39.29 | 852 | 834 | 172.7 |
| B | 3 | 112 | 604929 | 3689.7 | 848 | 826 | 163.7 |
| B | 4 | 173 | 101901 | 617.34 | 848 | 826 | 163.7 |
| B | 3 | 64 | 76309 | 461.03 | 848 | 826 | 163.7 |
| C | 3 | 233 | 320039 | 1659.35 | 829 | 834 | 192.4 |
| C | 7 | 247 | 6841 | 31.23 | 829 | 834 | 192.4 |
| C | 13 | 61 | 6154 | 27.66 | 829 | 834 | 192.4 |
| D | 2 | 33 | 110629 | 546.84 | 819 | 798 | 200.8 |
| D | 13 | 172 | 81302 | 400.82 | 819 | 798 | 200.8 |
| D | 7 | 223 | 53157 | 260.69 | 819 | 798 | 200.8 |
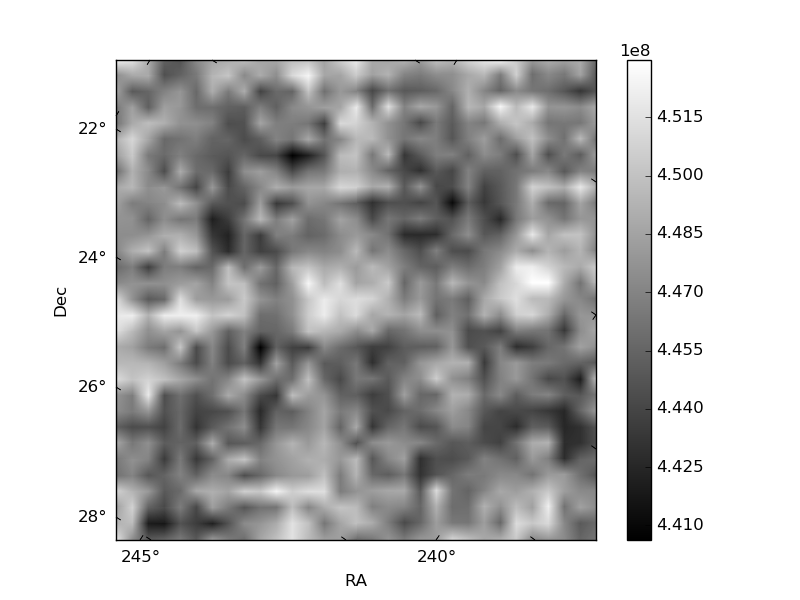
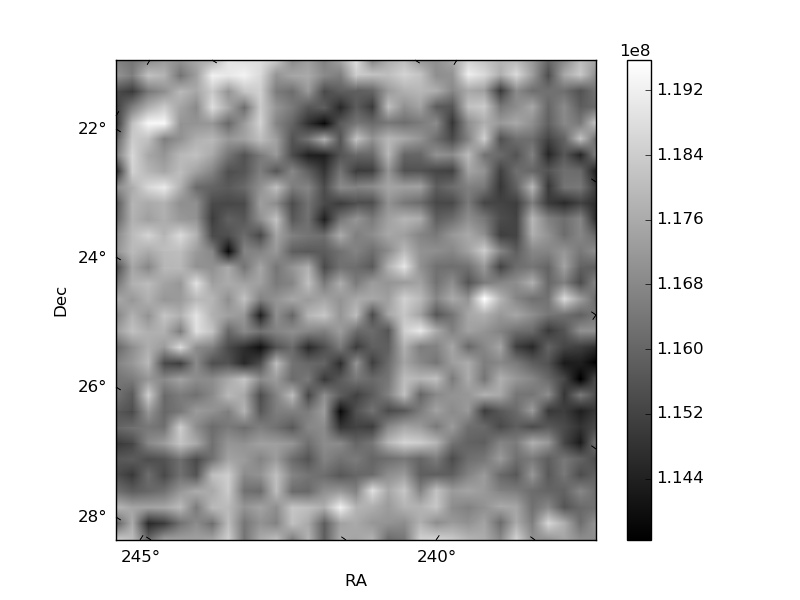
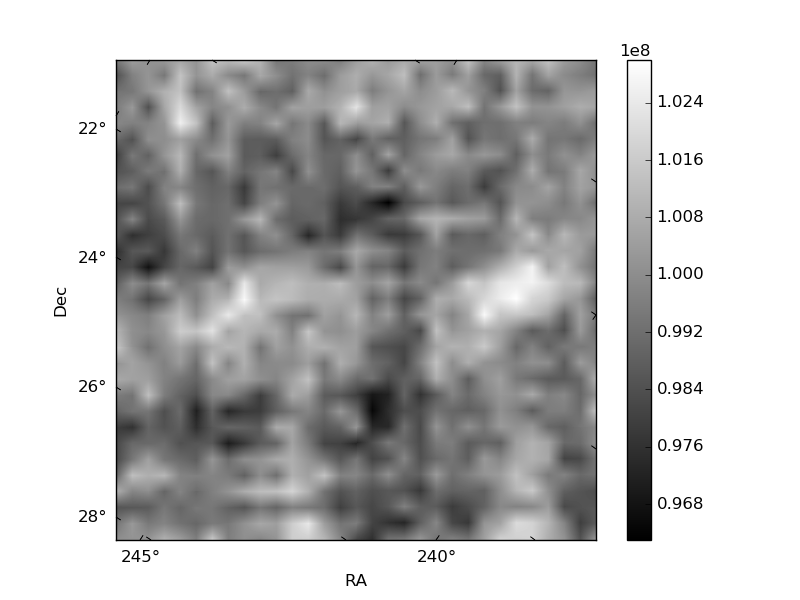
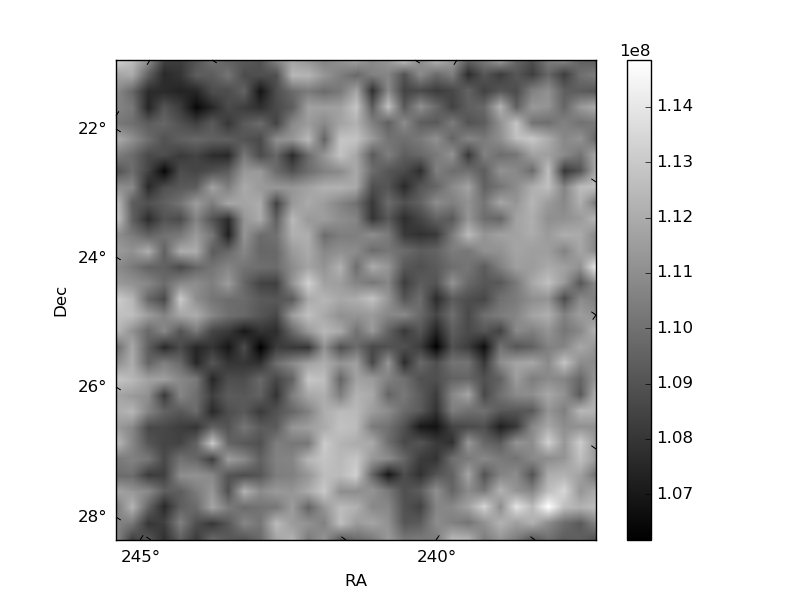
Histogram calculated using DETX and DETY for each event in the final _common_clean file
| Quadrant A | 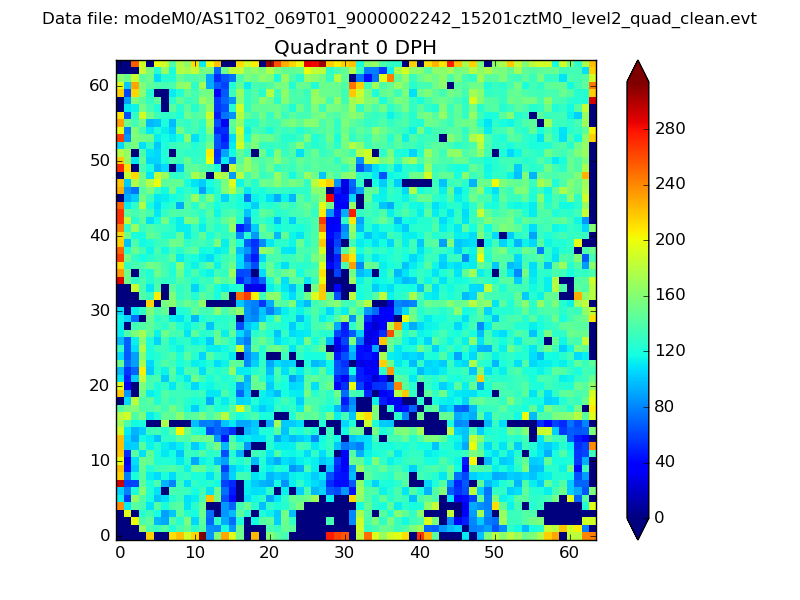 |
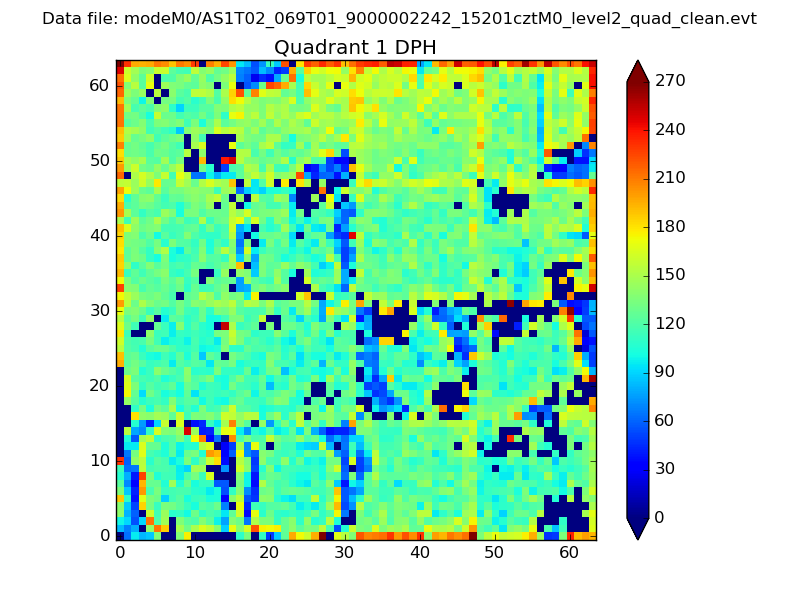 |
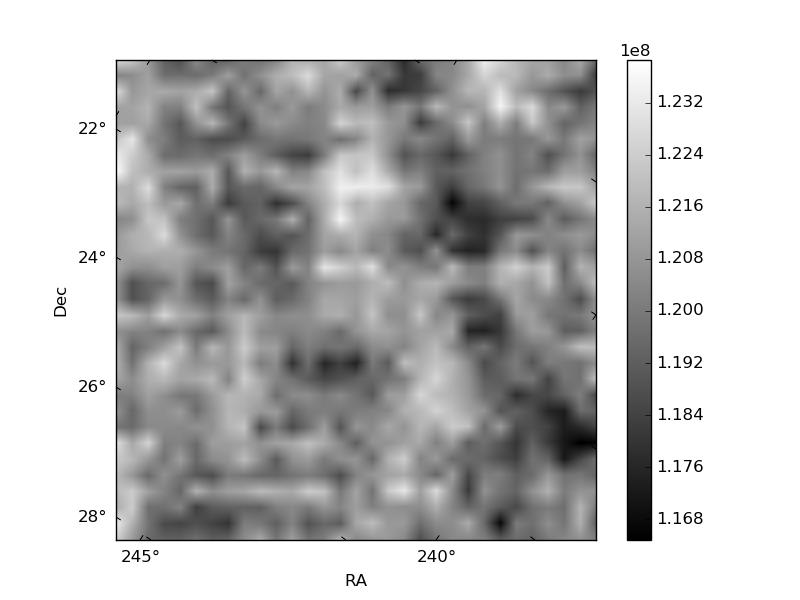
Quadrant B |
|---|---|---|---|
| Quadrant D | 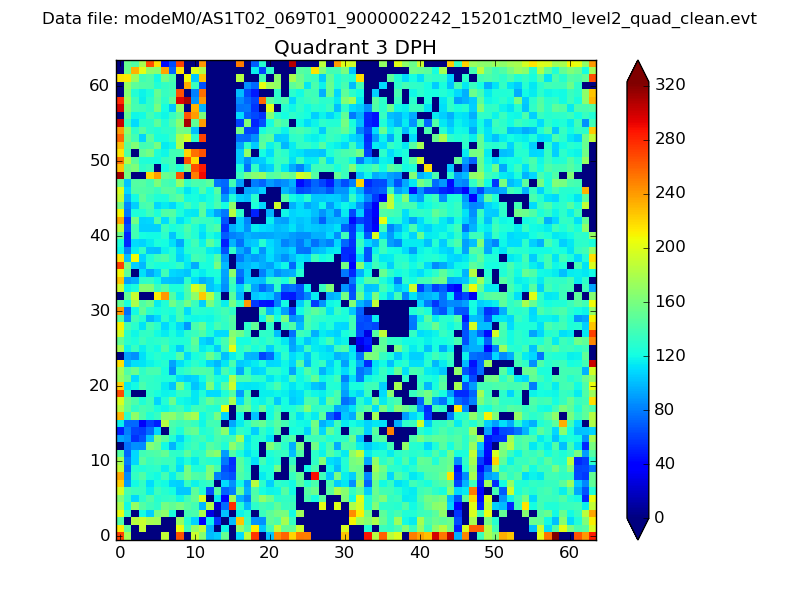 |
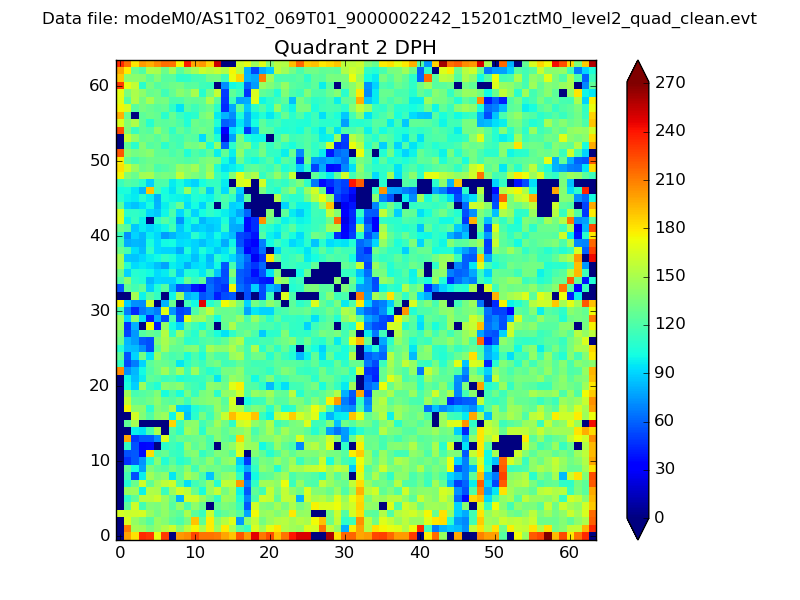 |
Quadrant C |
| Plot type | Count rate plots | Images |
|---|---|---|
| Comparison with Poisson distribution Blue bars denote a histogram of data divided into 1 sec bins. Red curve is a Poisson curve with rate = median count rate of data. |
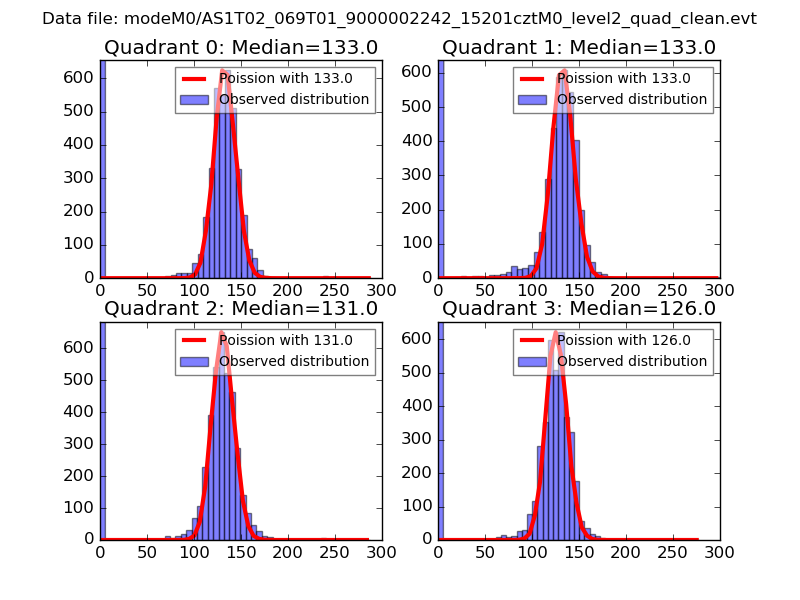 |
 |
| Quadrant-wise count rates Data is divided into 100 sec bins |
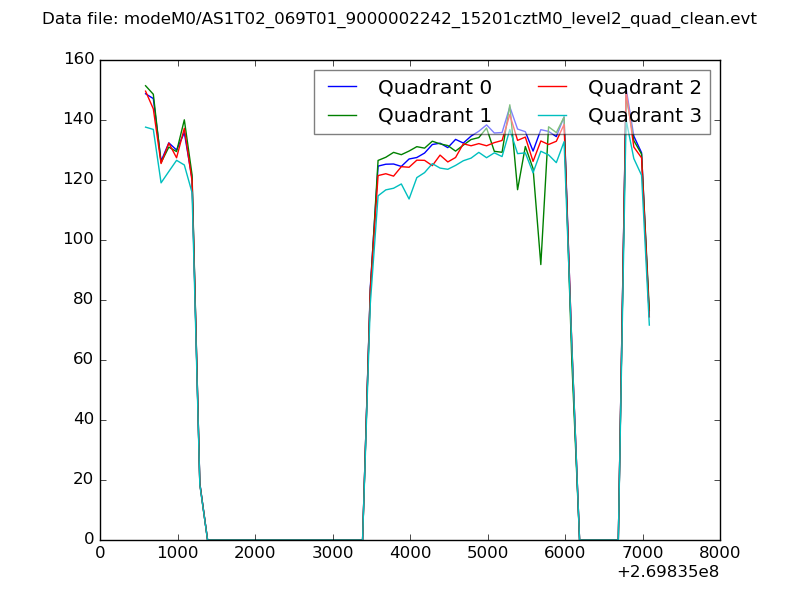 |
|
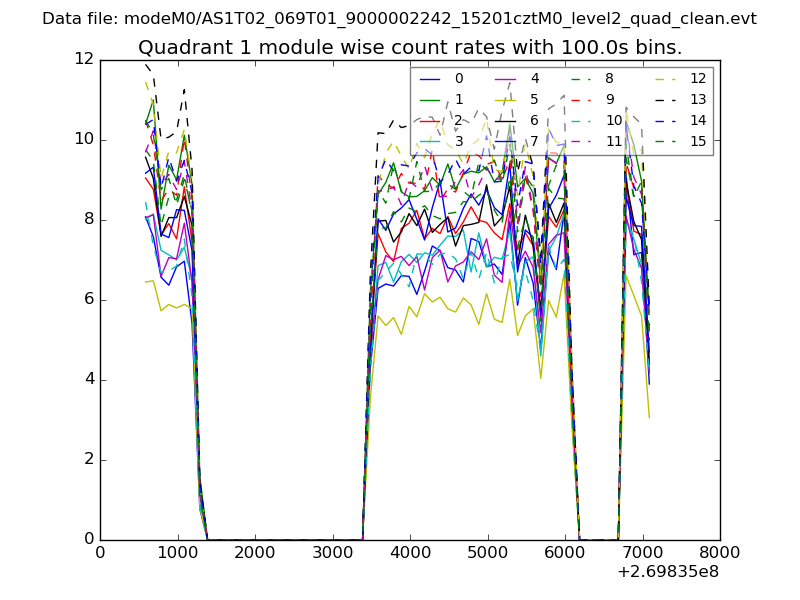
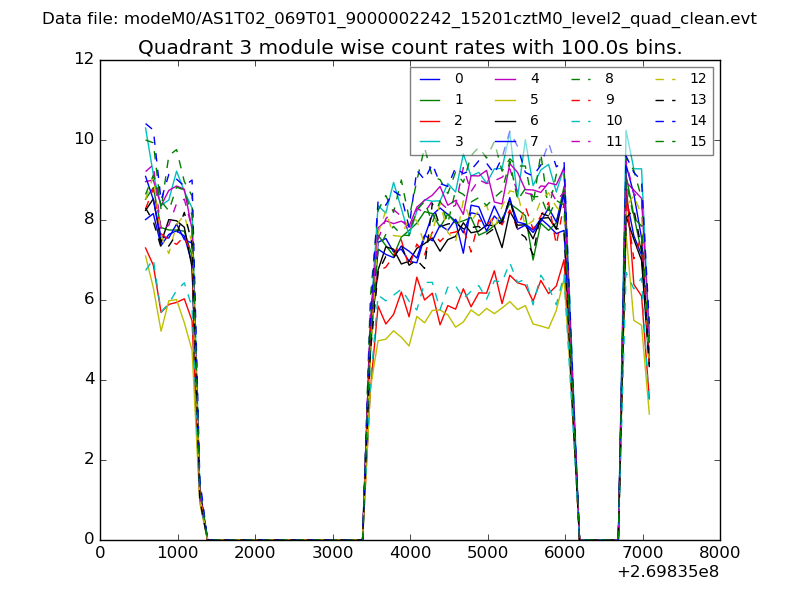
| Module-wise count rates for Quadrant A Data is divided into 100 sec bins |
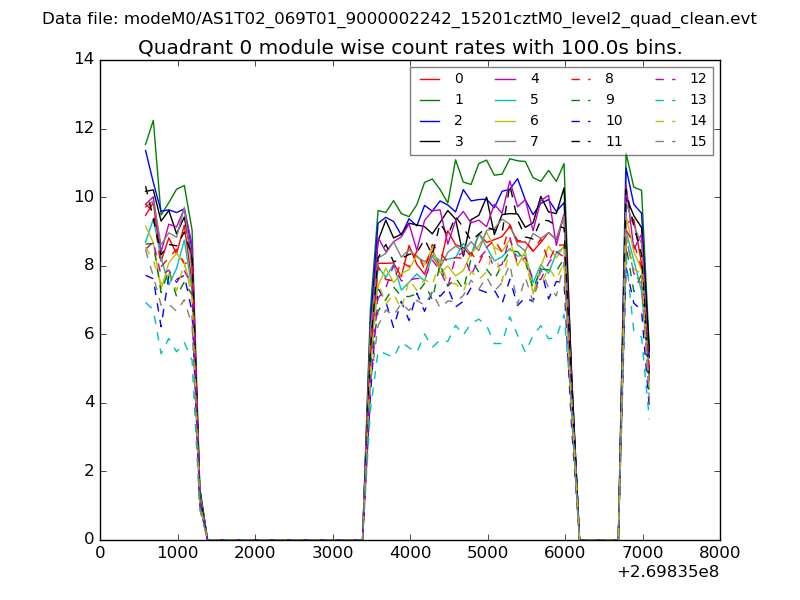 |
 |
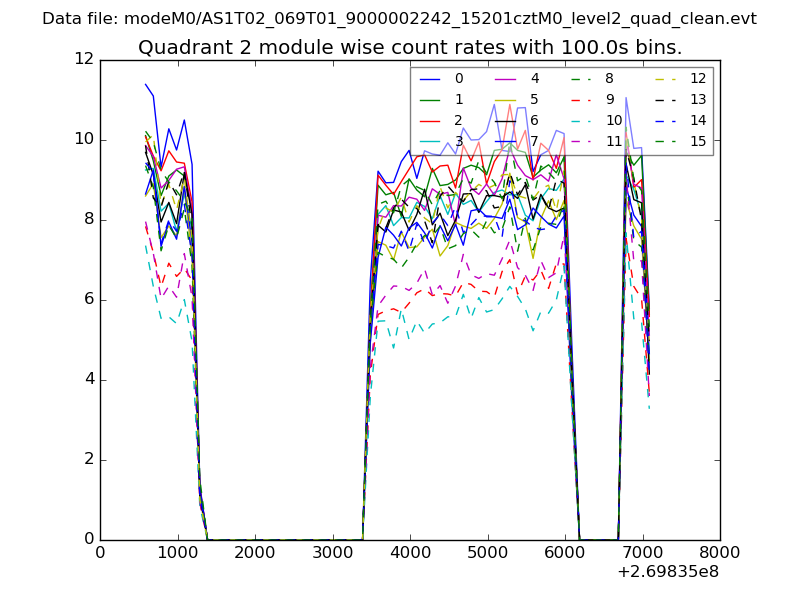
| Module-wise count rates for Quadrant B Data is divided into 100 sec bins |
 |
 |
| Module-wise count rates for Quadrant C Data is divided into 100 sec bins |
 |
 |
| Module-wise count rates for Quadrant D Data is divided into 100 sec bins |
 |
 |
| Parameter | Plot |
|---|---|
| CZT HV Monitor | 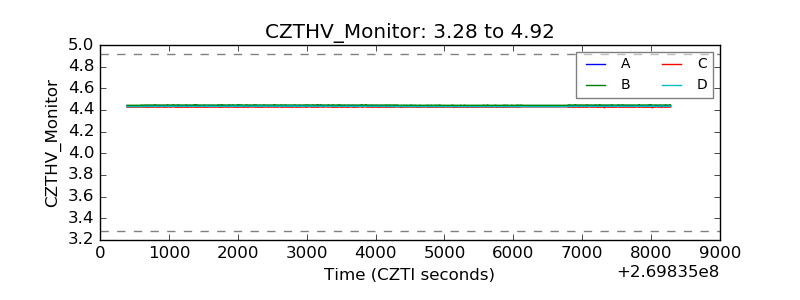 |
| D_VDD | 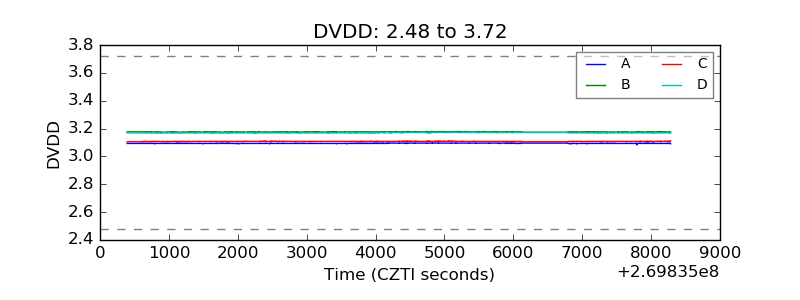 |
| Temperature 1 | 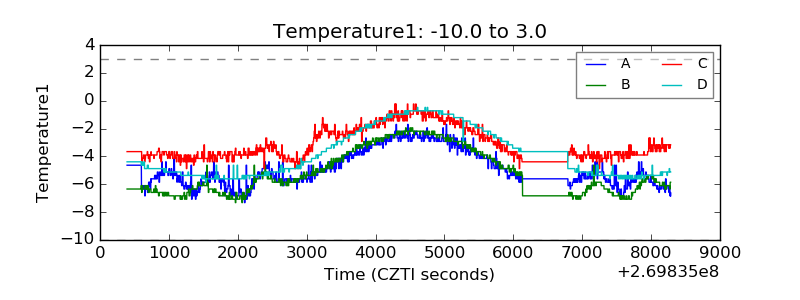 |
| Veto HV Monitor | 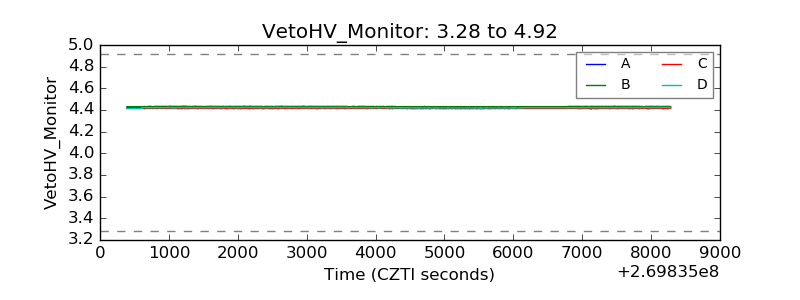 |
| Veto LLD | 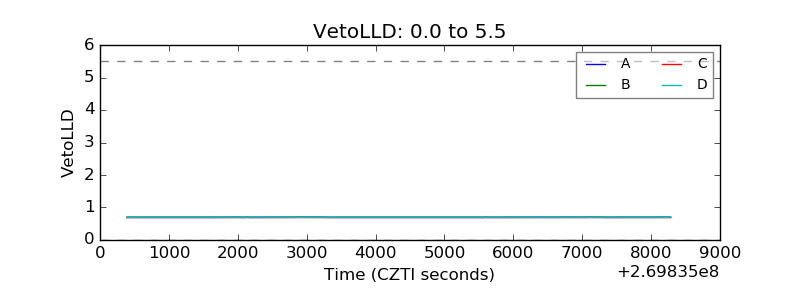 |
| Alpha Counter | 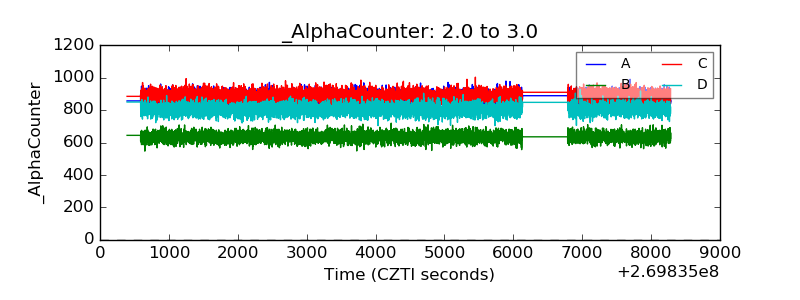 |
| _CPM_Rate | 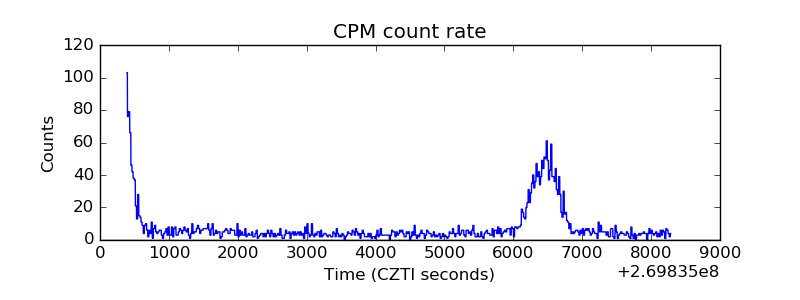 |
| CZT Counter | 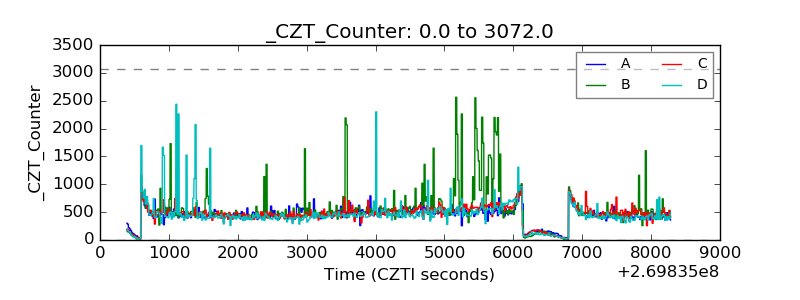 |
| +2.5 Volts monitor |  |
| +5 Volts monitor | 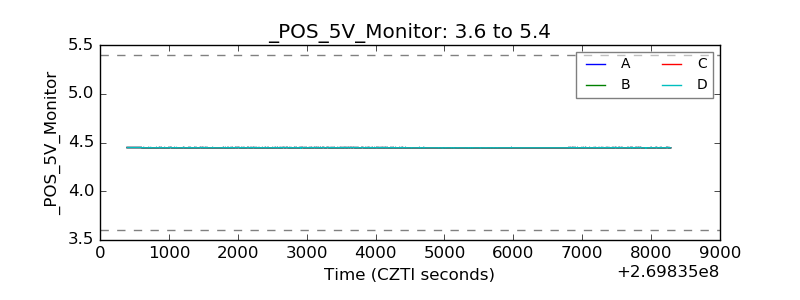 |
| _ROLL_ROT | 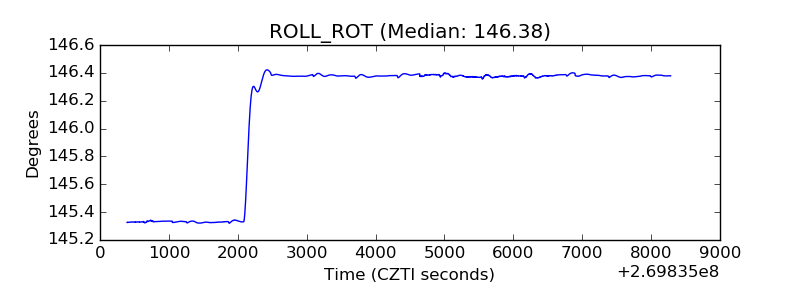 |
| _Roll_DEC | 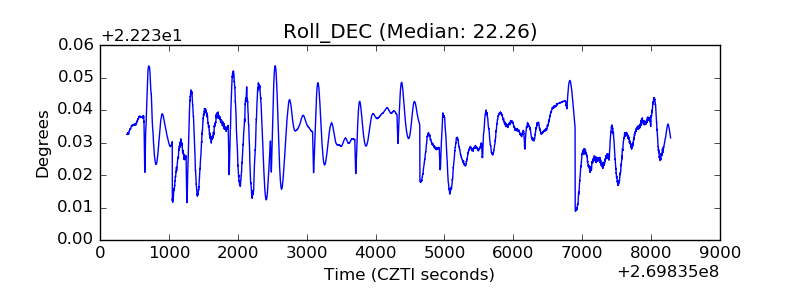 |
| _Roll_RA | 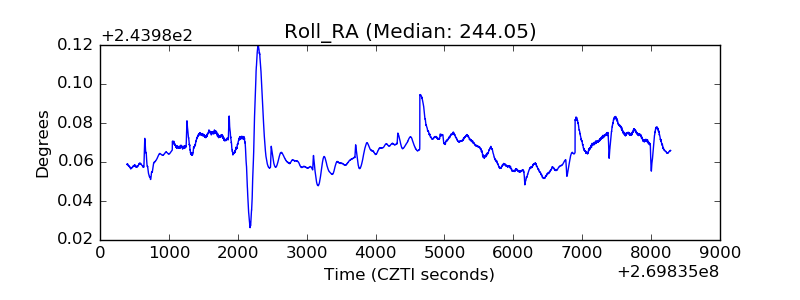 |
| Veto Counter | 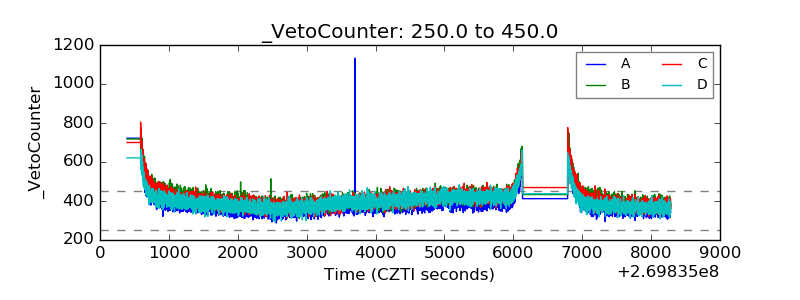 |