| Param | Original file | Final file |
|---|---|---|
| Filename | modeM0/AS1T02_069T01_9000002242_15202cztM0_level2.evt | modeM0/AS1T02_069T01_9000002242_15202cztM0_level2_quad_clean.evt |
| Size (bytes) | 624,075,840 | 96,007,680 |
| Size | 595.2 MB | 91.6 MB |
| Events in quadrant A | 4,148,410 | 597,072 |
| Events in quadrant B | 5,240,702 | 577,556 |
| Events in quadrant C | 4,828,928 | 586,094 |
| Events in quadrant D | 4,119,016 | 569,209 |
| Mode M0 | |||
|---|---|---|---|
| Quadrant | BADHDUFLAG | Total packets | Discarded packets |
| A | 0 | 17746 | 3 |
| B | 0 | 20840 | 2 |
| C | 0 | 19826 | 2 |
| D | 0 | 18104 | 2 |
| Mode SS | |||
|---|---|---|---|
| Quadrant | BADHDUFLAG | Total packets | Discarded packets |
| A | 0 | 170 | 0 |
| B | 0 | 170 | 0 |
| C | 0 | 170 | 0 |
| D | 0 | 170 | 0 |
| Mode M9 | |||
|---|---|---|---|
| Quadrant | BADHDUFLAG | Total packets | Discarded packets |
| A | 0 | 7 | 0 |
| B | 0 | 7 | 0 |
| C | 0 | 7 | 0 |
| D | 0 | 7 | 0 |
| Quadrant | Total seconds | Saturated seconds | Saturation percentage |
|---|---|---|---|
| A | 8304 | 262 | 3.155106% |
| B | 8304 | 624 | 7.514451% |
| C | 8304 | 193 | 2.324181% |
| D | 8304 | 184 | 2.215800% |
Noise dominated data is calculated using 1-second bins in cleaned event files. If a bin has >2000 counts, and if more than 50% of those come from <1% of pixels, then it is considered to be noise-dominated and hence unusable.
| Quadrant | # 1 sec bins | Bins with >0 counts | Bins with >2000 counts | High rate bins dominated by noise | Noise dominated (total time) | Noise dominated (detector-on time) | Marked lightcurve |
|---|---|---|---|---|---|---|---|
| A | 9089 | 8307 | 8 | 8 | 0.09% | 0.10% | 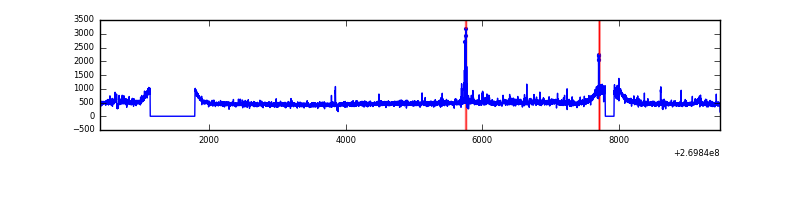 |
| B | 9089 | 8305 | 247 | 247 | 2.72% | 2.97% | 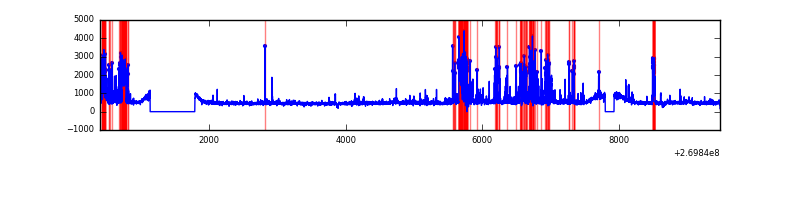 |
| C | 9089 | 8307 | 10 | 10 | 0.11% | 0.12% | 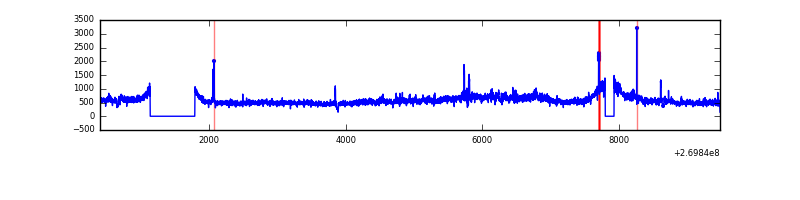 |
| D | 9089 | 8307 | 18 | 18 | 0.20% | 0.22% | 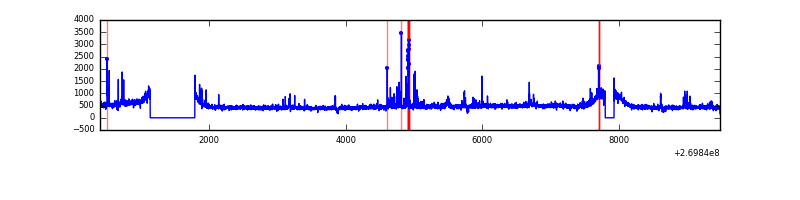 |
Top three noisy pixels from each quadrant. If the there are fewer than three noisy pixels in the level2.evt file, extra rows are filled as -1
| Pixel properties | Quadrant properties | ||||||
|---|---|---|---|---|---|---|---|
| Quadrant | DetID | PixID | Counts | Sigma | Mean | Median | Sigma |
| A | 12 | 189 | 128371 | 606.8 | 1035 | 1010 | 209.9 |
| A | 13 | 248 | 32708 | 151.02 | 1035 | 1010 | 209.9 |
| A | 0 | 226 | 9133 | 38.7 | 1035 | 1010 | 209.9 |
| B | 3 | 112 | 929301 | 4665.93 | 1018 | 991 | 199.0 |
| B | 3 | 64 | 178130 | 890.35 | 1018 | 991 | 199.0 |
| B | 0 | 189 | 36269 | 177.32 | 1018 | 991 | 199.0 |
| C | 3 | 233 | 875205 | 3726.28 | 1008 | 1010 | 234.6 |
| C | 7 | 247 | 20879 | 84.69 | 1008 | 1010 | 234.6 |
| C | 13 | 61 | 7392 | 27.2 | 1008 | 1010 | 234.6 |
| D | 13 | 172 | 130924 | 524.36 | 1006 | 975 | 247.8 |
| D | 2 | 33 | 73576 | 292.96 | 1006 | 975 | 247.8 |
| D | 8 | 195 | 38157 | 150.03 | 1006 | 975 | 247.8 |
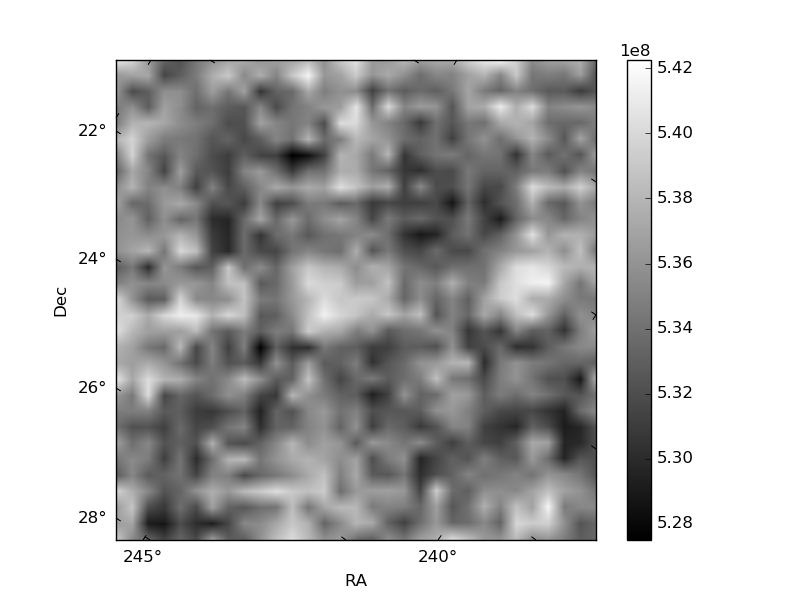
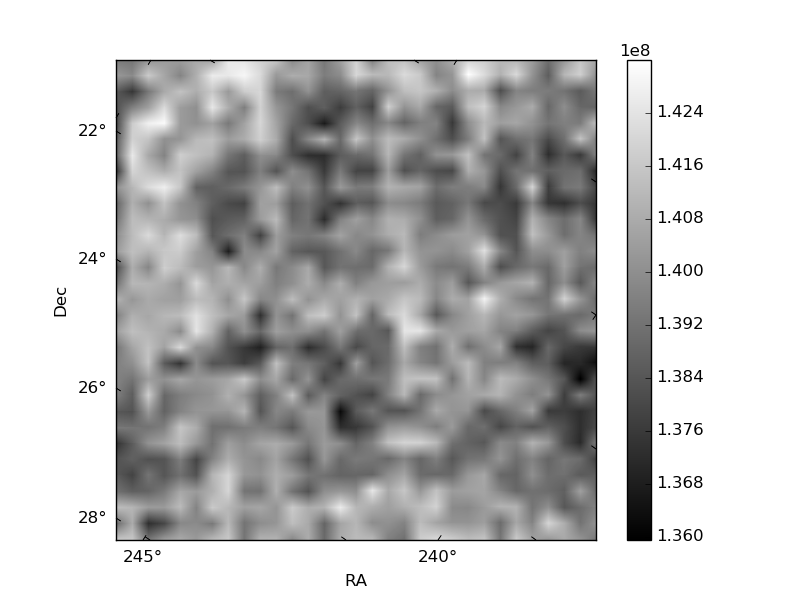
Histogram calculated using DETX and DETY for each event in the final _common_clean file
| Quadrant A | 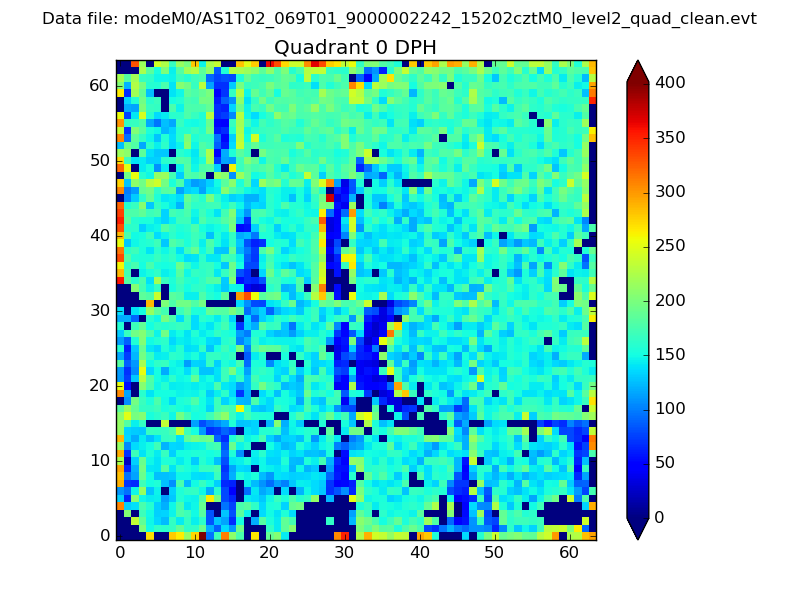 |
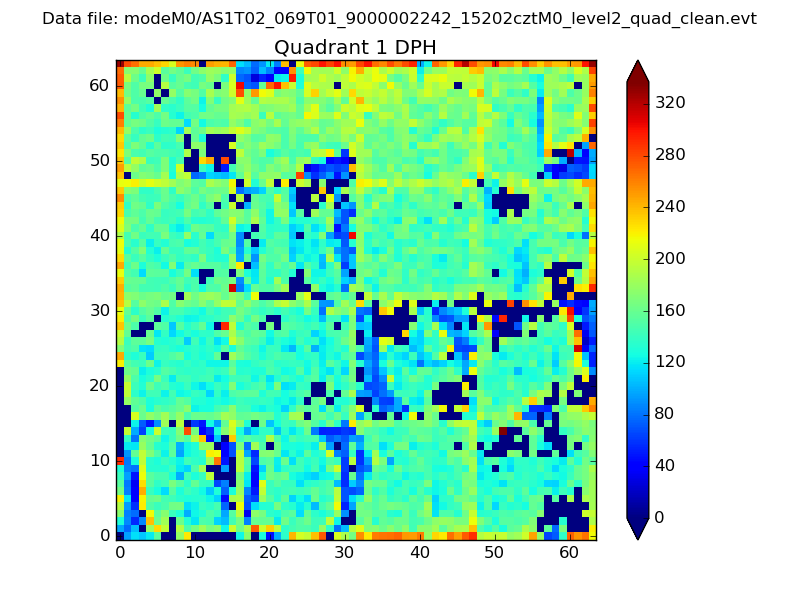 |
Quadrant B |
|---|---|---|---|
| Quadrant D |  |
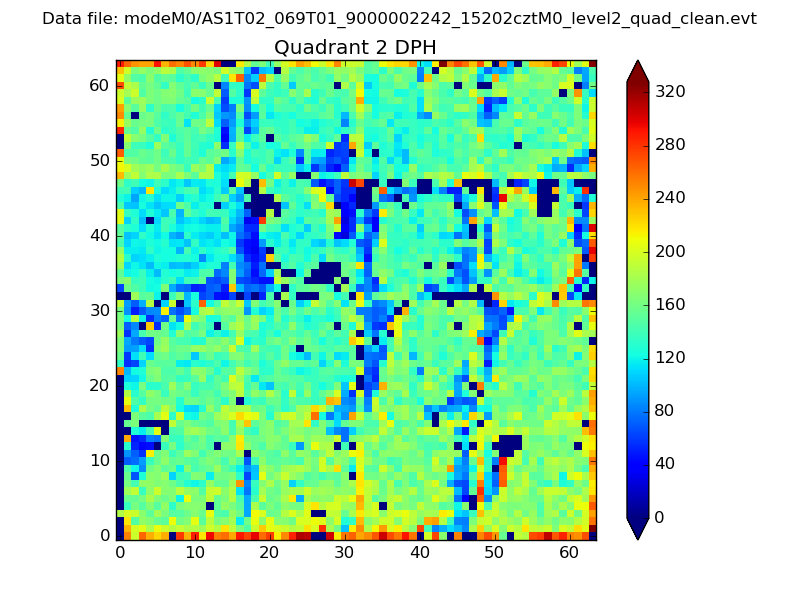 |
Quadrant C |
| Plot type | Count rate plots | Images |
|---|---|---|
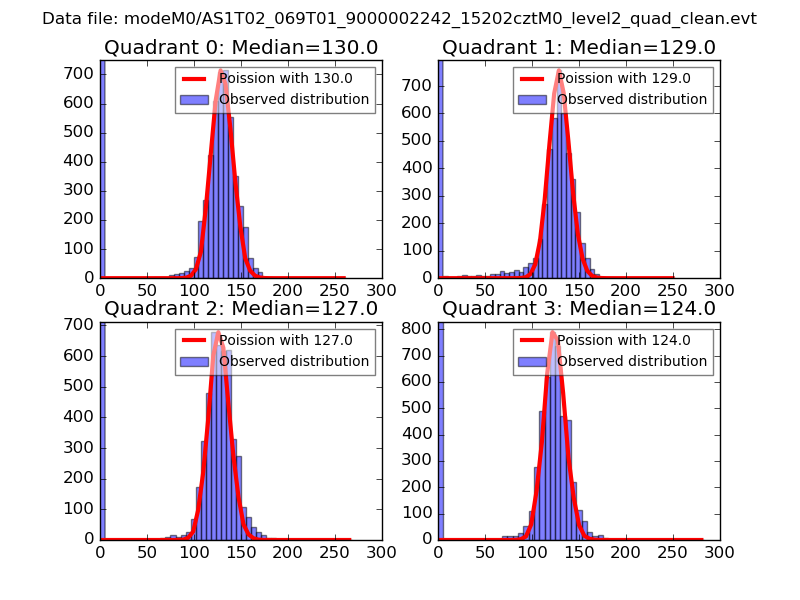
| Comparison with Poisson distribution Blue bars denote a histogram of data divided into 1 sec bins. Red curve is a Poisson curve with rate = median count rate of data. |
 |
 |
| Quadrant-wise count rates Data is divided into 100 sec bins |
 |
|
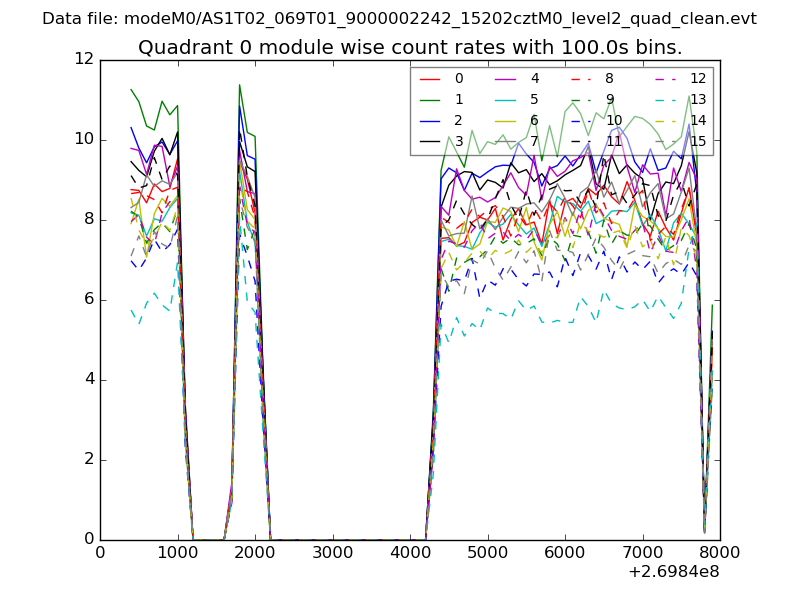
| Module-wise count rates for Quadrant A Data is divided into 100 sec bins |
 |
 |
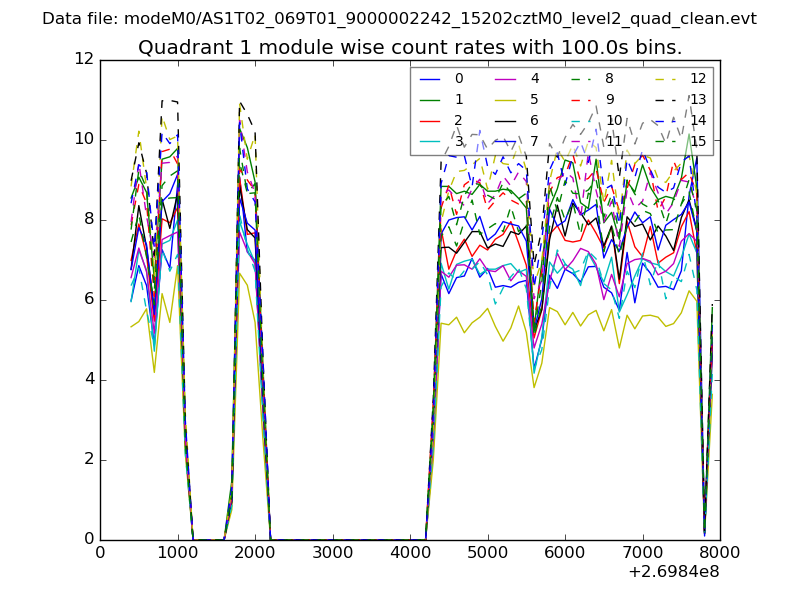
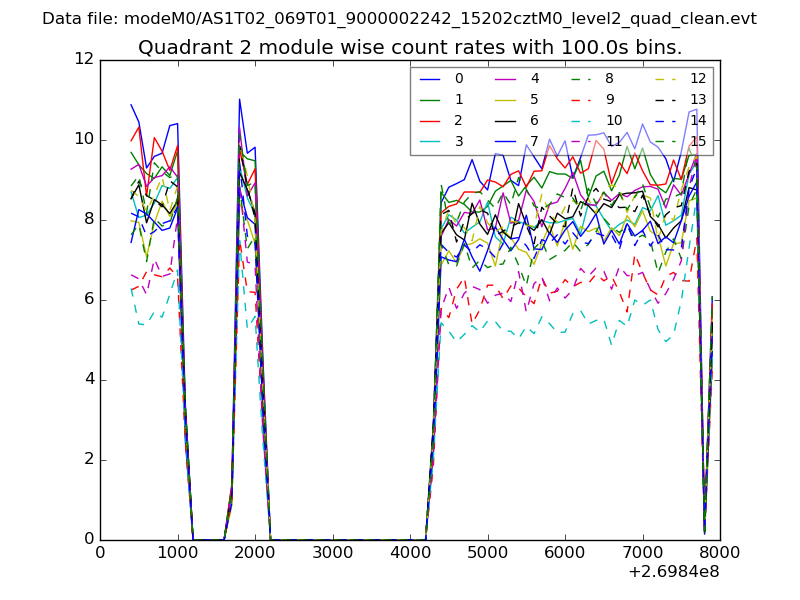
| Module-wise count rates for Quadrant B Data is divided into 100 sec bins |
 |
 |
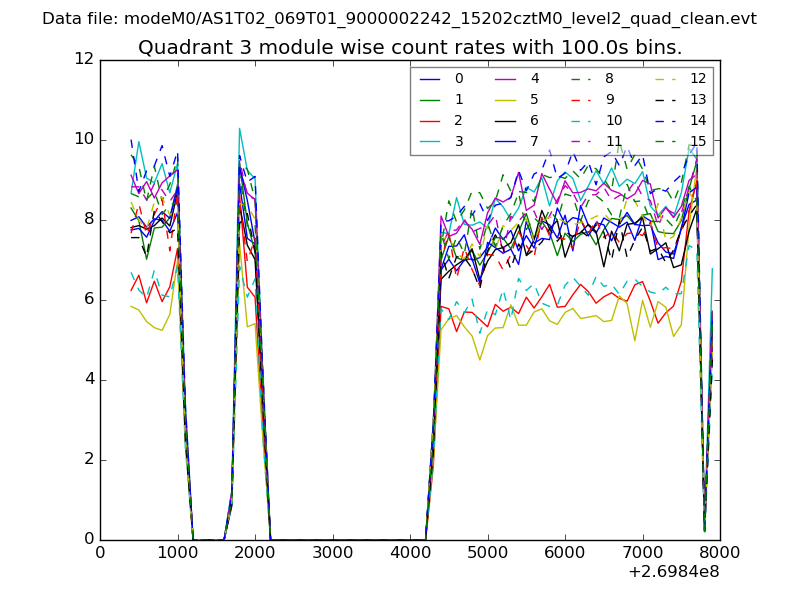
| Module-wise count rates for Quadrant C Data is divided into 100 sec bins |
 |
 |
| Module-wise count rates for Quadrant D Data is divided into 100 sec bins |
 |
 |
| Parameter | Plot |
|---|---|
| CZT HV Monitor | 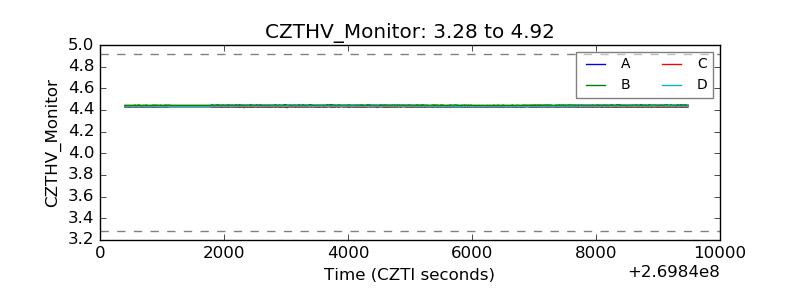 |
| D_VDD | 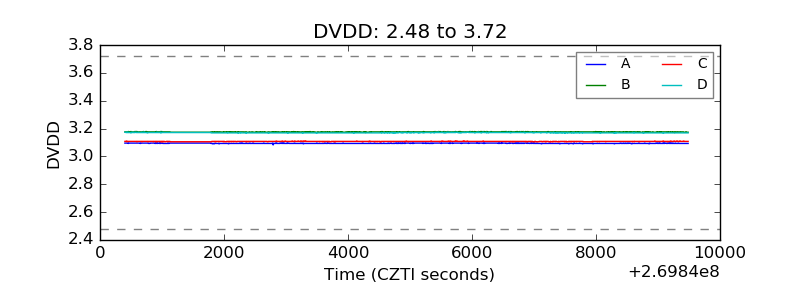 |
| Temperature 1 | 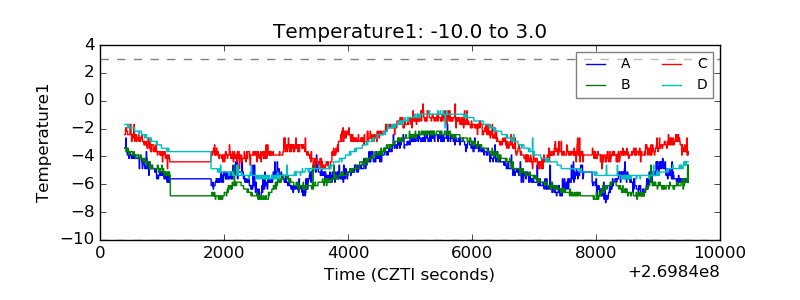 |
| Veto HV Monitor | 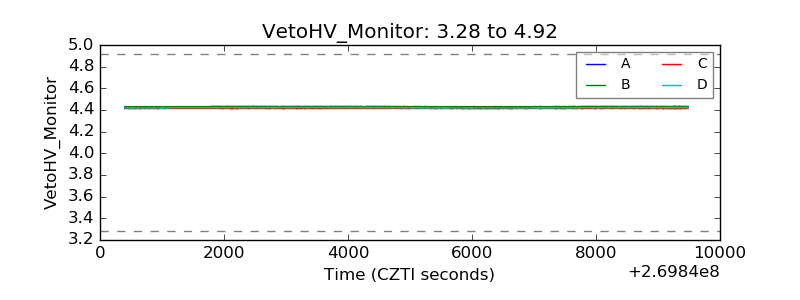 |
| Veto LLD | 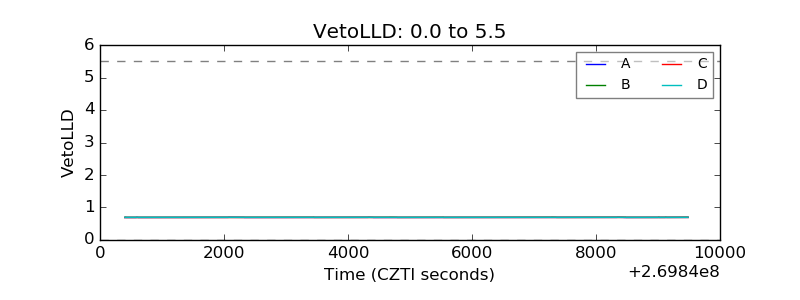 |
| Alpha Counter | 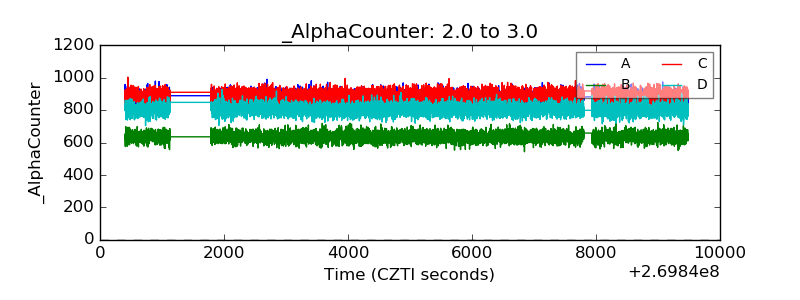 |
| _CPM_Rate | 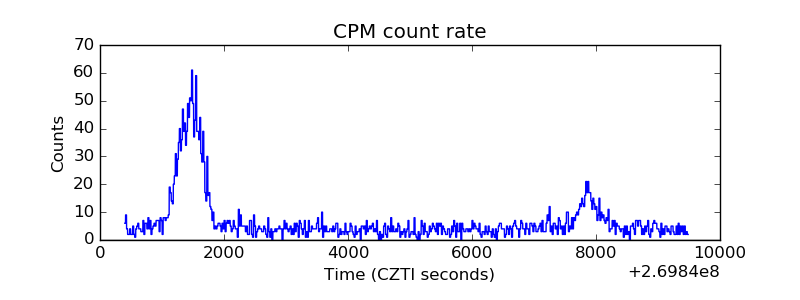 |
| CZT Counter | 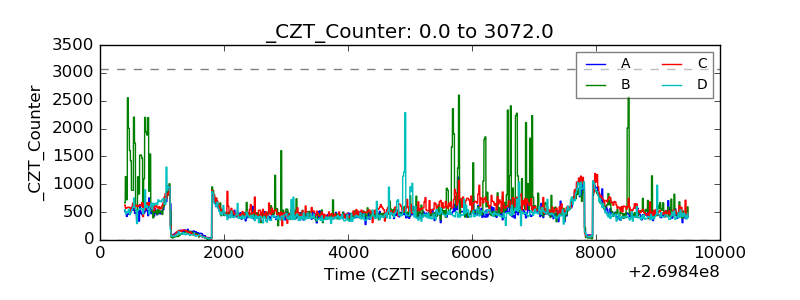 |
| +2.5 Volts monitor |  |
| +5 Volts monitor |  |
| _ROLL_ROT | 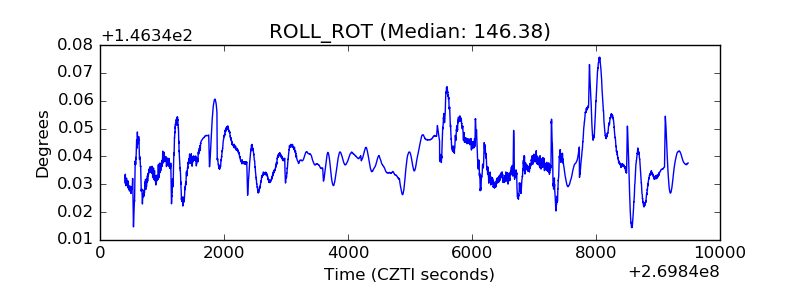 |
| _Roll_DEC | 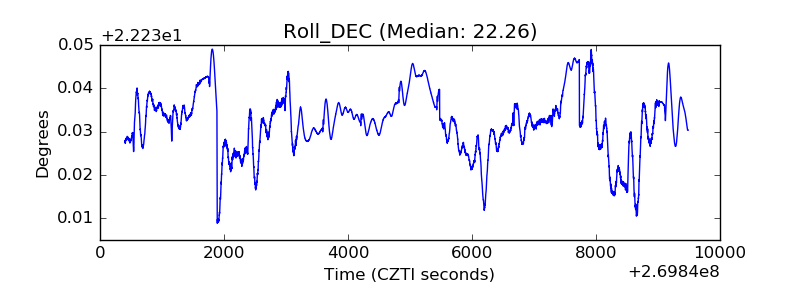 |
| _Roll_RA | 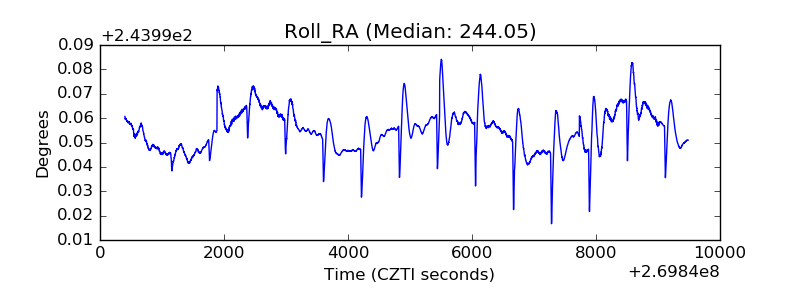 |
| Veto Counter | 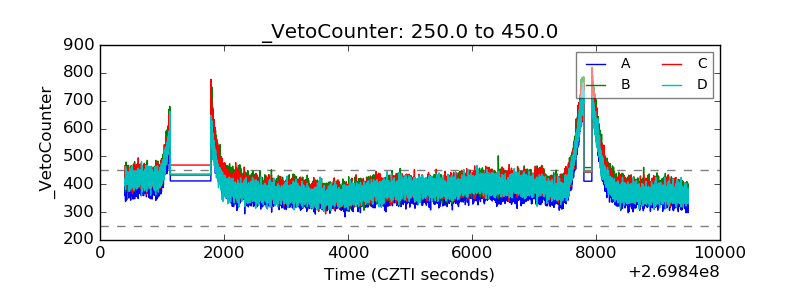 |