| Param | Original file | Final file |
|---|---|---|
| Filename | modeM0/AS1T02_069T01_9000002242_15203cztM0_level2.evt | modeM0/AS1T02_069T01_9000002242_15203cztM0_level2_quad_clean.evt |
| Size (bytes) | 710,809,920 | 88,580,160 |
| Size | 677.9 MB | 84.5 MB |
| Events in quadrant A | 4,363,860 | 539,091 |
| Events in quadrant B | 6,211,694 | 498,660 |
| Events in quadrant C | 6,247,988 | 534,349 |
| Events in quadrant D | 4,125,230 | 517,718 |
| Mode M0 | |||
|---|---|---|---|
| Quadrant | BADHDUFLAG | Total packets | Discarded packets |
| A | 0 | 18438 | 4 |
| B | 0 | 23852 | 3 |
| C | 0 | 23992 | 3 |
| D | 0 | 18273 | 3 |
| Mode SS | |||
|---|---|---|---|
| Quadrant | BADHDUFLAG | Total packets | Discarded packets |
| A | 0 | 174 | 0 |
| B | 0 | 174 | 0 |
| C | 0 | 174 | 0 |
| D | 0 | 174 | 0 |
| Mode M9 | |||
|---|---|---|---|
| Quadrant | BADHDUFLAG | Total packets | Discarded packets |
| A | 0 | 2 | 0 |
| B | 0 | 2 | 0 |
| C | 0 | 2 | 0 |
| D | 0 | 2 | 0 |
| Quadrant | Total seconds | Saturated seconds | Saturation percentage |
|---|---|---|---|
| A | 8524 | 434 | 5.091506% |
| B | 8524 | 1131 | 13.268419% |
| C | 8524 | 1326 | 15.556077% |
| D | 8524 | 296 | 3.472548% |
Noise dominated data is calculated using 1-second bins in cleaned event files. If a bin has >2000 counts, and if more than 50% of those come from <1% of pixels, then it is considered to be noise-dominated and hence unusable.
| Quadrant | # 1 sec bins | Bins with >0 counts | Bins with >2000 counts | High rate bins dominated by noise | Noise dominated (total time) | Noise dominated (detector-on time) | Marked lightcurve |
|---|---|---|---|---|---|---|---|
| A | 8765 | 8519 | 12 | 12 | 0.14% | 0.14% | 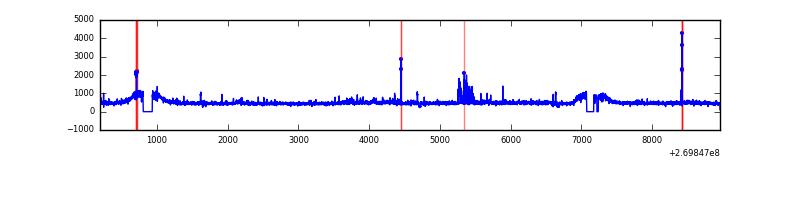 |
| B | 8765 | 8515 | 496 | 496 | 5.66% | 5.83% | 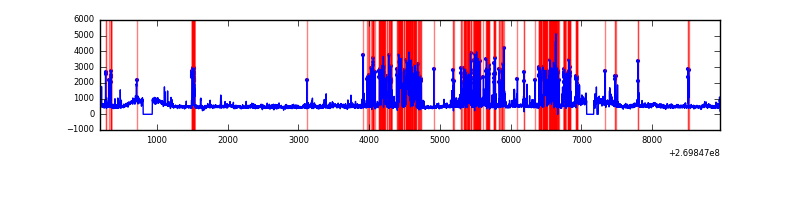 |
| C | 8764 | 8517 | 495 | 495 | 5.65% | 5.81% |  |
| D | 8765 | 8519 | 5 | 5 | 0.06% | 0.06% | 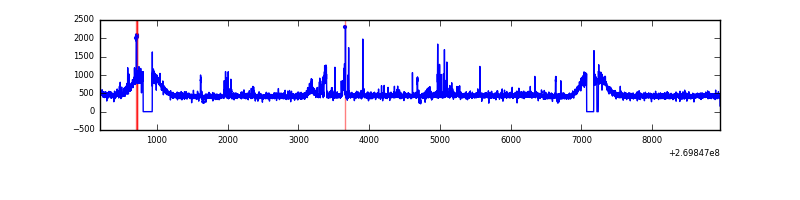 |
Top three noisy pixels from each quadrant. If the there are fewer than three noisy pixels in the level2.evt file, extra rows are filled as -1
| Pixel properties | Quadrant properties | ||||||
|---|---|---|---|---|---|---|---|
| Quadrant | DetID | PixID | Counts | Sigma | Mean | Median | Sigma |
| A | 12 | 189 | 166038 | 757.39 | 1066 | 1038 | 217.9 |
| A | 15 | 239 | 84148 | 381.5 | 1066 | 1038 | 217.9 |
| A | 9 | 143 | 14373 | 61.21 | 1066 | 1038 | 217.9 |
| B | 3 | 112 | 1879227 | 9239.69 | 1029 | 1002 | 203.3 |
| B | 0 | 229 | 165948 | 811.43 | 1029 | 1002 | 203.3 |
| B | 3 | 64 | 69524 | 337.09 | 1029 | 1002 | 203.3 |
| C | 3 | 233 | 2424055 | 10578.56 | 977 | 981 | 229.1 |
| C | 13 | 61 | 7109 | 26.75 | 977 | 981 | 229.1 |
| C | 14 | 234 | 5330 | 18.99 | 977 | 981 | 229.1 |
| D | 2 | 33 | 75634 | 289.59 | 1040 | 1006 | 257.7 |
| D | 13 | 172 | 40275 | 152.38 | 1040 | 1006 | 257.7 |
| D | 9 | 68 | 36359 | 137.19 | 1040 | 1006 | 257.7 |
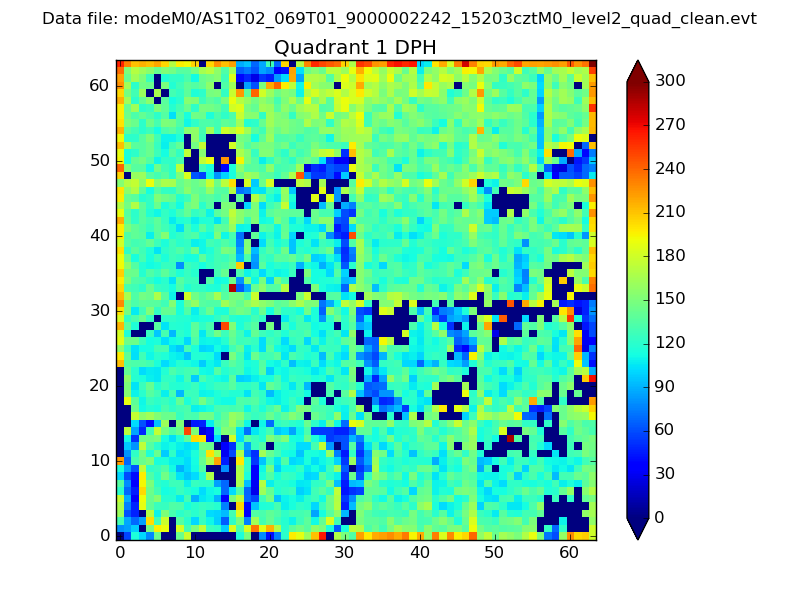
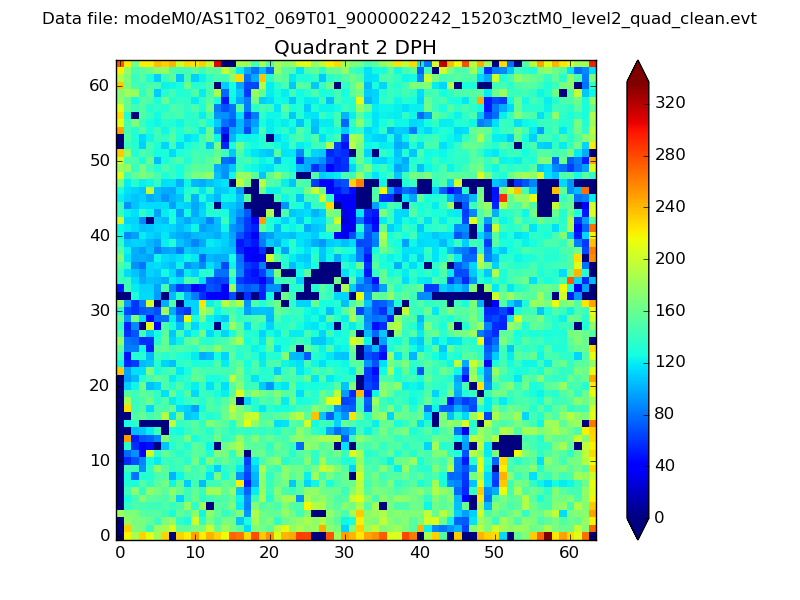
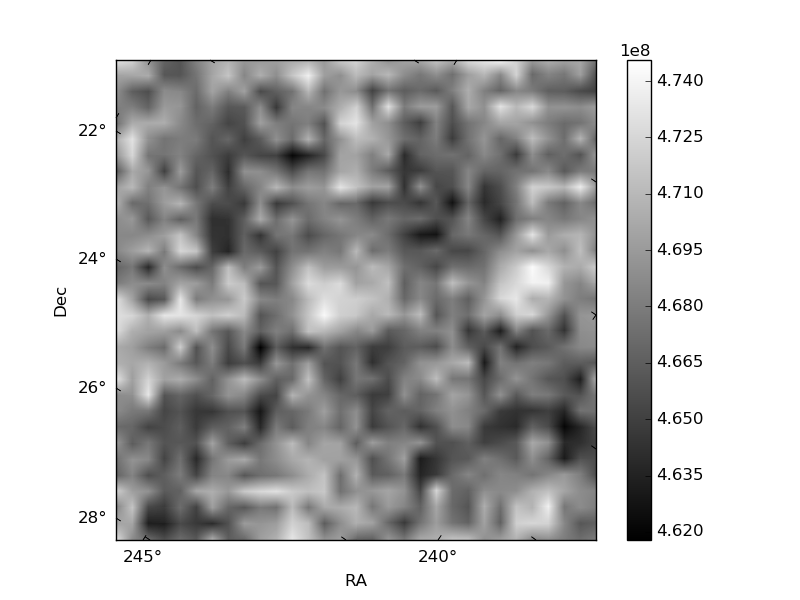
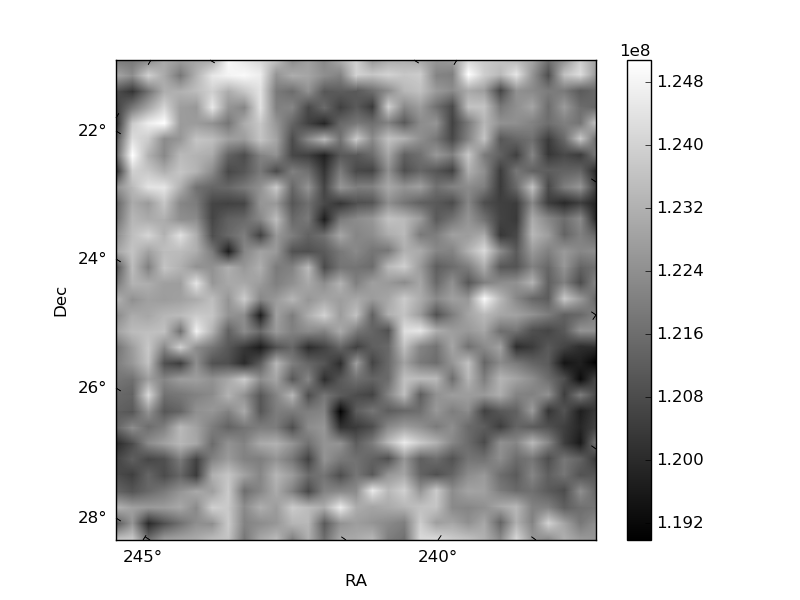
Histogram calculated using DETX and DETY for each event in the final _common_clean file
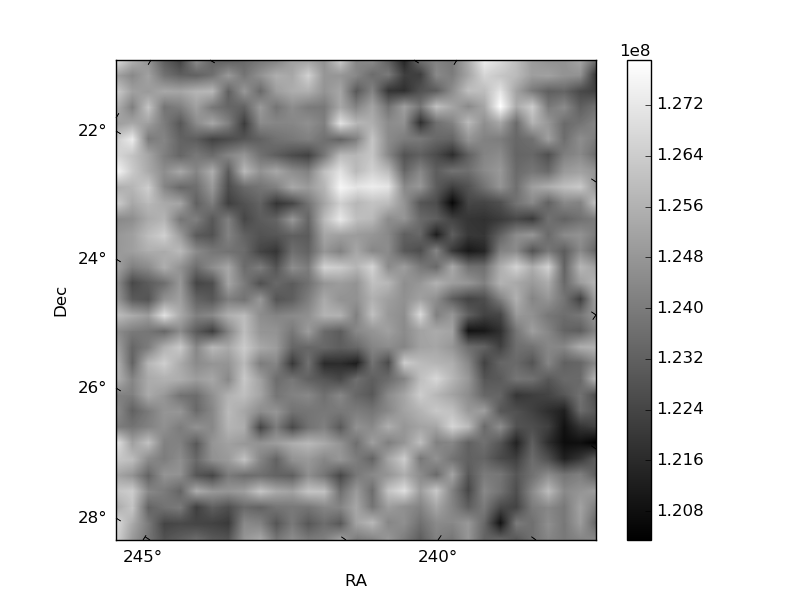
| Quadrant A | 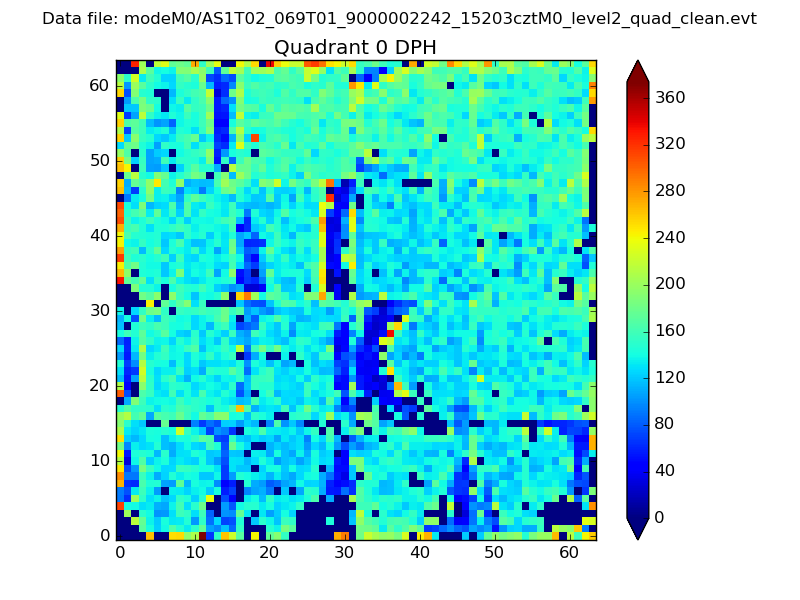 |
 |
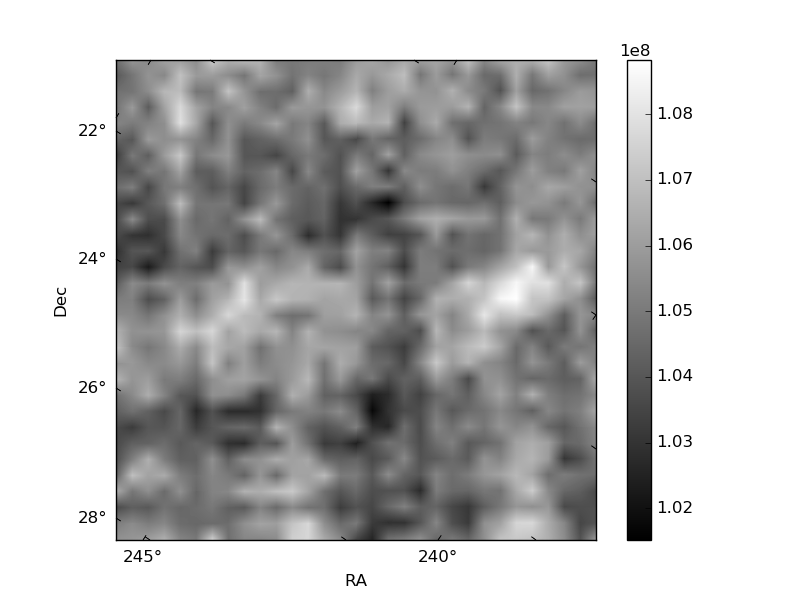
Quadrant B |
|---|---|---|---|
| Quadrant D | 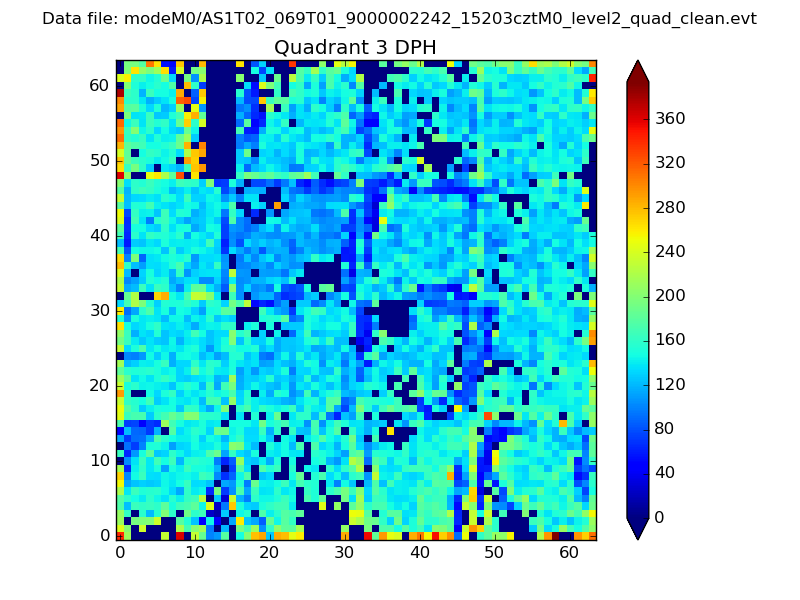 |
 |
Quadrant C |
| Plot type | Count rate plots | Images |
|---|---|---|
| Comparison with Poisson distribution Blue bars denote a histogram of data divided into 1 sec bins. Red curve is a Poisson curve with rate = median count rate of data. |
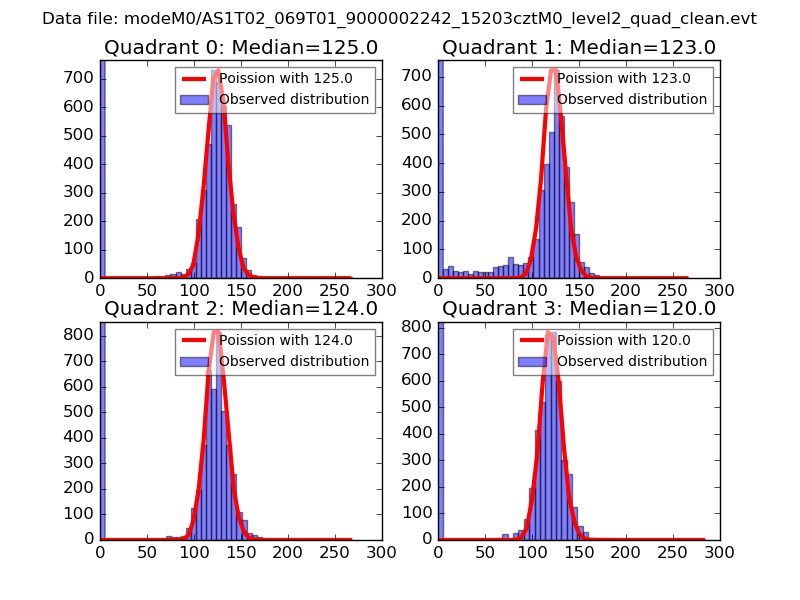 |
 |
| Quadrant-wise count rates Data is divided into 100 sec bins |
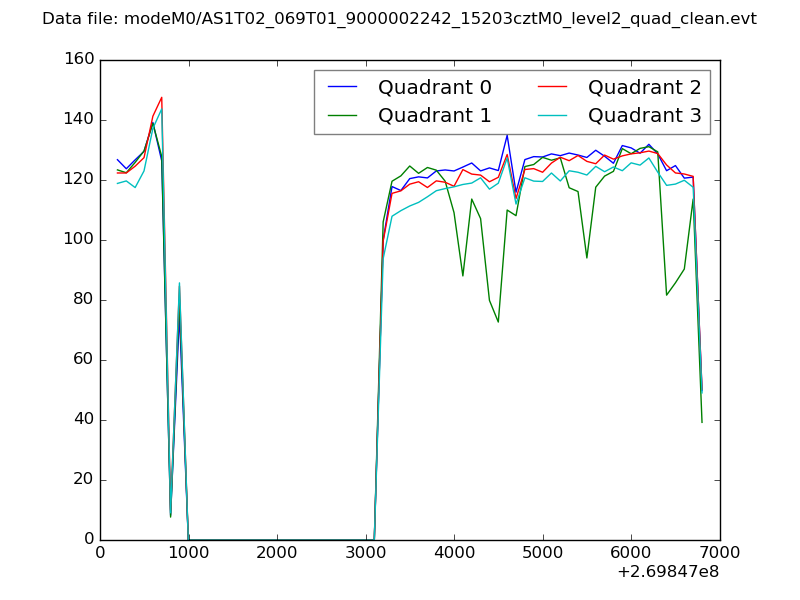 |
|
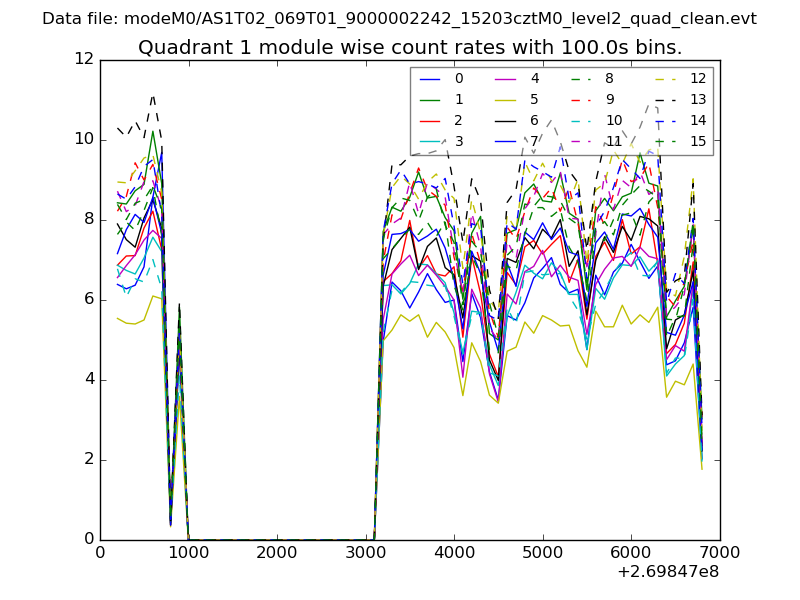
| Module-wise count rates for Quadrant A Data is divided into 100 sec bins |
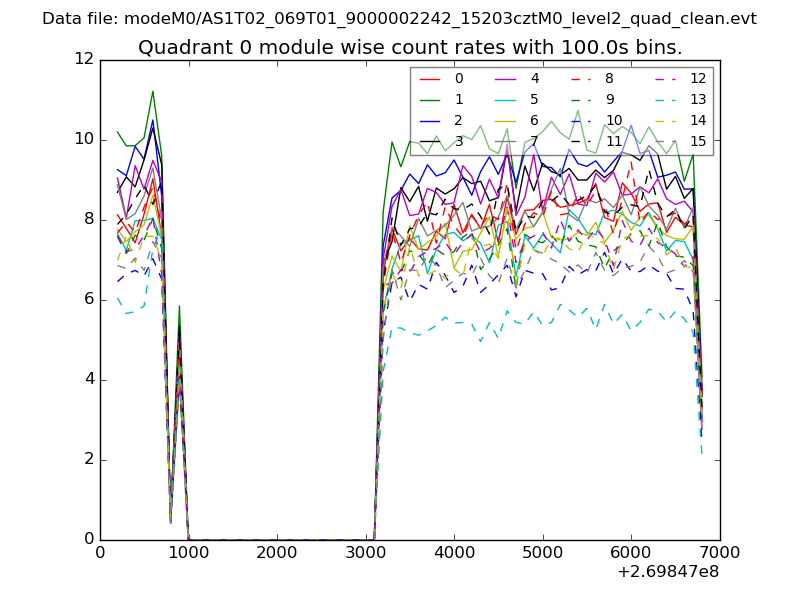 |
 |
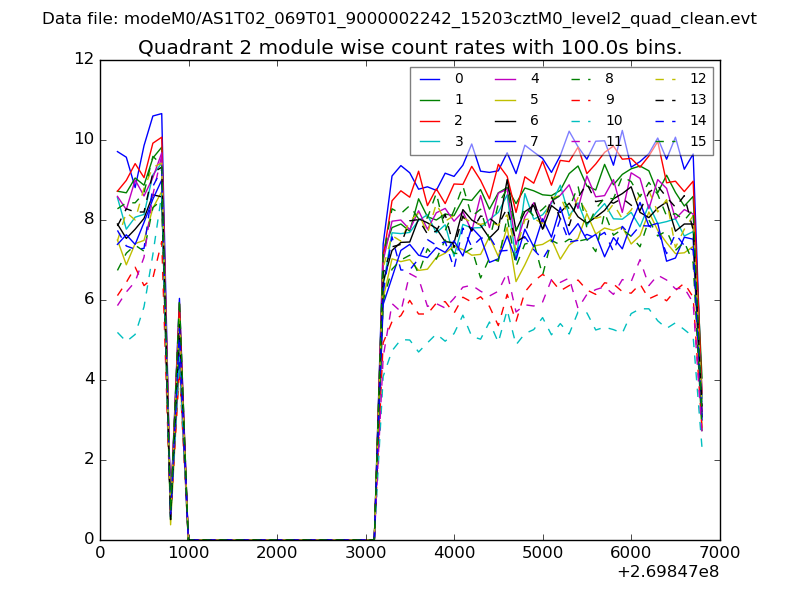
| Module-wise count rates for Quadrant B Data is divided into 100 sec bins |
 |
 |
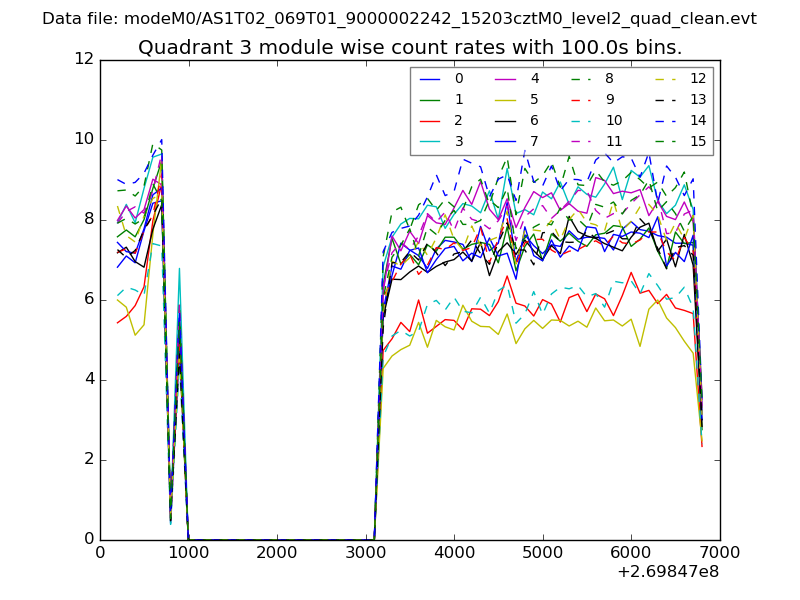
| Module-wise count rates for Quadrant C Data is divided into 100 sec bins |
 |
 |
| Module-wise count rates for Quadrant D Data is divided into 100 sec bins |
 |
 |
| Parameter | Plot |
|---|---|
| CZT HV Monitor | 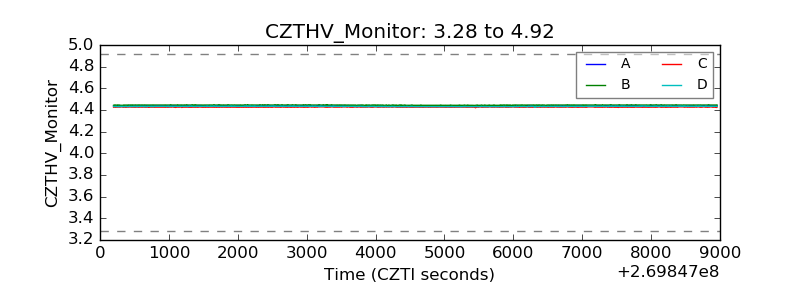 |
| D_VDD | 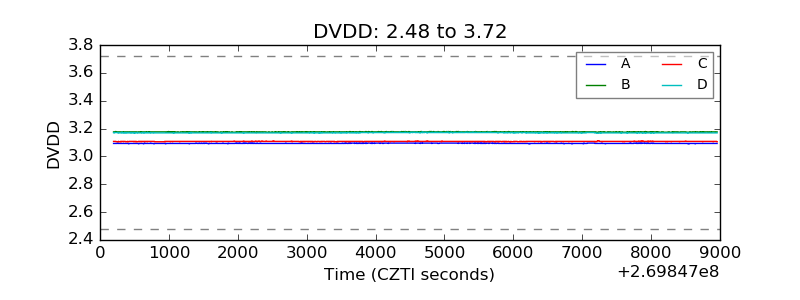 |
| Temperature 1 | 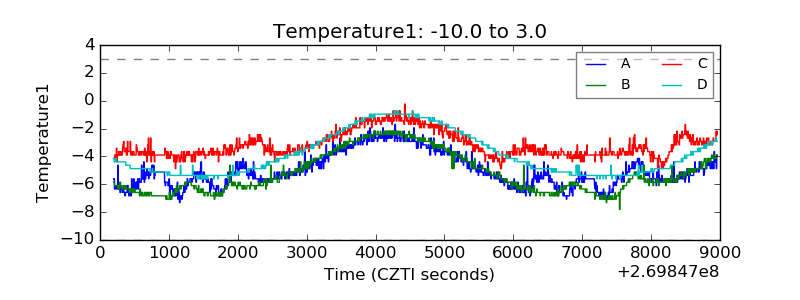 |
| Veto HV Monitor | 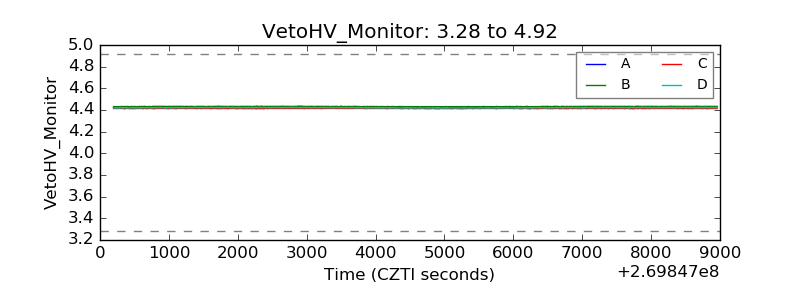 |
| Veto LLD | 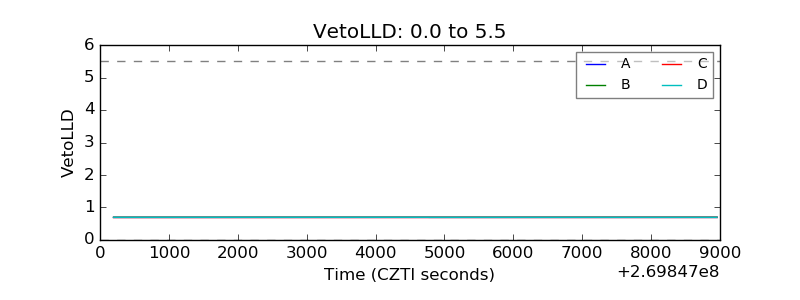 |
| Alpha Counter | 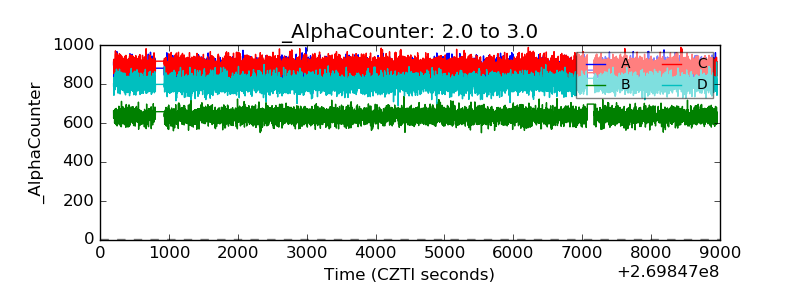 |
| _CPM_Rate | 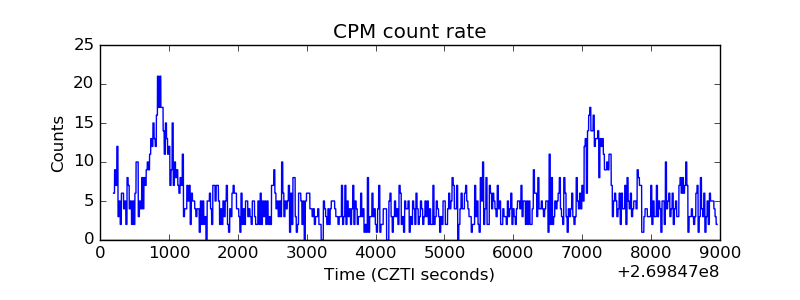 |
| CZT Counter | 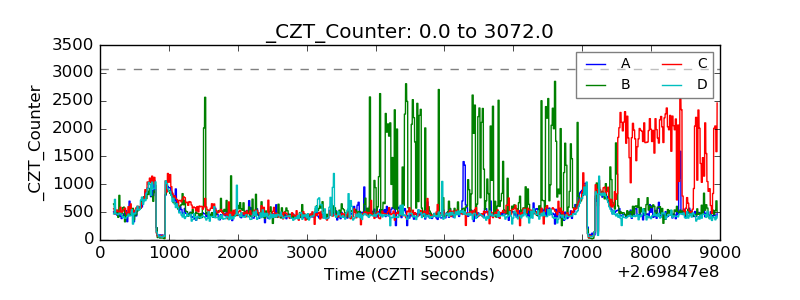 |
| +2.5 Volts monitor |  |
| +5 Volts monitor |  |
| _ROLL_ROT |  |
| _Roll_DEC | 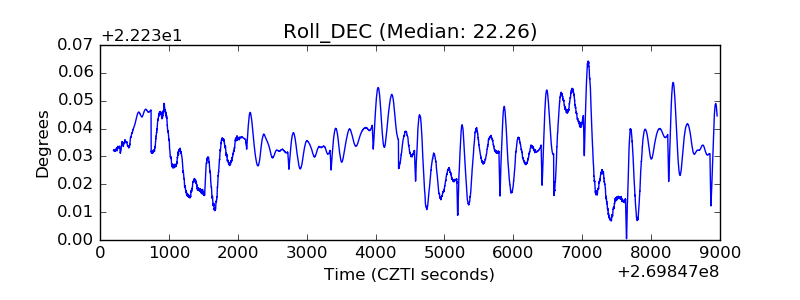 |
| _Roll_RA | 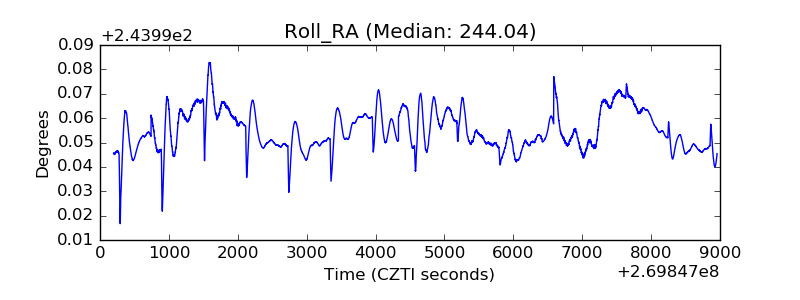 |
| Veto Counter | 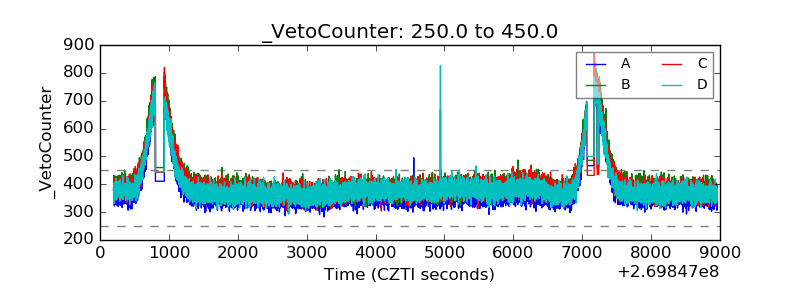 |