| Param | Original file | Final file |
|---|---|---|
| Filename | modeM0/AS1T02_069T01_9000002242_15206cztM0_level2.evt | modeM0/AS1T02_069T01_9000002242_15206cztM0_level2_quad_clean.evt |
| Size (bytes) | 1,212,108,480 | 185,264,640 |
| Size | 1.1 GB | 176.7 MB |
| Events in quadrant A | 7,537,319 | 1,173,103 |
| Events in quadrant B | 8,858,773 | 1,168,474 |
| Events in quadrant C | 11,676,942 | 1,104,841 |
| Events in quadrant D | 7,606,708 | 1,114,356 |
| Mode M0 | |||
|---|---|---|---|
| Quadrant | BADHDUFLAG | Total packets | Discarded packets |
| A | 0 | 31989 | 4 |
| B | 0 | 35911 | 4 |
| C | 0 | 44208 | 4 |
| D | 0 | 33192 | 4 |
| Mode SS | |||
|---|---|---|---|
| Quadrant | BADHDUFLAG | Total packets | Discarded packets |
| A | 0 | 312 | 0 |
| B | 0 | 312 | 0 |
| C | 0 | 312 | 0 |
| D | 0 | 312 | 0 |
| Mode M9 | |||
|---|---|---|---|
| Quadrant | BADHDUFLAG | Total packets | Discarded packets |
| A | 0 | 10 | 0 |
| B | 0 | 10 | 0 |
| C | 0 | 10 | 0 |
| D | 0 | 10 | 0 |
| Quadrant | Total seconds | Saturated seconds | Saturation percentage |
|---|---|---|---|
| A | 15212 | 400 | 2.629503% |
| B | 15212 | 719 | 4.726532% |
| C | 15212 | 1991 | 13.088351% |
| D | 15212 | 484 | 3.181699% |
Noise dominated data is calculated using 1-second bins in cleaned event files. If a bin has >2000 counts, and if more than 50% of those come from <1% of pixels, then it is considered to be noise-dominated and hence unusable.
| Quadrant | # 1 sec bins | Bins with >0 counts | Bins with >2000 counts | High rate bins dominated by noise | Noise dominated (total time) | Noise dominated (detector-on time) | Marked lightcurve |
|---|---|---|---|---|---|---|---|
| A | 16248 | 15215 | 10 | 10 | 0.06% | 0.07% | 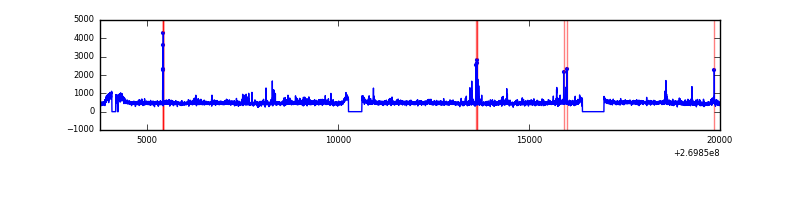 |
| B | 16248 | 15213 | 200 | 200 | 1.23% | 1.31% | 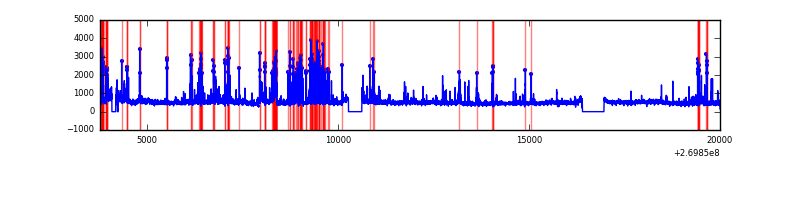 |
| C | 16248 | 15215 | 1098 | 1098 | 6.76% | 7.22% | 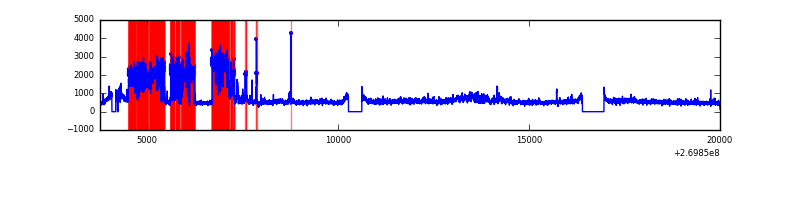 |
| D | 16248 | 15215 | 159 | 159 | 0.98% | 1.05% | 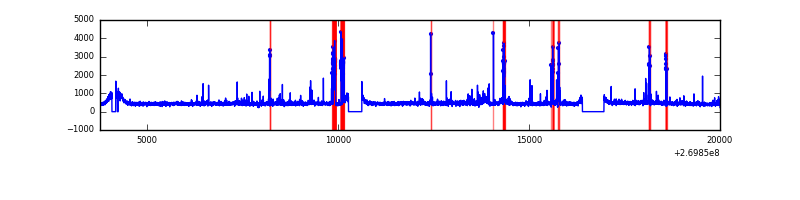 |
Top three noisy pixels from each quadrant. If the there are fewer than three noisy pixels in the level2.evt file, extra rows are filled as -1
| Pixel properties | Quadrant properties | ||||||
|---|---|---|---|---|---|---|---|
| Quadrant | DetID | PixID | Counts | Sigma | Mean | Median | Sigma |
| A | 12 | 189 | 390151 | 1051.14 | 1827 | 1785 | 369.5 |
| A | 13 | 248 | 88427 | 234.5 | 1827 | 1785 | 369.5 |
| A | 15 | 233 | 21493 | 53.34 | 1827 | 1785 | 369.5 |
| B | 3 | 112 | 1048007 | 3003.35 | 1813 | 1767 | 348.4 |
| B | 10 | 245 | 191446 | 544.5 | 1813 | 1767 | 348.4 |
| B | 0 | 229 | 181727 | 516.6 | 1813 | 1767 | 348.4 |
| C | 3 | 233 | 5117459 | 13122.68 | 1677 | 1682 | 389.8 |
| C | 7 | 247 | 24531 | 58.61 | 1677 | 1682 | 389.8 |
| C | 13 | 61 | 11927 | 26.28 | 1677 | 1682 | 389.8 |
| D | 2 | 33 | 499888 | 1148.8 | 1772 | 1719 | 433.6 |
| D | 13 | 172 | 137904 | 314.05 | 1772 | 1719 | 433.6 |
| D | 7 | 38 | 90593 | 204.95 | 1772 | 1719 | 433.6 |
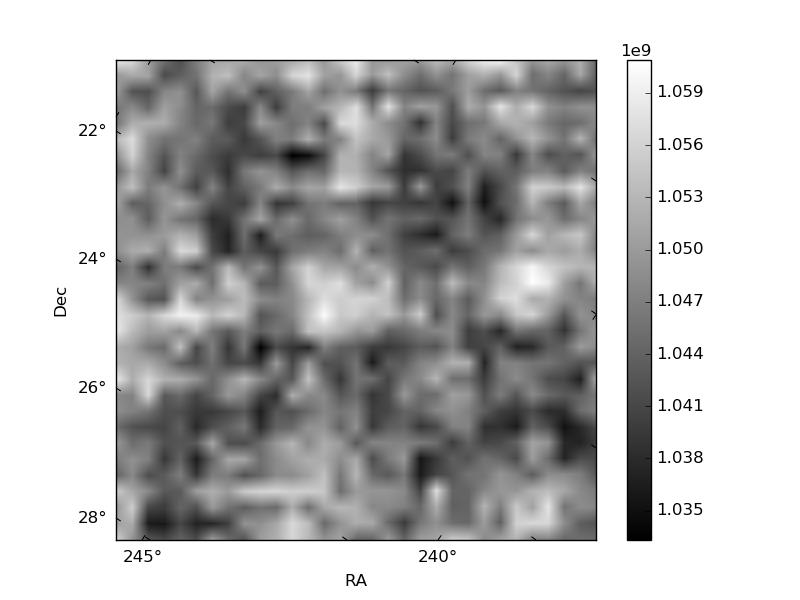
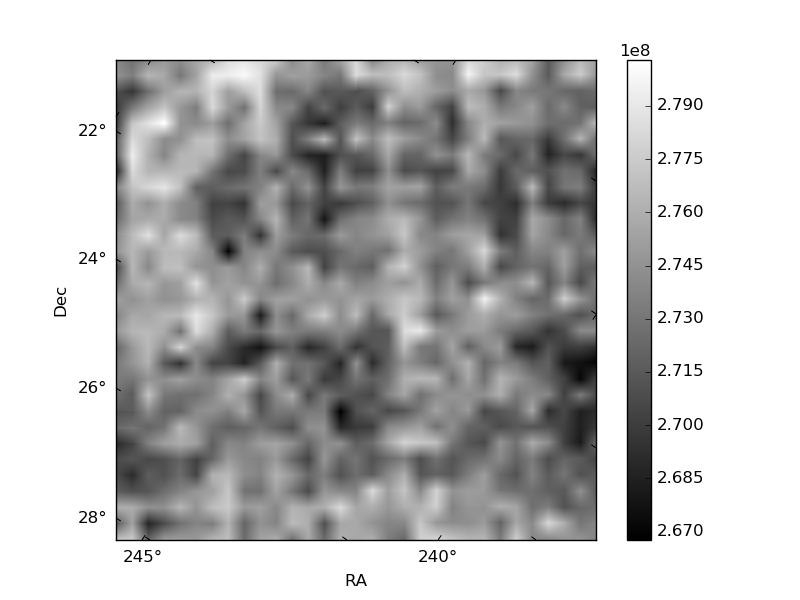
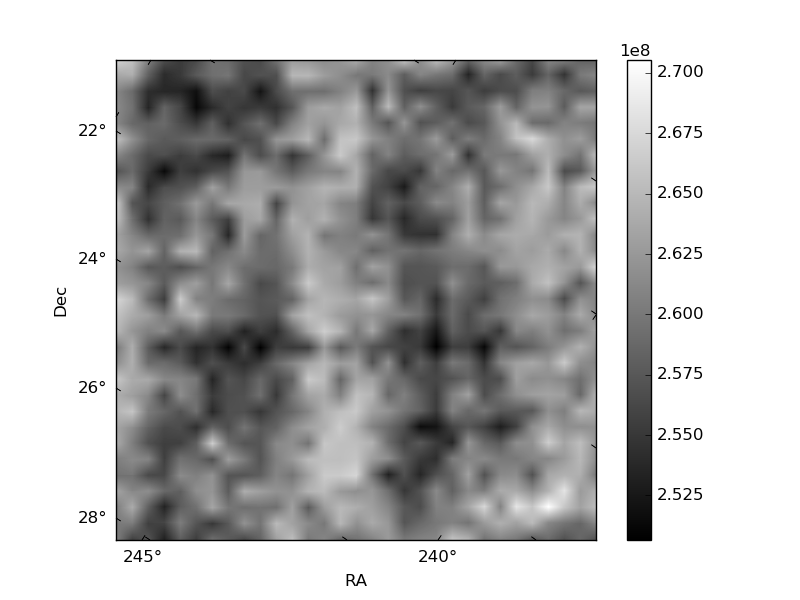
Histogram calculated using DETX and DETY for each event in the final _common_clean file
| Quadrant A | 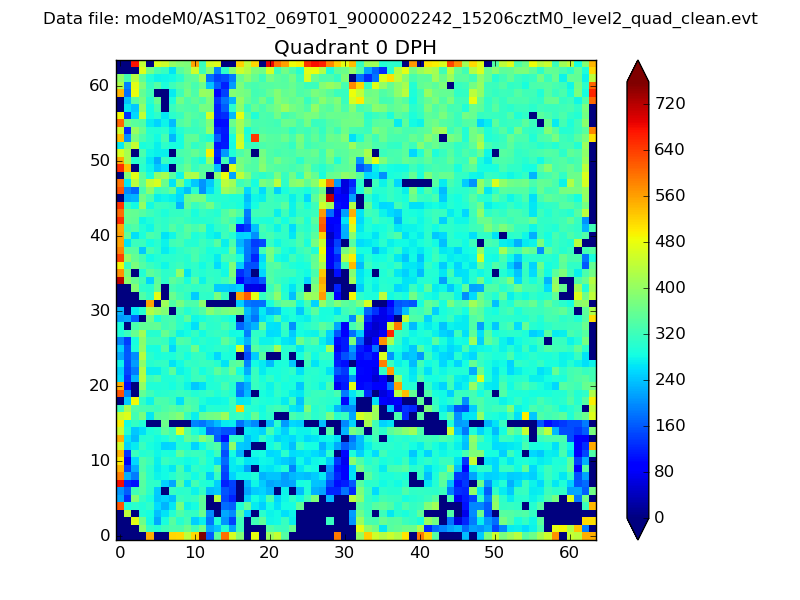 |
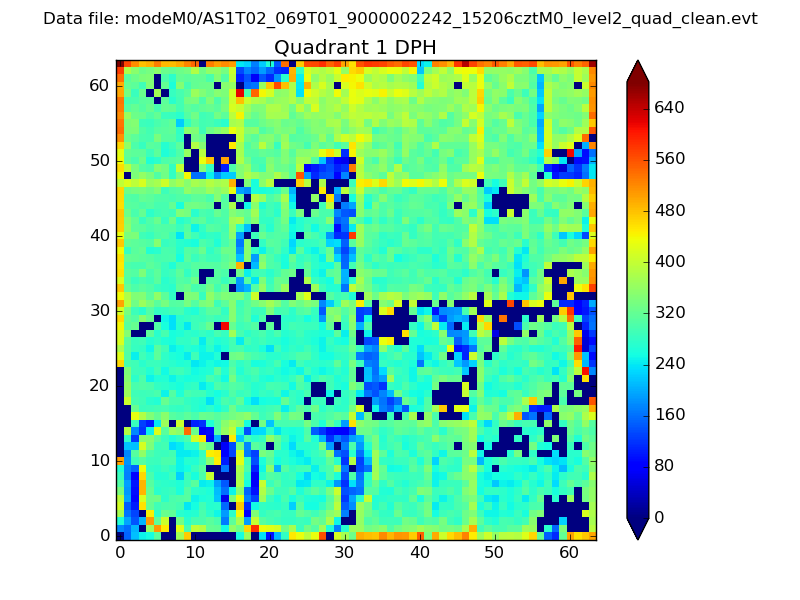 |
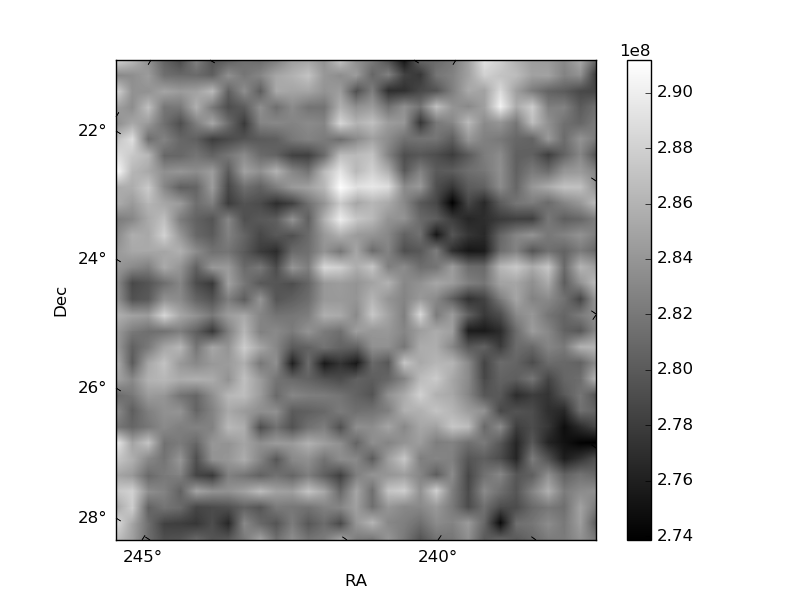
Quadrant B |
|---|---|---|---|
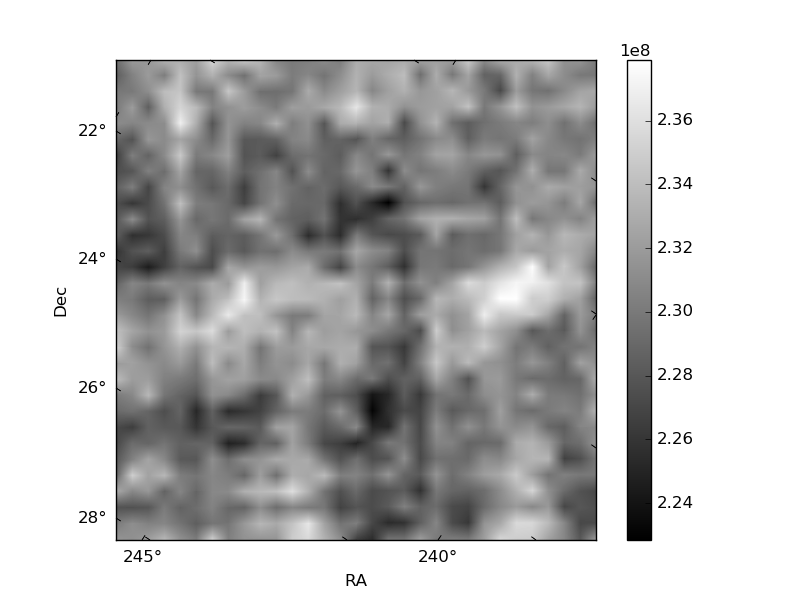
| Quadrant D | 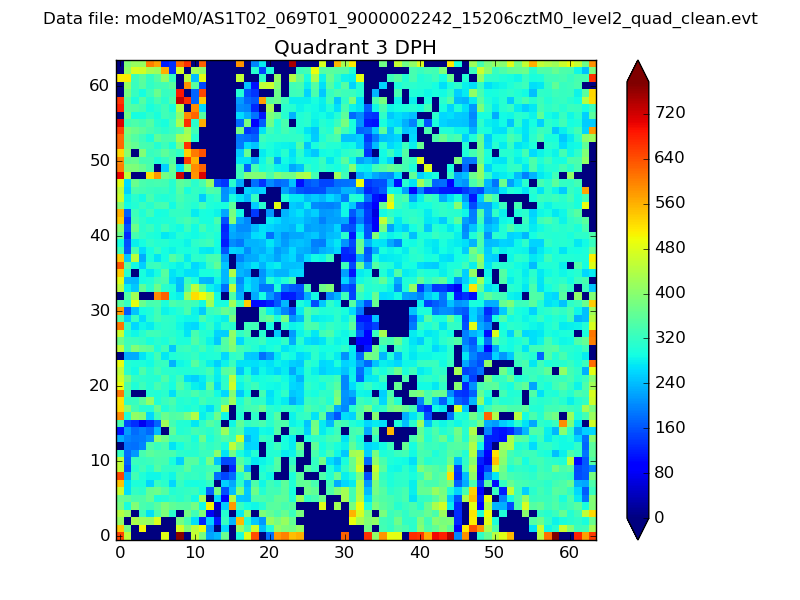 |
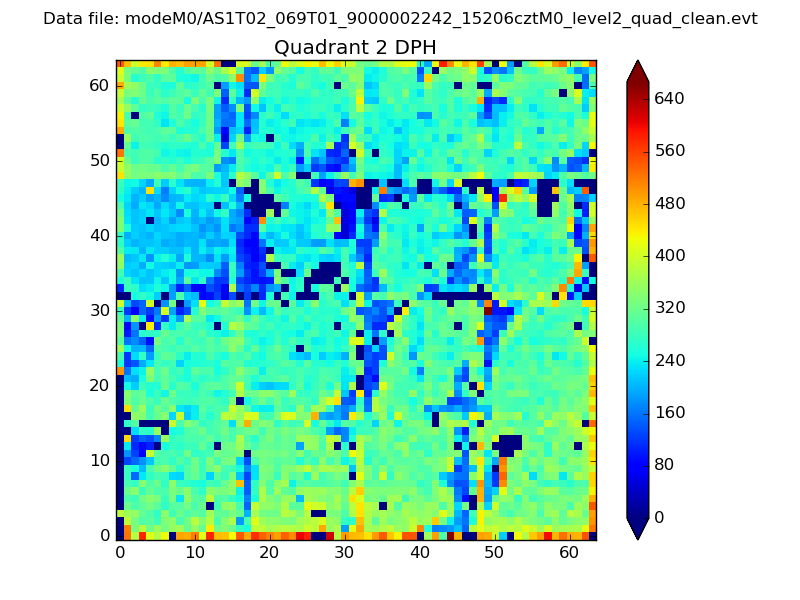 |
Quadrant C |
| Plot type | Count rate plots | Images |
|---|---|---|
| Comparison with Poisson distribution Blue bars denote a histogram of data divided into 1 sec bins. Red curve is a Poisson curve with rate = median count rate of data. |
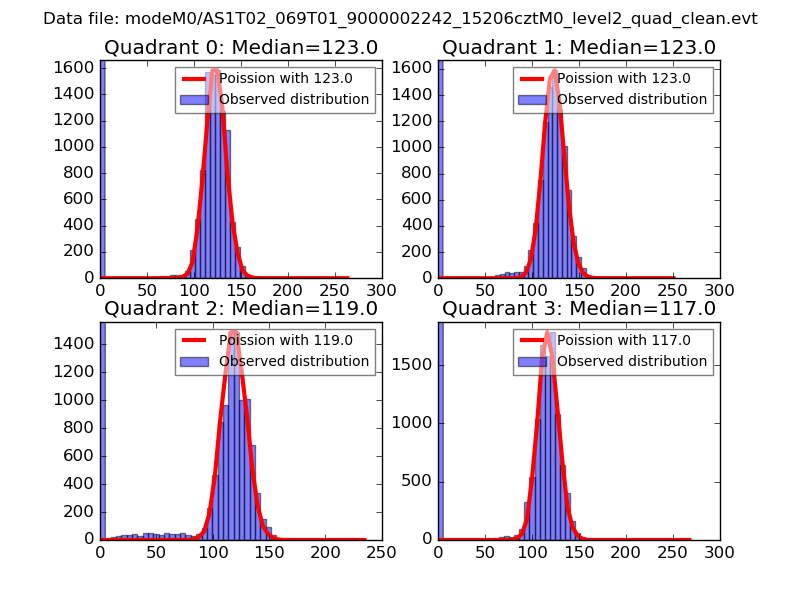 |
 |
| Quadrant-wise count rates Data is divided into 100 sec bins |
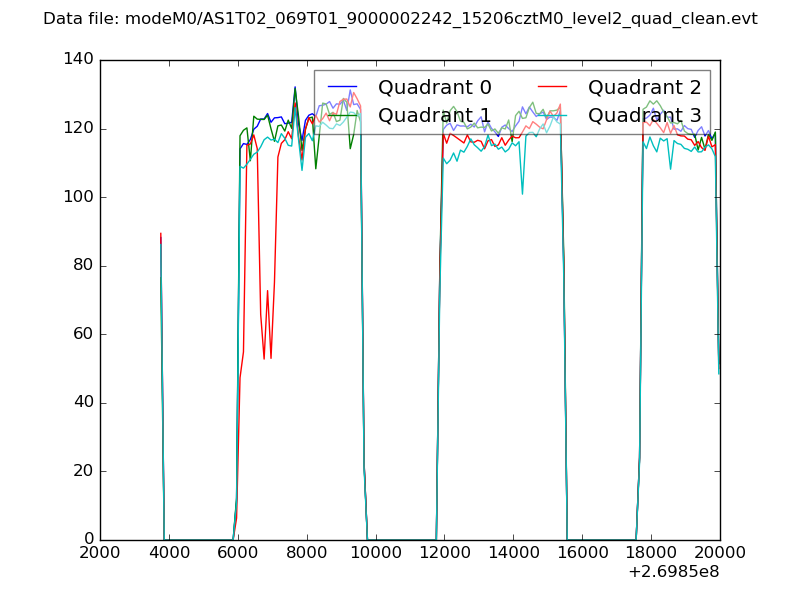 |
|
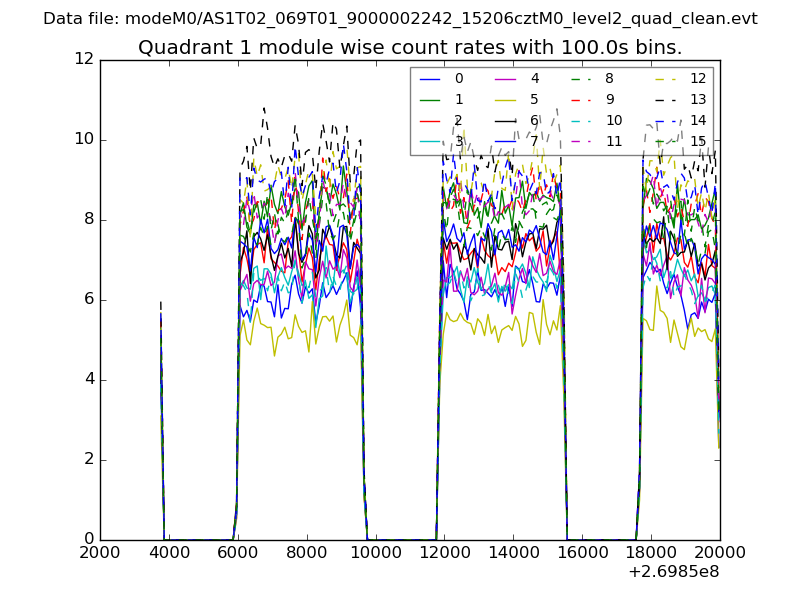
| Module-wise count rates for Quadrant A Data is divided into 100 sec bins |
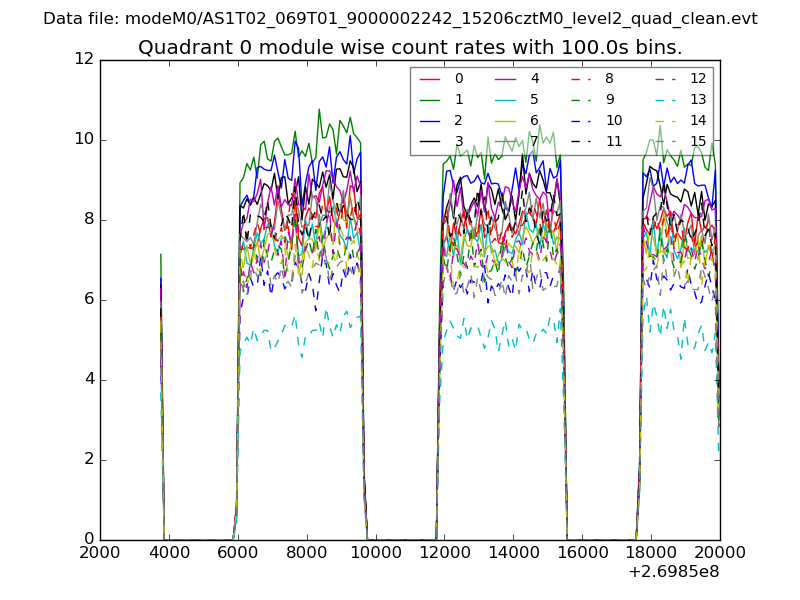 |
 |
| Module-wise count rates for Quadrant B Data is divided into 100 sec bins |
 |
 |
| Module-wise count rates for Quadrant C Data is divided into 100 sec bins |
 |
 |
| Module-wise count rates for Quadrant D Data is divided into 100 sec bins |
 |
 |
| Parameter | Plot |
|---|---|
| CZT HV Monitor | 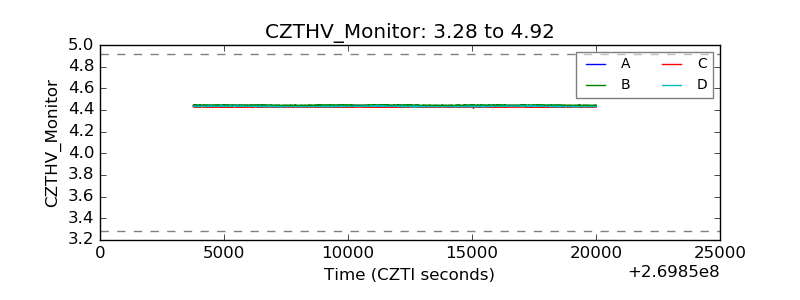 |
| D_VDD | 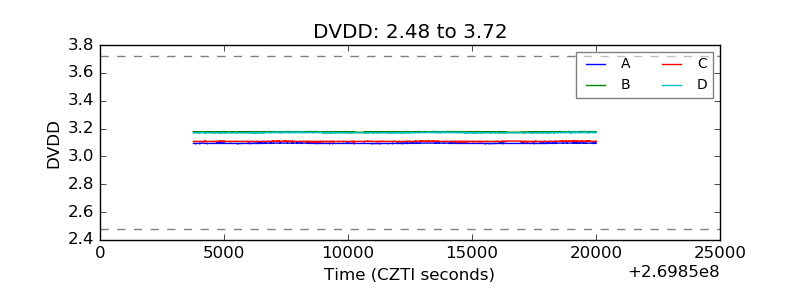 |
| Temperature 1 | 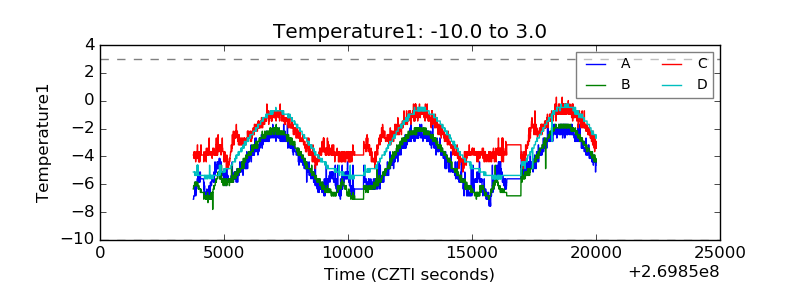 |
| Veto HV Monitor | 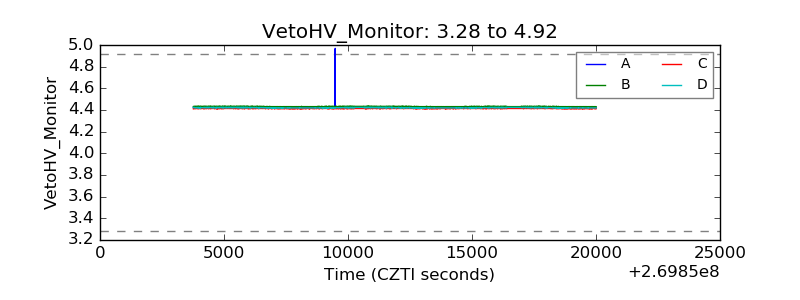 |
| Veto LLD | 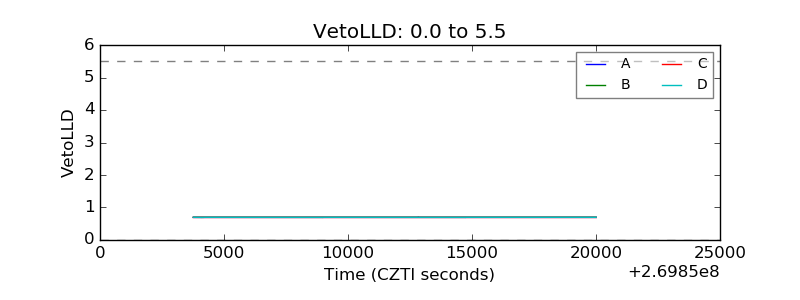 |
| Alpha Counter | 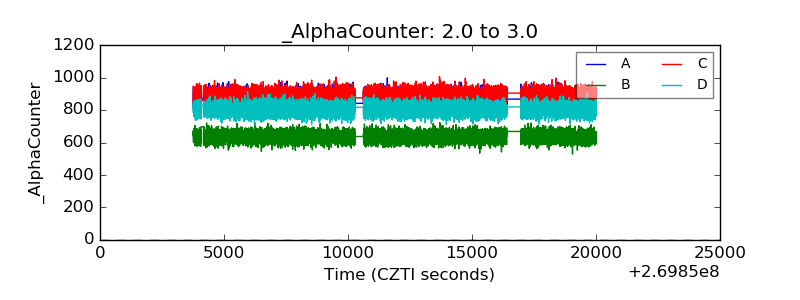 |
| _CPM_Rate | 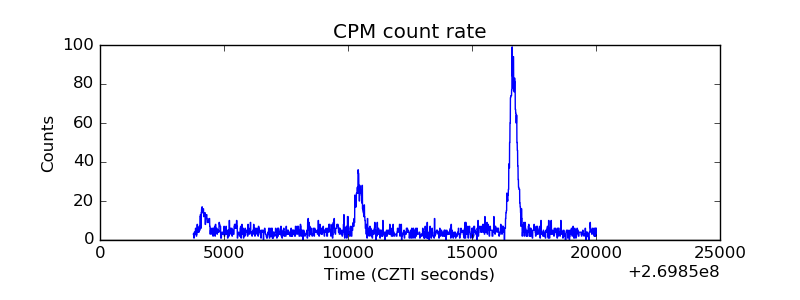 |
| CZT Counter | 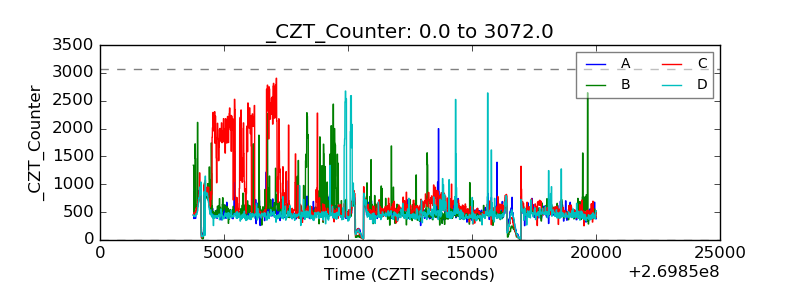 |
| +2.5 Volts monitor |  |
| +5 Volts monitor |  |
| _ROLL_ROT |  |
| _Roll_DEC | 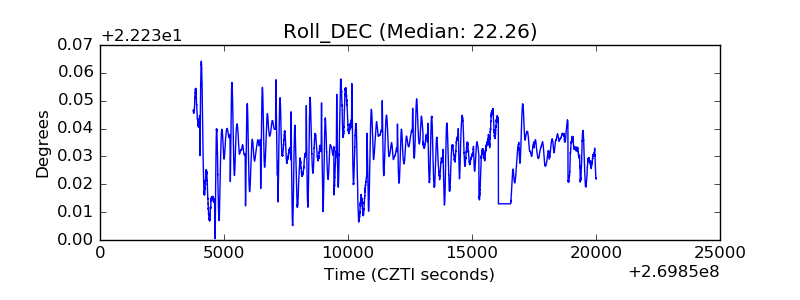 |
| _Roll_RA | 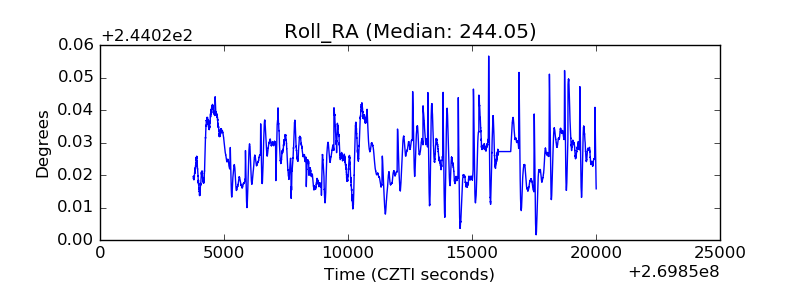 |
| Veto Counter |  |