| Param | Original file | Final file |
|---|---|---|
| Filename | modeM0/AS1T02_070T01_9000002244cztM0_level2.fits | modeM0/AS1T02_070T01_9000002244cztM0_level2_quad_clean.evt |
| Size (bytes) | 92,183,040 | 73,644,480 |
| Size | 87.9 MB | 70.2 MB |
| Events in quadrant A | 556,246 | 406,475 |
| Events in quadrant B | 528,920 | 403,645 |
| Events in quadrant C | 547,318 | 381,475 |
| Events in quadrant D | 480,136 | 358,513 |
| Mode M0 | |||
|---|---|---|---|
| Quadrant | BADHDUFLAG | Total packets | Discarded packets |
| A | 0 | 20284 | 0 |
| B | 0 | 22005 | 0 |
| C | 0 | 23436 | 0 |
| D | 0 | 20667 | 0 |
| Mode SS | |||
|---|---|---|---|
| Quadrant | BADHDUFLAG | Total packets | Discarded packets |
| A | 0 | 202 | 0 |
| B | 0 | 202 | 0 |
| C | 0 | 202 | 0 |
| D | 0 | 202 | 0 |
| Mode M9 | |||
|---|---|---|---|
| Quadrant | BADHDUFLAG | Total packets | Discarded packets |
| A | 0 | 16 | 0 |
| B | 0 | 16 | 0 |
| C | 0 | 16 | 0 |
| D | 0 | 16 | 0 |
| Quadrant | Total seconds | Saturated seconds | Saturation percentage |
|---|---|---|---|
| A | 9791 | 101 | 1.031560% |
| B | 9791 | 305 | 3.115106% |
| C | 9791 | 96 | 0.980492% |
| D | 9791 | 112 | 1.143908% |
Noise dominated data is calculated using 1-second bins in cleaned event files. If a bin has >2000 counts, and if more than 50% of those come from <1% of pixels, then it is considered to be noise-dominated and hence unusable.
| Quadrant | # 1 sec bins | Bins with >0 counts | Bins with >2000 counts | High rate bins dominated by noise | Noise dominated (total time) | Noise dominated (detector-on time) | Marked lightcurve |
|---|---|---|---|---|---|---|---|
| A | 11505 | 9798 | 0 | 0 | 0.00% | 0.00% |  |
| B | 11505 | 9787 | 0 | 0 | 0.00% | 0.00% |  |
| C | 11505 | 9798 | 0 | 0 | 0.00% | 0.00% |  |
| D | 11505 | 9798 | 0 | 0 | 0.00% | 0.00% |  |
Top three noisy pixels from each quadrant. If the there are fewer than three noisy pixels in the level2.evt file, extra rows are filled as -1
| Pixel properties | Quadrant properties | ||||||
|---|---|---|---|---|---|---|---|
| Quadrant | DetID | PixID | Counts | Sigma | Mean | Median | Sigma |
| A | 0 | 29 | 522 | 10.23 | 144 | 135 | 37.8 |
| A | 9 | 19 | 445 | 8.19 | 144 | 135 | 37.8 |
| A | 7 | 110 | 443 | 8.14 | 144 | 135 | 37.8 |
| B | 2 | 9 | 450 | 10.65 | 139 | 132 | 29.9 |
| B | 14 | 254 | 377 | 8.2 | 139 | 132 | 29.9 |
| B | 5 | 232 | 372 | 8.04 | 139 | 132 | 29.9 |
| C | 12 | 241 | 391 | 6.52 | 144 | 134 | 39.4 |
| C | 3 | 126 | 390 | 6.49 | 144 | 134 | 39.4 |
| C | 2 | 191 | 379 | 6.22 | 144 | 134 | 39.4 |
| D | 3 | 14 | 382 | 6.77 | 136 | 124 | 38.1 |
| D | 1 | 19 | 364 | 6.3 | 136 | 124 | 38.1 |
| D | 10 | 189 | 347 | 5.85 | 136 | 124 | 38.1 |
Histogram calculated using DETX and DETY for each event in the final _common_clean file
| Quadrant A |  |
 |
Quadrant B |
|---|---|---|---|
| Quadrant D |  |
 |
Quadrant C |
| Plot type | Count rate plots | Images |
|---|---|---|
| Comparison with Poisson distribution Blue bars denote a histogram of data divided into 1 sec bins. Red curve is a Poisson curve with rate = median count rate of data. |
 |
 |
| Quadrant-wise count rates Data is divided into 100 sec bins |
 |
|
| Module-wise count rates for Quadrant A Data is divided into 100 sec bins |
 |
 |
| Module-wise count rates for Quadrant B Data is divided into 100 sec bins |
 |
 |
| Module-wise count rates for Quadrant C Data is divided into 100 sec bins |
 |
 |
| Module-wise count rates for Quadrant D Data is divided into 100 sec bins |
 |
 |
| Parameter | Plot |
|---|---|
| CZT HV Monitor |  |
| D_VDD | 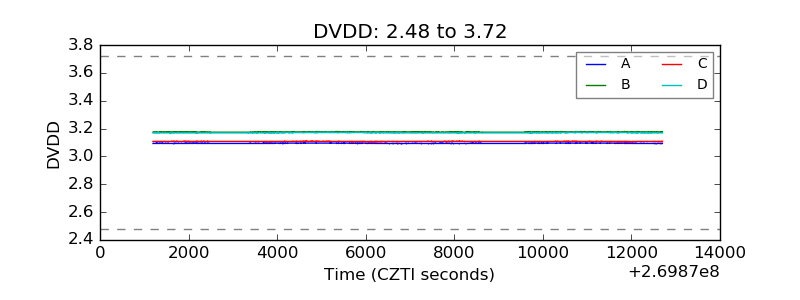 |
| Temperature 1 |  |
| Veto HV Monitor |  |
| Veto LLD |  |
| Alpha Counter |  |
| _CPM_Rate |  |
| CZT Counter |  |
| +2.5 Volts monitor |  |
| +5 Volts monitor |  |
| _ROLL_ROT |  |
| _Roll_DEC |  |
| _Roll_RA |  |
| Veto Counter |  |