| Param | Original file | Final file |
|---|---|---|
| Filename | modeM0/AS1T02_070T01_9000002244_15206cztM0_level2.evt | modeM0/AS1T02_070T01_9000002244_15206cztM0_level2_quad_clean.evt |
| Size (bytes) | 202,944,960 | 31,176,000 |
| Size | 193.5 MB | 29.7 MB |
| Events in quadrant A | 1,395,982 | 187,293 |
| Events in quadrant B | 1,431,537 | 190,713 |
| Events in quadrant C | 1,644,373 | 185,364 |
| Events in quadrant D | 1,480,438 | 178,387 |
| Mode M0 | |||
|---|---|---|---|
| Quadrant | BADHDUFLAG | Total packets | Discarded packets |
| A | 0 | 5859 | 2 |
| B | 0 | 5937 | 1 |
| C | 0 | 6551 | 1 |
| D | 0 | 6239 | 1 |
| Mode SS | |||
|---|---|---|---|
| Quadrant | BADHDUFLAG | Total packets | Discarded packets |
| A | 0 | 58 | 0 |
| B | 0 | 58 | 0 |
| C | 0 | 58 | 0 |
| D | 0 | 58 | 0 |
| Mode M9 | |||
|---|---|---|---|
| Quadrant | BADHDUFLAG | Total packets | Discarded packets |
| A | 0 | 7 | 0 |
| B | 0 | 7 | 0 |
| C | 0 | 7 | 0 |
| D | 0 | 7 | 0 |
| Quadrant | Total seconds | Saturated seconds | Saturation percentage |
|---|---|---|---|
| A | 2823 | 53 | 1.877435% |
| B | 2823 | 52 | 1.842012% |
| C | 2823 | 51 | 1.806589% |
| D | 2823 | 66 | 2.337938% |
Noise dominated data is calculated using 1-second bins in cleaned event files. If a bin has >2000 counts, and if more than 50% of those come from <1% of pixels, then it is considered to be noise-dominated and hence unusable.
| Quadrant | # 1 sec bins | Bins with >0 counts | Bins with >2000 counts | High rate bins dominated by noise | Noise dominated (total time) | Noise dominated (detector-on time) | Marked lightcurve |
|---|---|---|---|---|---|---|---|
| A | 3598 | 2833 | 0 | 0 | 0.00% | 0.00% | 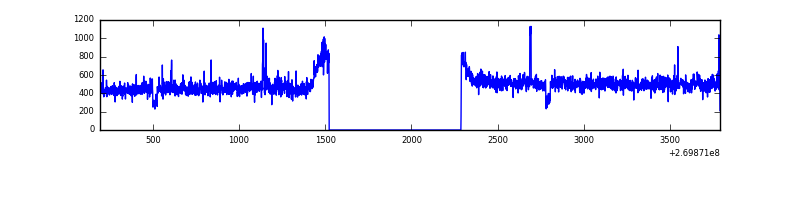 |
| B | 3598 | 2833 | 0 | 0 | 0.00% | 0.00% | 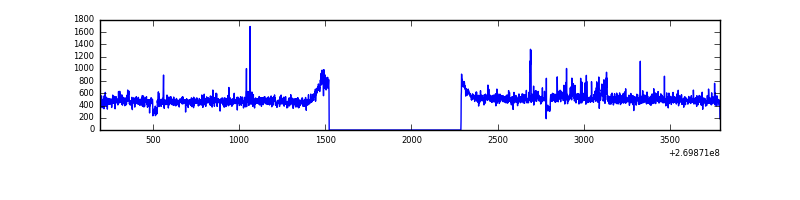 |
| C | 3598 | 2833 | 0 | 0 | 0.00% | 0.00% | 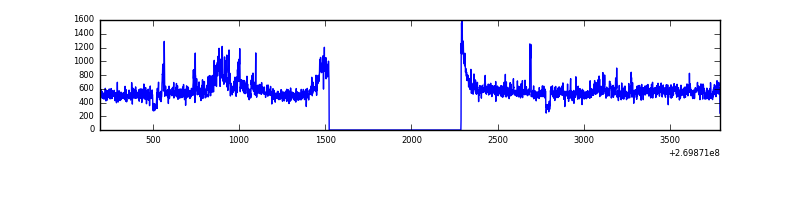 |
| D | 3598 | 2833 | 27 | 27 | 0.75% | 0.95% | 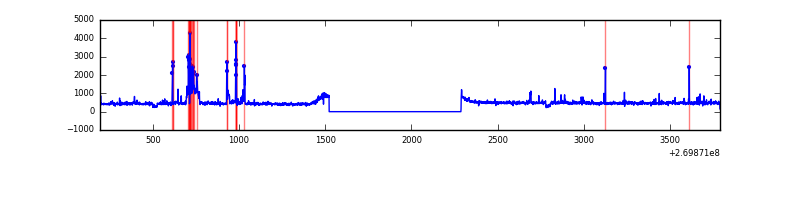 |
Top three noisy pixels from each quadrant. If the there are fewer than three noisy pixels in the level2.evt file, extra rows are filled as -1
| Pixel properties | Quadrant properties | ||||||
|---|---|---|---|---|---|---|---|
| Quadrant | DetID | PixID | Counts | Sigma | Mean | Median | Sigma |
| A | 12 | 189 | 31597 | 423.25 | 354 | 345 | 73.8 |
| A | 0 | 226 | 3215 | 38.87 | 354 | 345 | 73.8 |
| A | 12 | 194 | 2529 | 29.58 | 354 | 345 | 73.8 |
| B | 0 | 189 | 20930 | 291.7 | 352 | 343 | 70.6 |
| B | 0 | 214 | 14133 | 195.4 | 352 | 343 | 70.6 |
| B | 12 | 111 | 8177 | 111.0 | 352 | 343 | 70.6 |
| C | 3 | 233 | 316158 | 3929.29 | 340 | 341 | 80.4 |
| C | 7 | 247 | 3082 | 34.1 | 340 | 341 | 80.4 |
| C | 13 | 61 | 2414 | 25.79 | 340 | 341 | 80.4 |
| D | 2 | 33 | 157836 | 1847.66 | 342 | 331 | 85.2 |
| D | 2 | 234 | 10673 | 121.32 | 342 | 331 | 85.2 |
| D | 13 | 249 | 9543 | 108.06 | 342 | 331 | 85.2 |
Histogram calculated using DETX and DETY for each event in the final _common_clean file
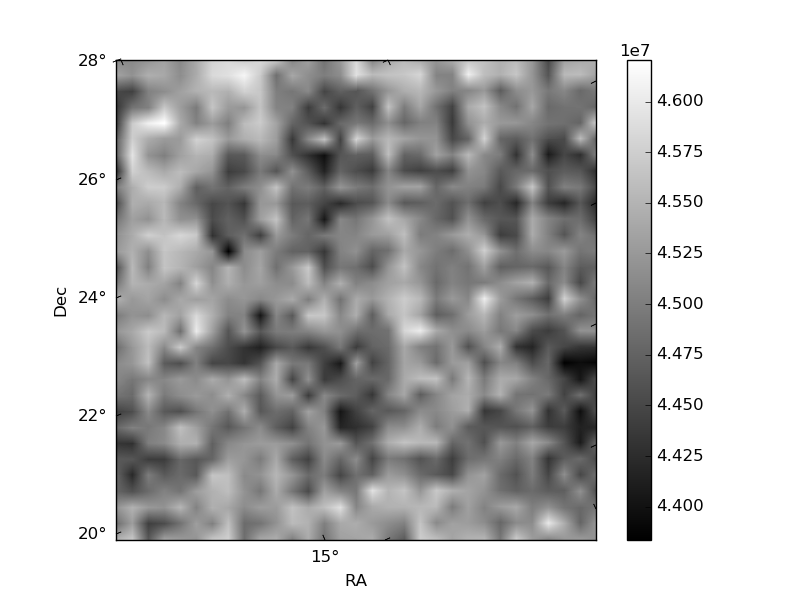
| Quadrant A | 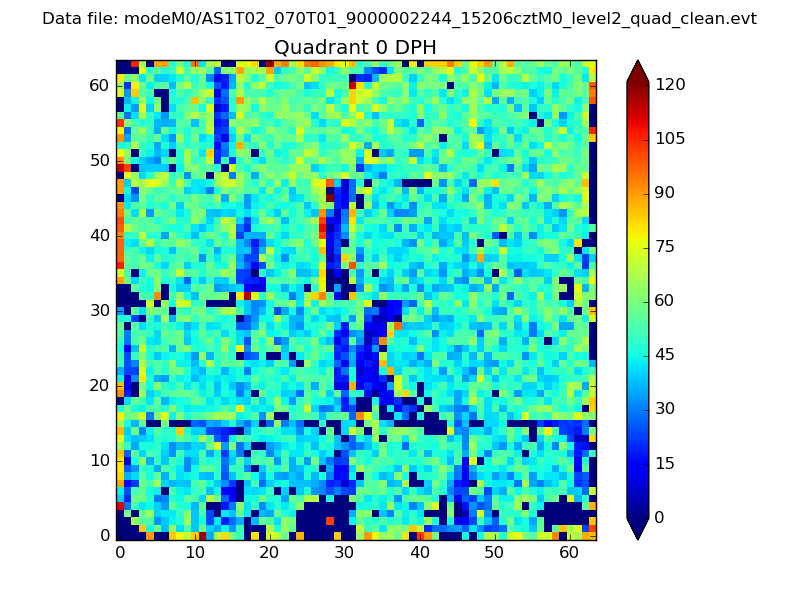 |
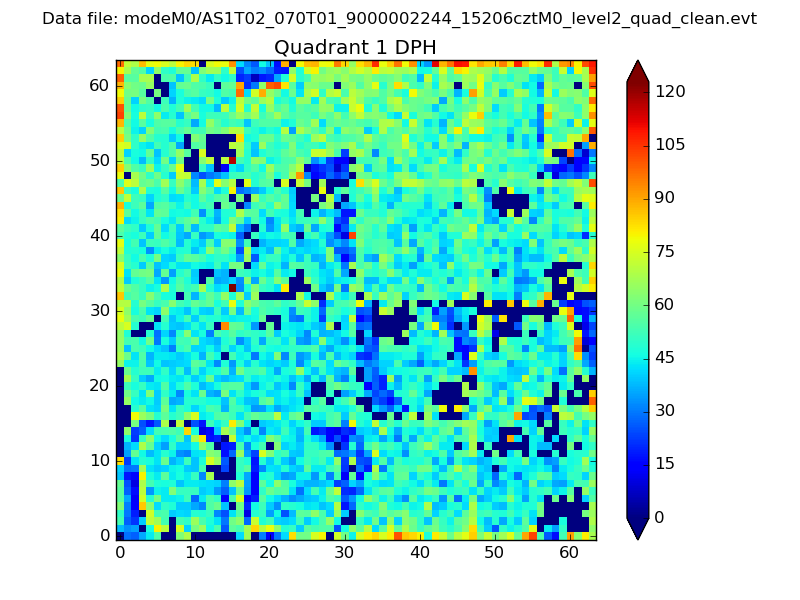 |
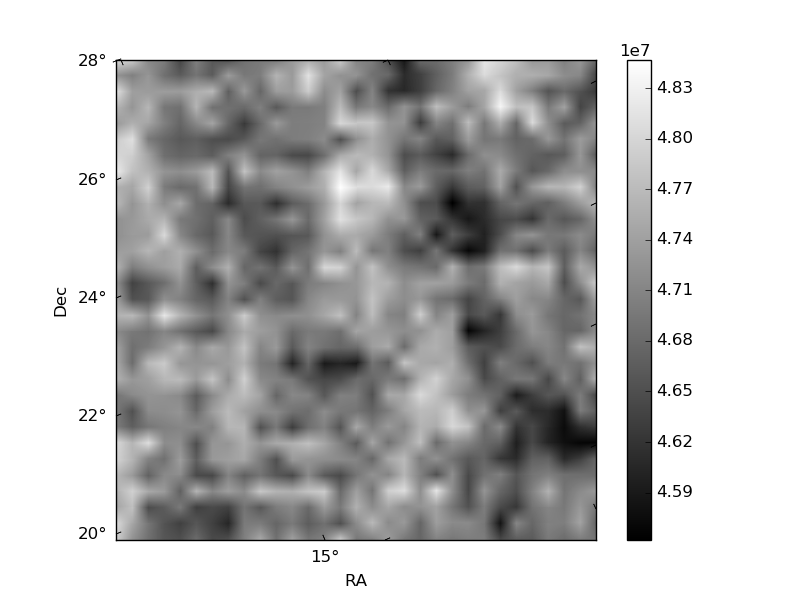
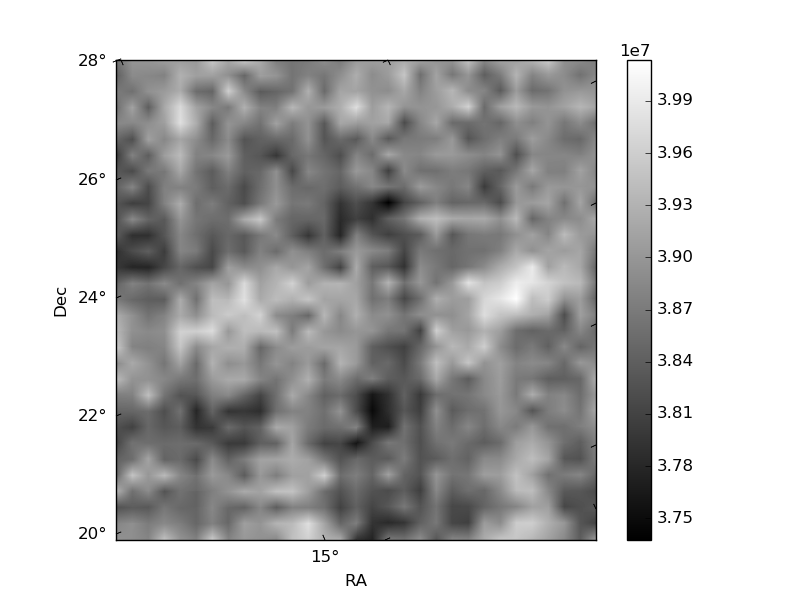
Quadrant B |
|---|---|---|---|
| Quadrant D | 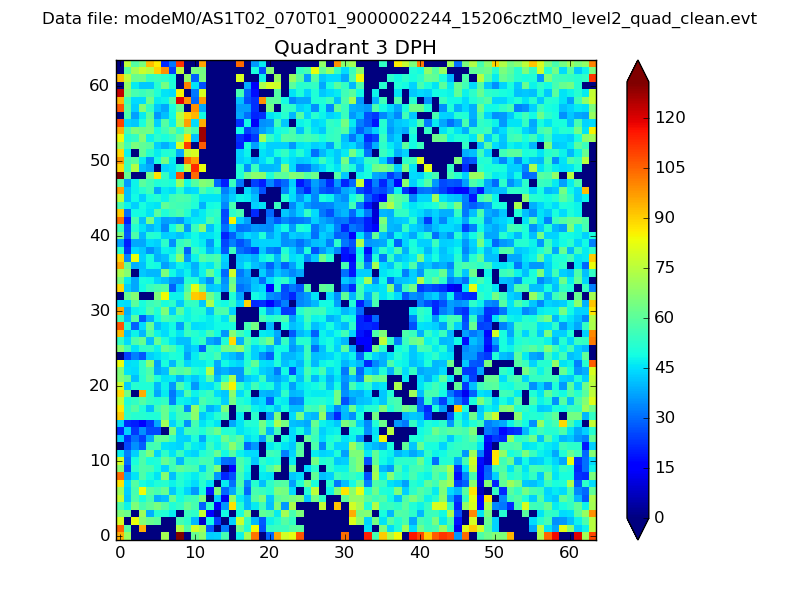 |
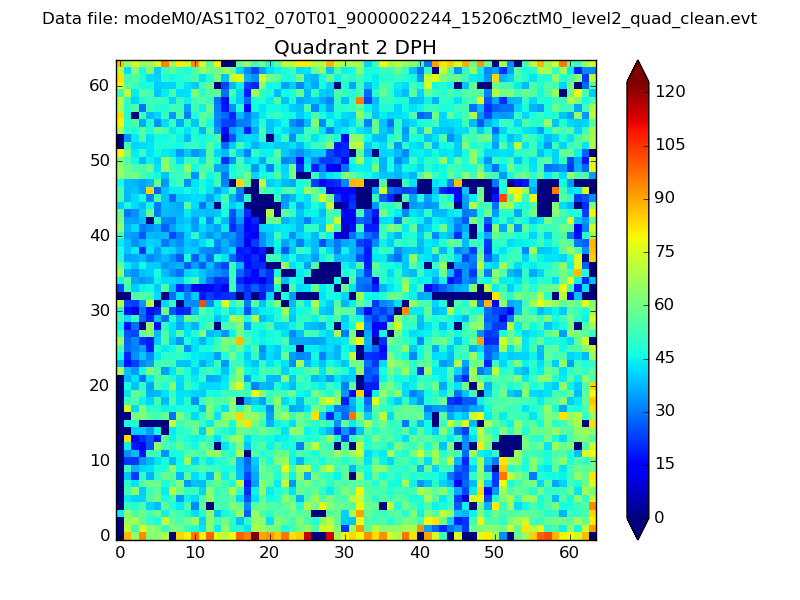 |
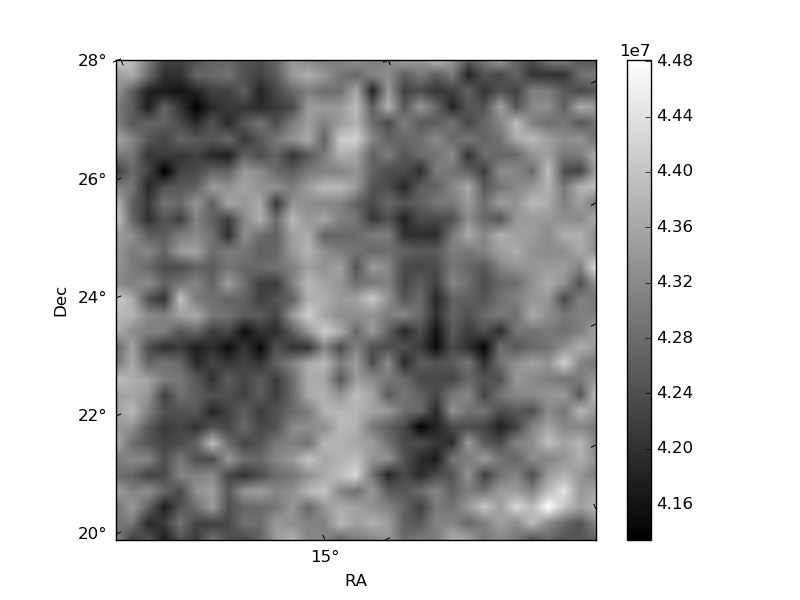
Quadrant C |
| Plot type | Count rate plots | Images |
|---|---|---|
| Comparison with Poisson distribution Blue bars denote a histogram of data divided into 1 sec bins. Red curve is a Poisson curve with rate = median count rate of data. |
 |
 |
| Quadrant-wise count rates Data is divided into 100 sec bins |
 |
|
| Module-wise count rates for Quadrant A Data is divided into 100 sec bins |
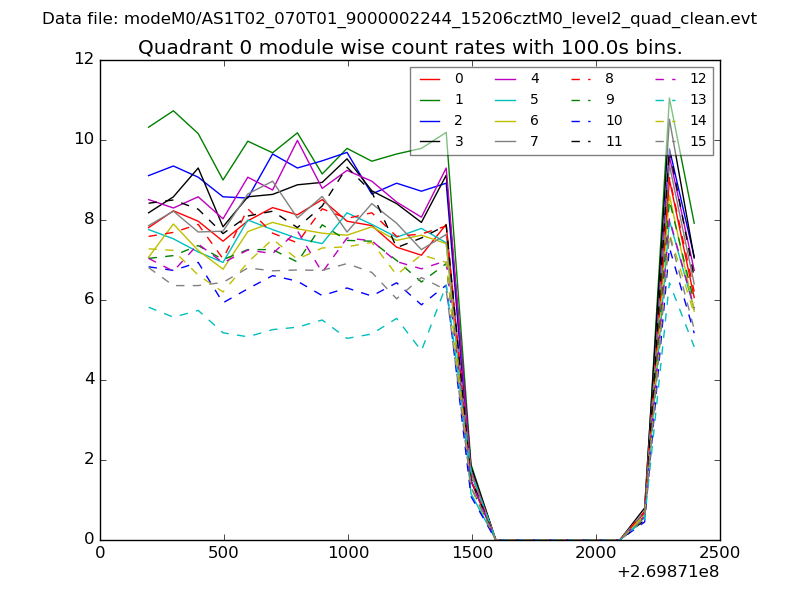 |
 |
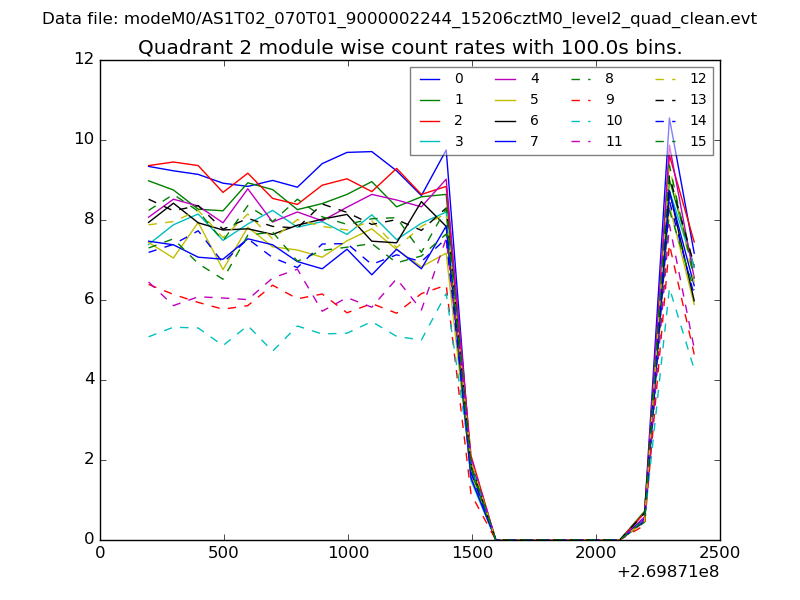
| Module-wise count rates for Quadrant B Data is divided into 100 sec bins |
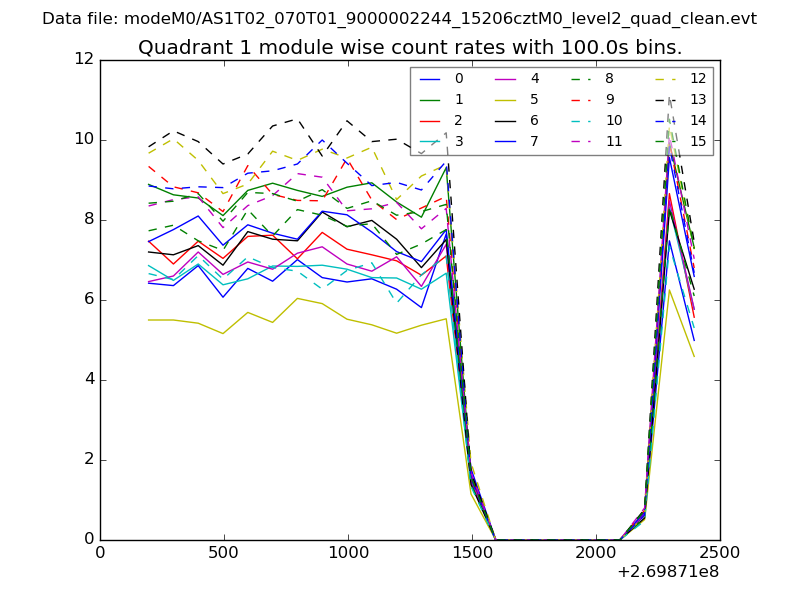 |
 |
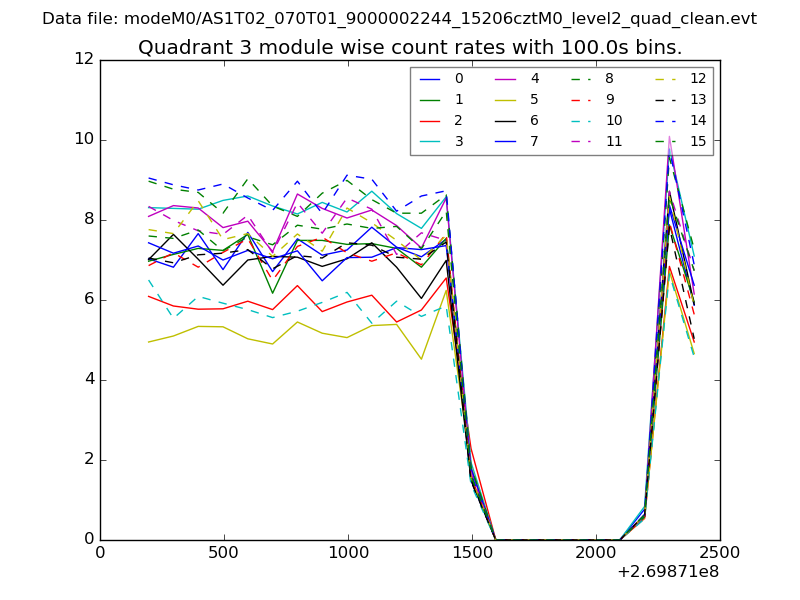
| Module-wise count rates for Quadrant C Data is divided into 100 sec bins |
 |
 |
| Module-wise count rates for Quadrant D Data is divided into 100 sec bins |
 |
 |
| Parameter | Plot |
|---|---|
| CZT HV Monitor | 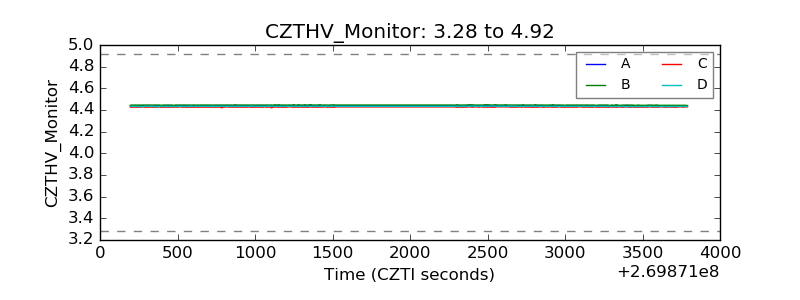 |
| D_VDD | 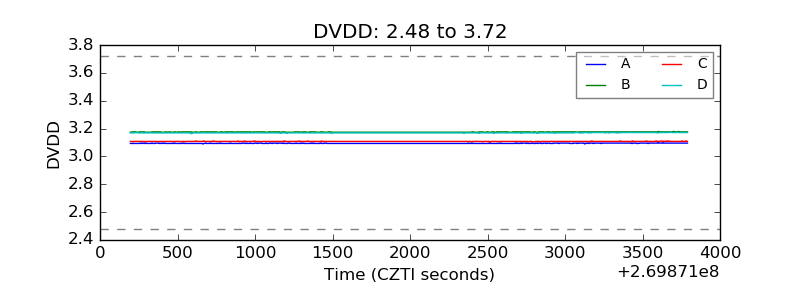 |
| Temperature 1 | 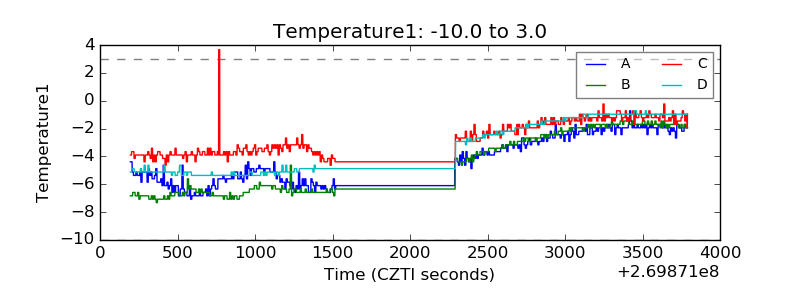 |
| Veto HV Monitor | 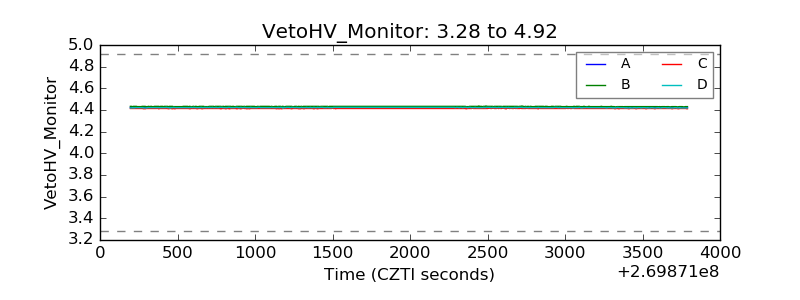 |
| Veto LLD | 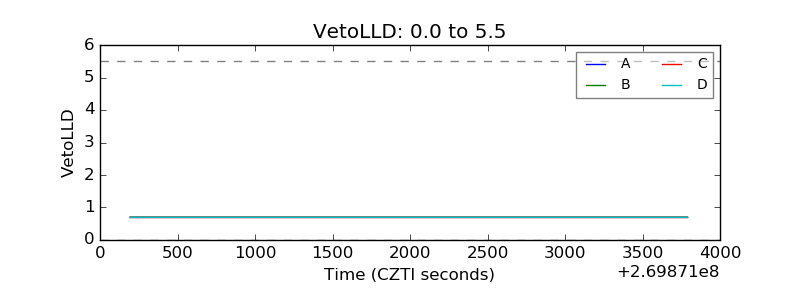 |
| Alpha Counter |  |
| _CPM_Rate | 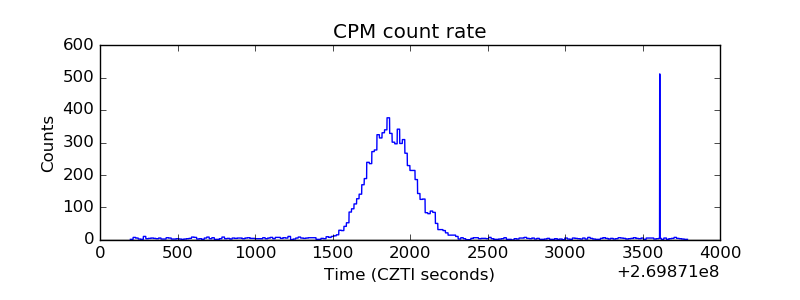 |
| CZT Counter | 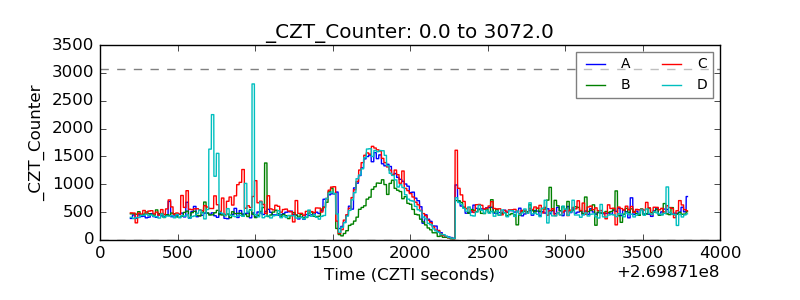 |
| +2.5 Volts monitor |  |
| +5 Volts monitor |  |
| _ROLL_ROT | 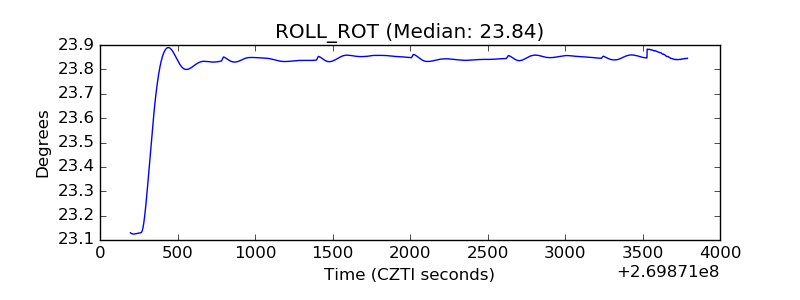 |
| _Roll_DEC | 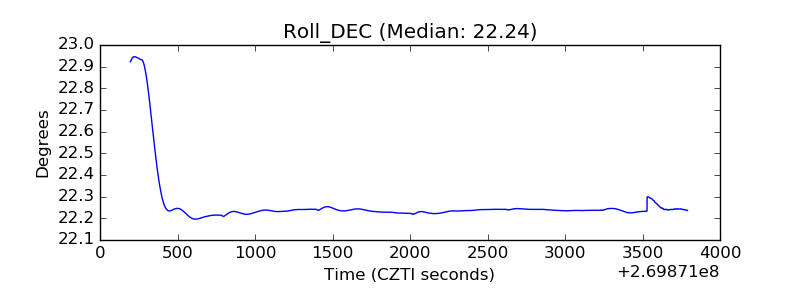 |
| _Roll_RA | 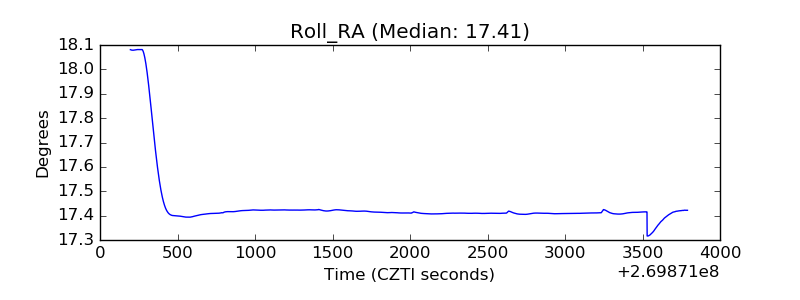 |
| Veto Counter | 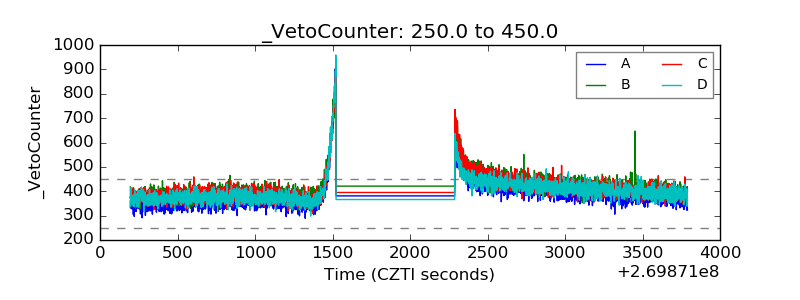 |