| Param | Original file | Final file |
|---|---|---|
| Filename | modeM0/AS1T02_070T01_9000002244_15207cztM0_level2.evt | modeM0/AS1T02_070T01_9000002244_15207cztM0_level2_quad_clean.evt |
| Size (bytes) | 487,915,200 | 65,525,760 |
| Size | 465.3 MB | 62.5 MB |
| Events in quadrant A | 3,305,686 | 383,628 |
| Events in quadrant B | 3,799,821 | 385,434 |
| Events in quadrant C | 3,991,240 | 376,275 |
| Events in quadrant D | 3,221,690 | 368,209 |
| Mode M0 | |||
|---|---|---|---|
| Quadrant | BADHDUFLAG | Total packets | Discarded packets |
| A | 0 | 14012 | 3 |
| B | 0 | 15480 | 2 |
| C | 0 | 16140 | 2 |
| D | 0 | 14041 | 2 |
| Mode SS | |||
|---|---|---|---|
| Quadrant | BADHDUFLAG | Total packets | Discarded packets |
| A | 0 | 138 | 0 |
| B | 0 | 138 | 0 |
| C | 0 | 138 | 0 |
| D | 0 | 138 | 0 |
| Mode M9 | |||
|---|---|---|---|
| Quadrant | BADHDUFLAG | Total packets | Discarded packets |
| A | 0 | 12 | 0 |
| B | 0 | 12 | 0 |
| C | 0 | 12 | 0 |
| D | 0 | 13 | 0 |
| Quadrant | Total seconds | Saturated seconds | Saturation percentage |
|---|---|---|---|
| A | 6743 | 56 | 0.830491% |
| B | 6743 | 246 | 3.648228% |
| C | 6743 | 53 | 0.786000% |
| D | 6743 | 51 | 0.756340% |
Noise dominated data is calculated using 1-second bins in cleaned event files. If a bin has >2000 counts, and if more than 50% of those come from <1% of pixels, then it is considered to be noise-dominated and hence unusable.
| Quadrant | # 1 sec bins | Bins with >0 counts | Bins with >2000 counts | High rate bins dominated by noise | Noise dominated (total time) | Noise dominated (detector-on time) | Marked lightcurve |
|---|---|---|---|---|---|---|---|
| A | 7684 | 6744 | 0 | 0 | 0.00% | 0.00% | 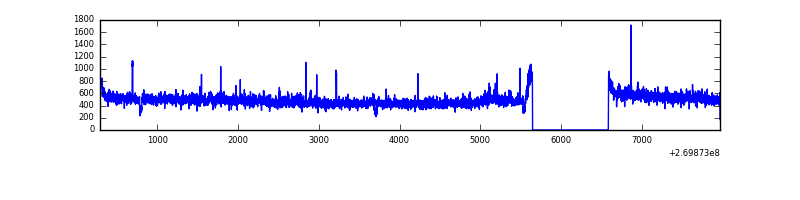 |
| B | 7684 | 6744 | 135 | 135 | 1.76% | 2.00% | 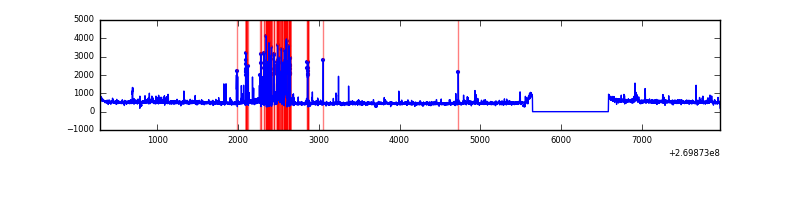 |
| C | 7684 | 6744 | 0 | 0 | 0.00% | 0.00% | 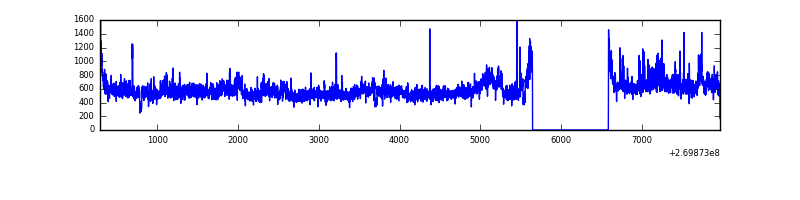 |
| D | 7684 | 6744 | 9 | 9 | 0.12% | 0.13% | 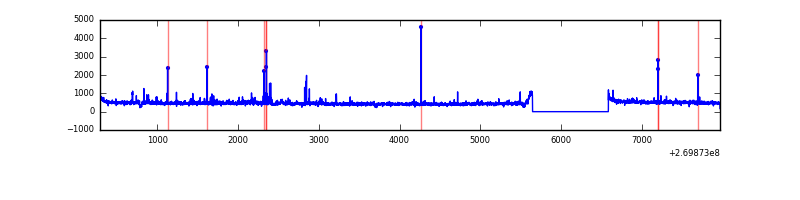 |
Top three noisy pixels from each quadrant. If the there are fewer than three noisy pixels in the level2.evt file, extra rows are filled as -1
| Pixel properties | Quadrant properties | ||||||
|---|---|---|---|---|---|---|---|
| Quadrant | DetID | PixID | Counts | Sigma | Mean | Median | Sigma |
| A | 12 | 189 | 85523 | 503.2 | 833 | 816 | 168.3 |
| A | 0 | 226 | 7452 | 39.42 | 833 | 816 | 168.3 |
| A | 12 | 194 | 6181 | 31.87 | 833 | 816 | 168.3 |
| B | 3 | 64 | 445316 | 2789.97 | 817 | 795 | 159.3 |
| B | 10 | 245 | 56562 | 350.01 | 817 | 795 | 159.3 |
| B | 0 | 189 | 47275 | 291.72 | 817 | 795 | 159.3 |
| C | 3 | 233 | 767705 | 4116.76 | 800 | 804 | 186.3 |
| C | 7 | 247 | 101002 | 537.87 | 800 | 804 | 186.3 |
| C | 13 | 61 | 5795 | 26.79 | 800 | 804 | 186.3 |
| D | 7 | 38 | 38608 | 189.46 | 808 | 782 | 199.7 |
| D | 12 | 110 | 27829 | 135.47 | 808 | 782 | 199.7 |
| D | 2 | 234 | 25504 | 123.83 | 808 | 782 | 199.7 |
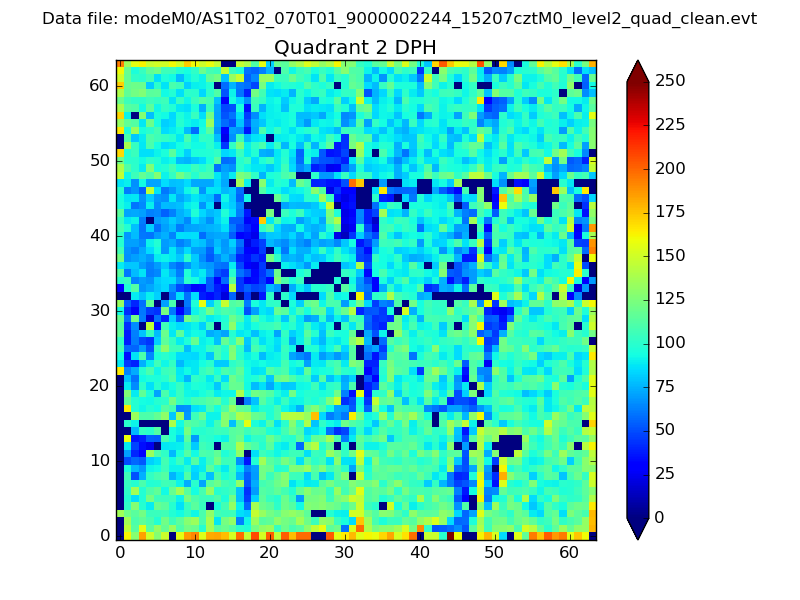
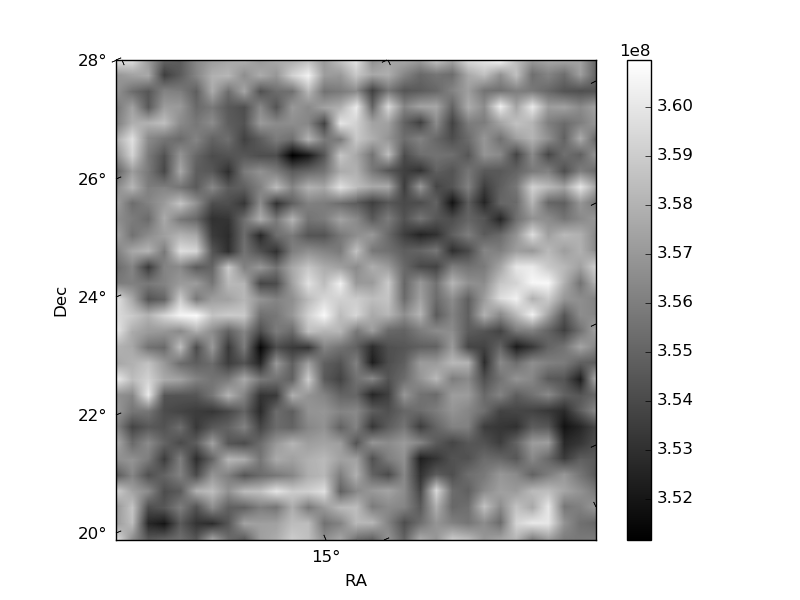
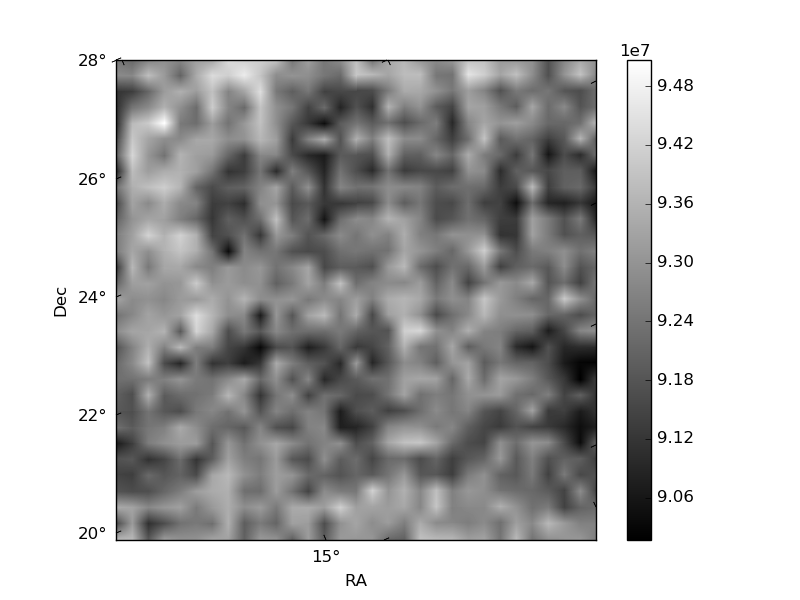
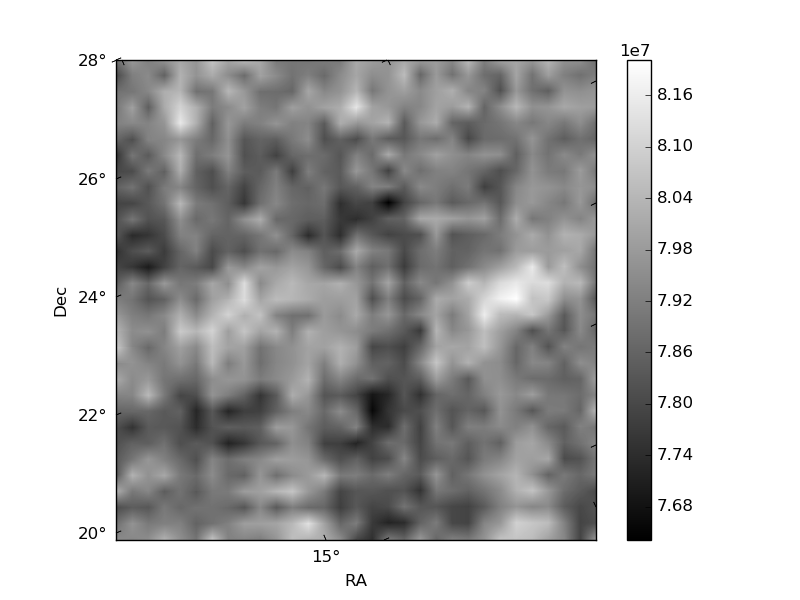
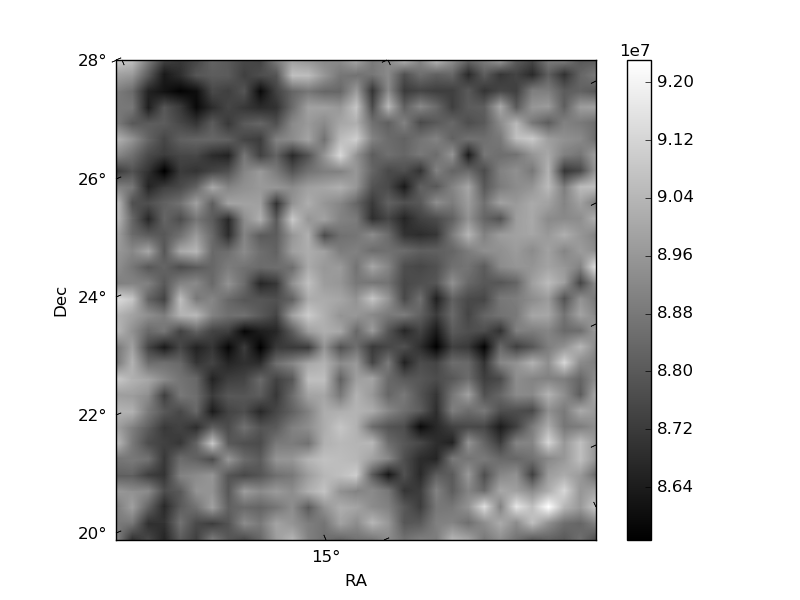
Histogram calculated using DETX and DETY for each event in the final _common_clean file
| Quadrant A | 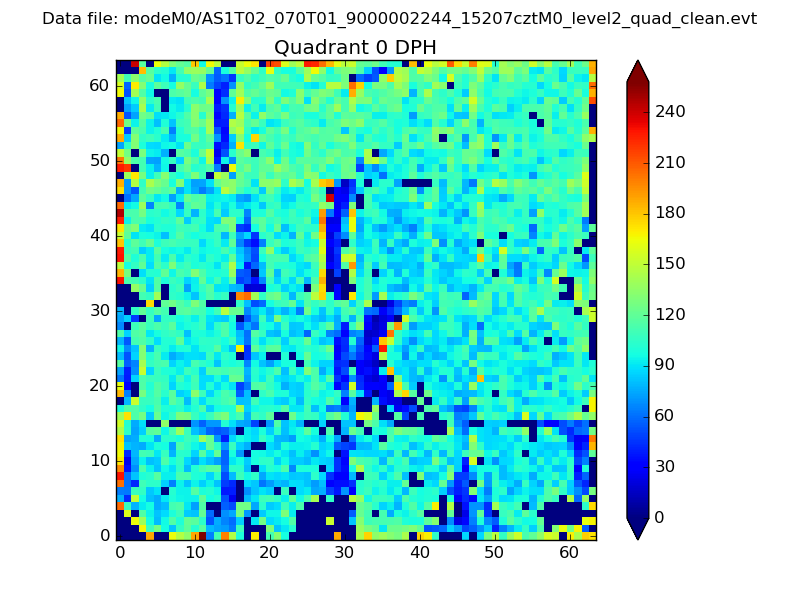 |
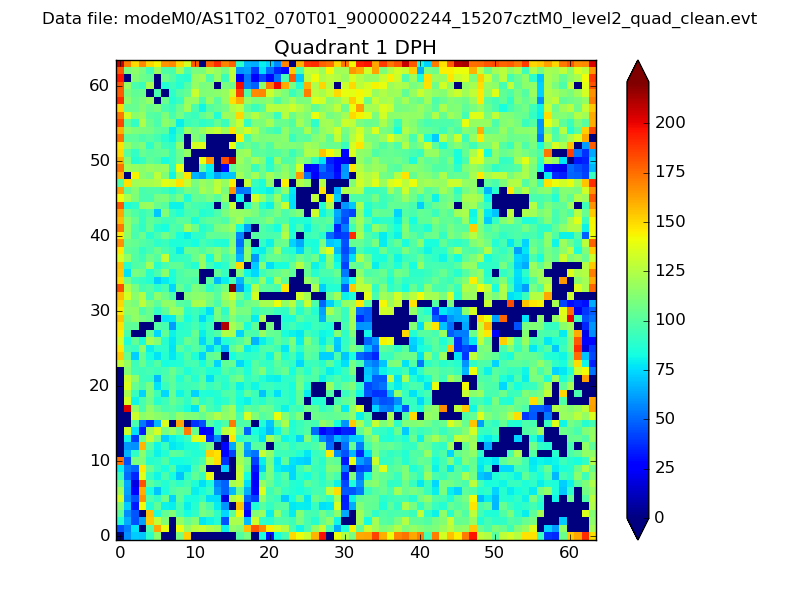 |
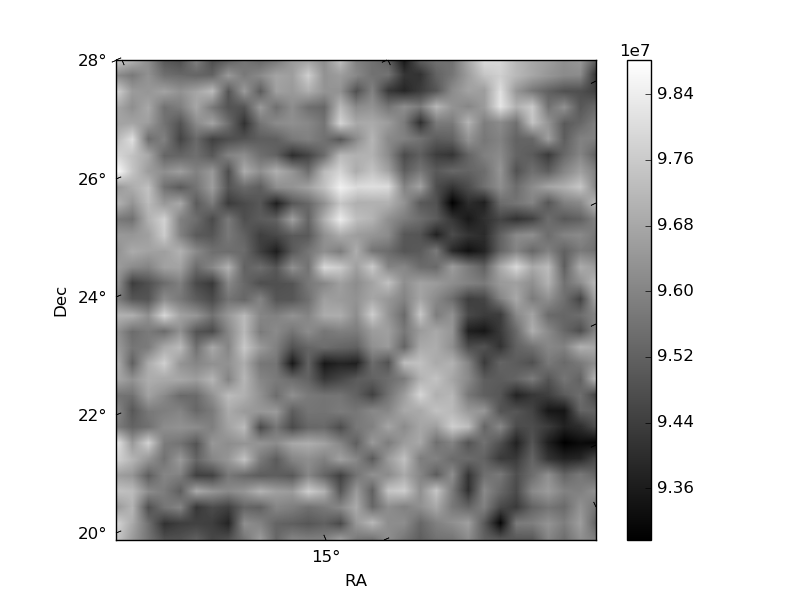
Quadrant B |
|---|---|---|---|
| Quadrant D | 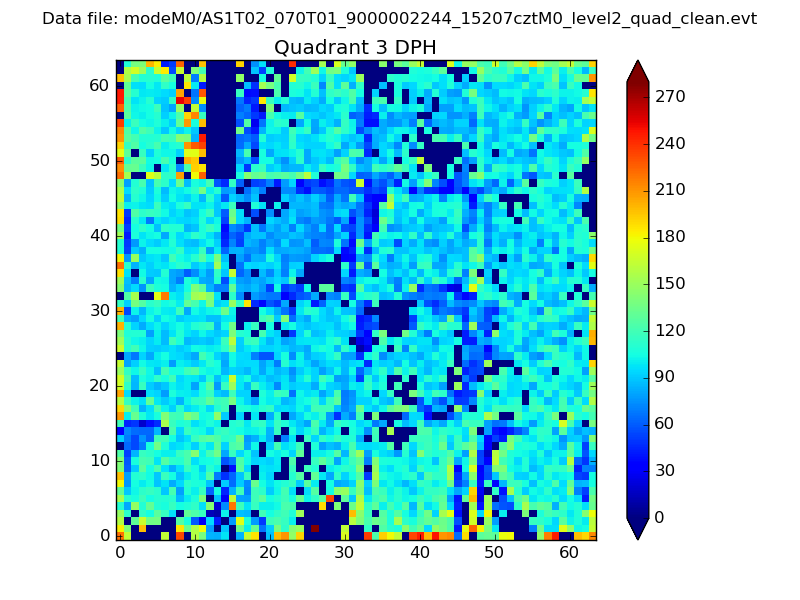 |
 |
Quadrant C |
| Plot type | Count rate plots | Images |
|---|---|---|
| Comparison with Poisson distribution Blue bars denote a histogram of data divided into 1 sec bins. Red curve is a Poisson curve with rate = median count rate of data. |
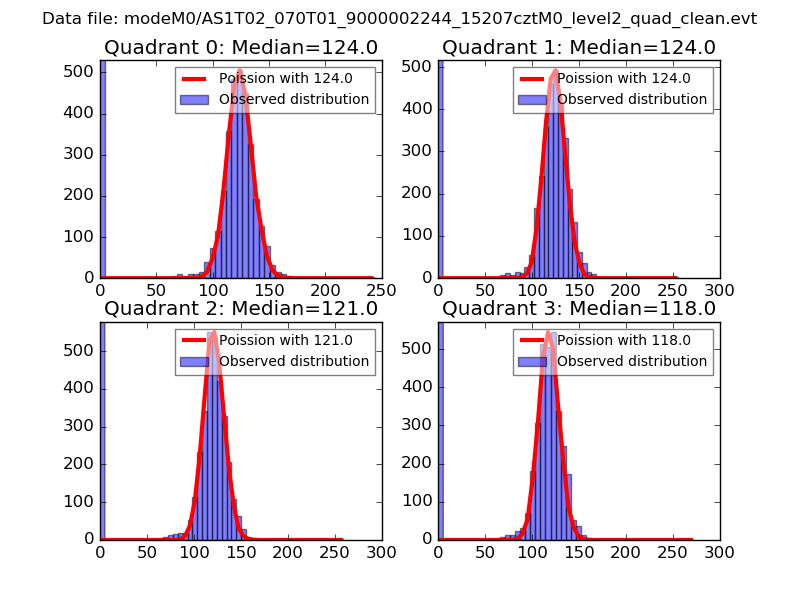 |
 |
| Quadrant-wise count rates Data is divided into 100 sec bins |
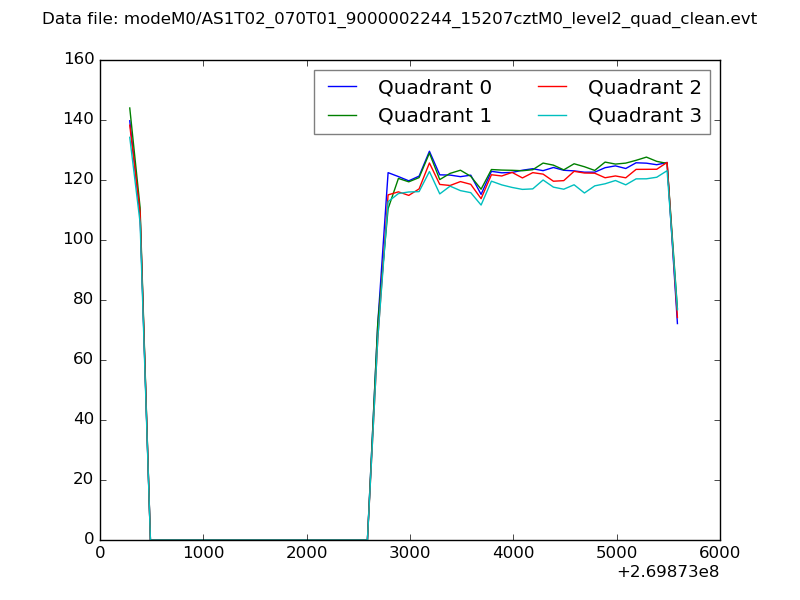 |
|
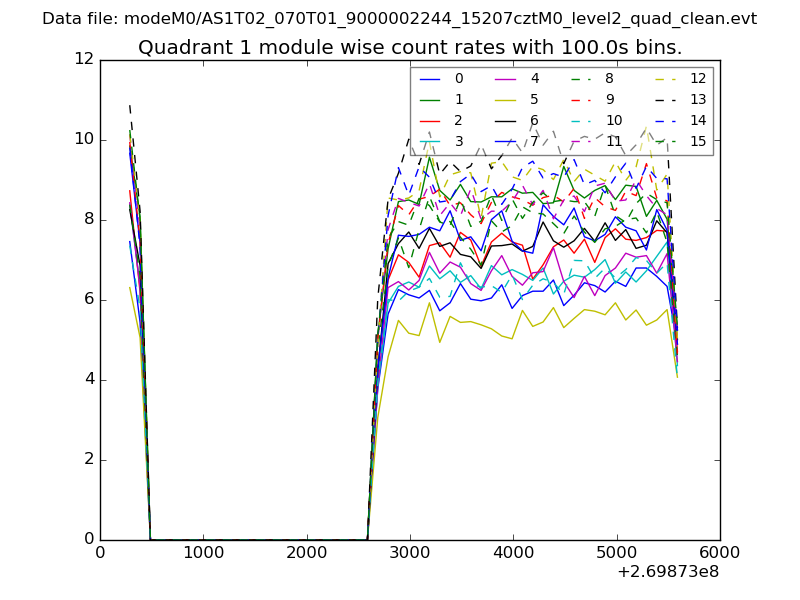
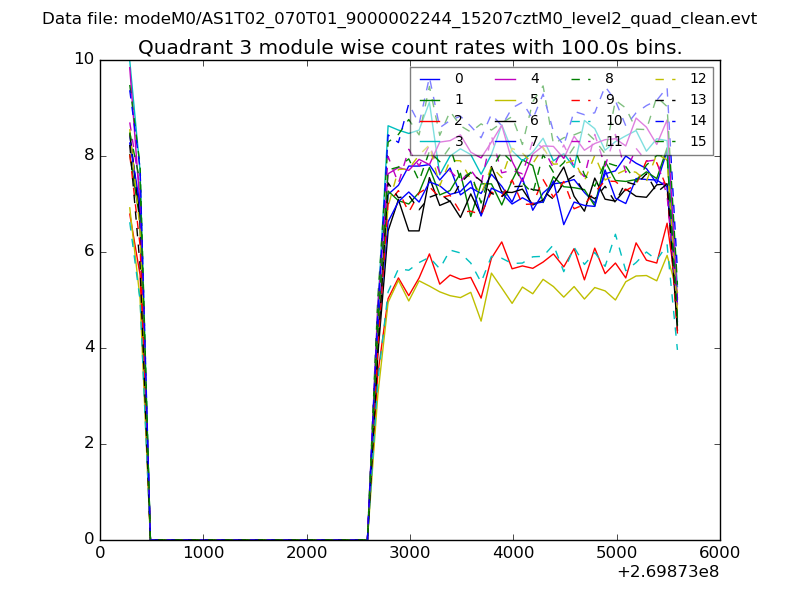
| Module-wise count rates for Quadrant A Data is divided into 100 sec bins |
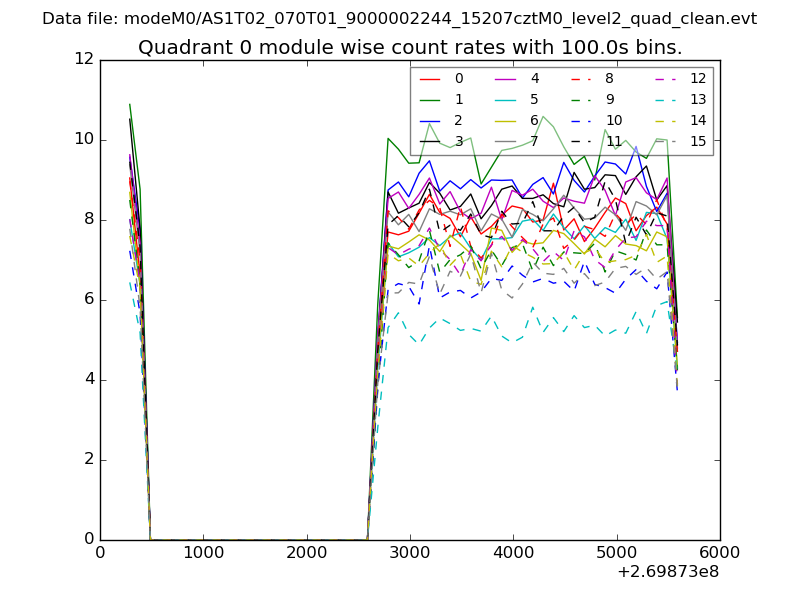 |
 |
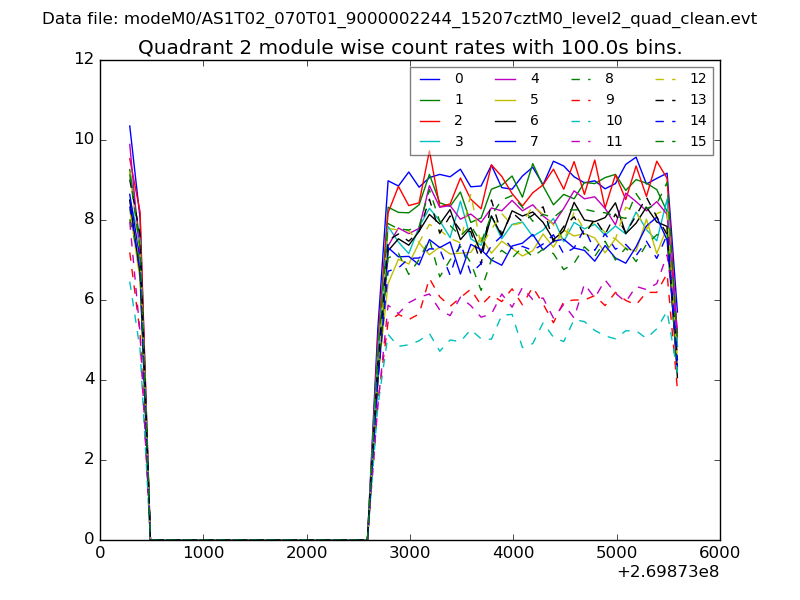
| Module-wise count rates for Quadrant B Data is divided into 100 sec bins |
 |
 |
| Module-wise count rates for Quadrant C Data is divided into 100 sec bins |
 |
 |
| Module-wise count rates for Quadrant D Data is divided into 100 sec bins |
 |
 |
| Parameter | Plot |
|---|---|
| CZT HV Monitor | 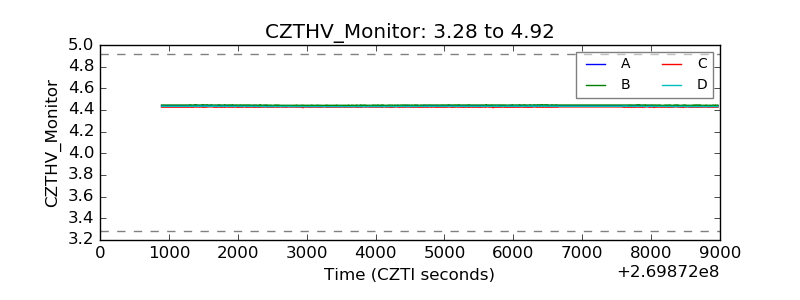 |
| D_VDD | 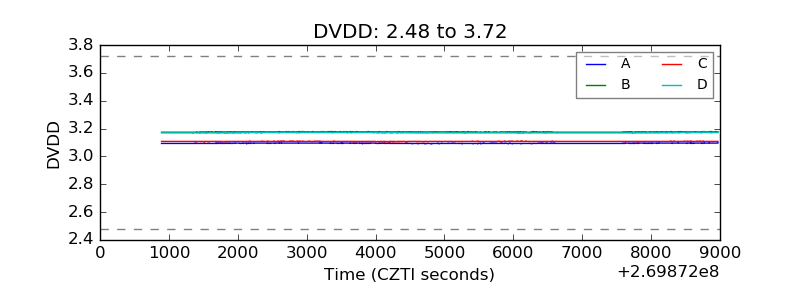 |
| Temperature 1 | 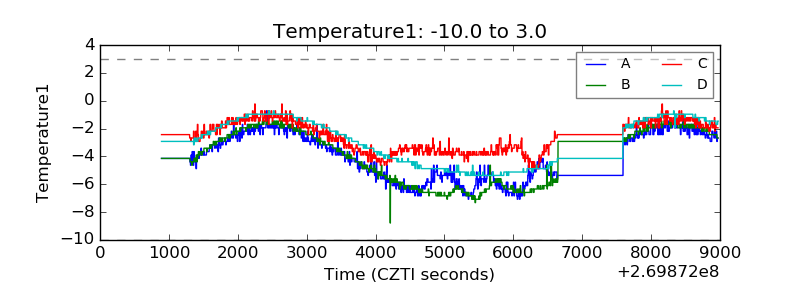 |
| Veto HV Monitor | 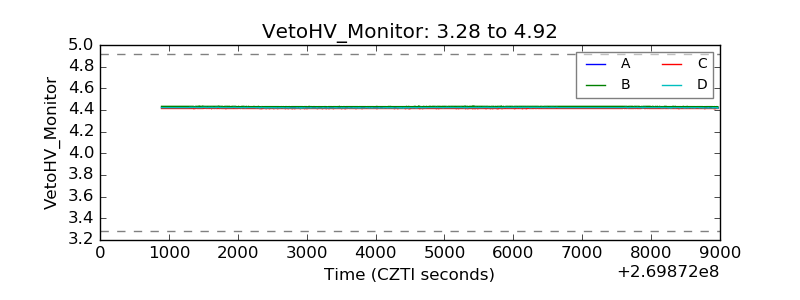 |
| Veto LLD | 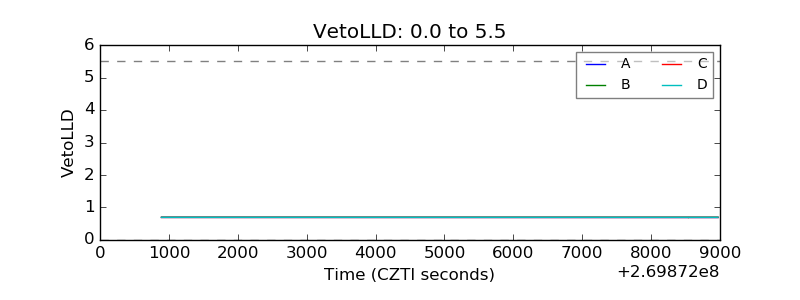 |
| Alpha Counter | 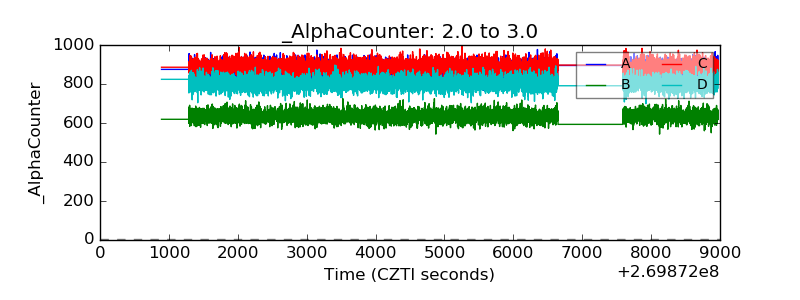 |
| _CPM_Rate | 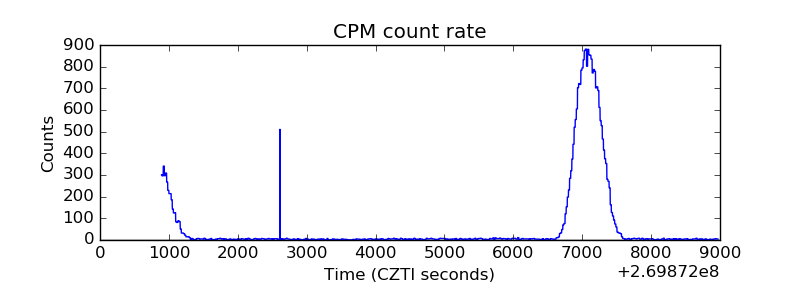 |
| CZT Counter | 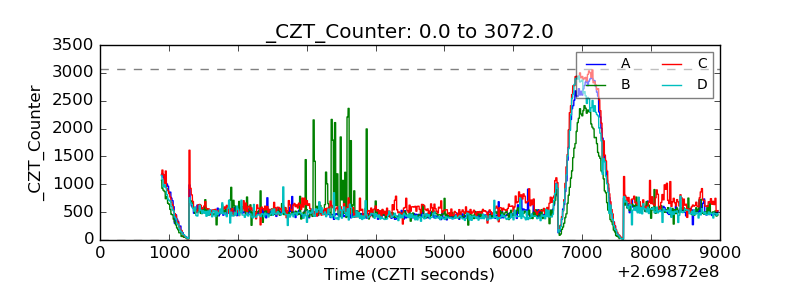 |
| +2.5 Volts monitor |  |
| +5 Volts monitor |  |
| _ROLL_ROT | 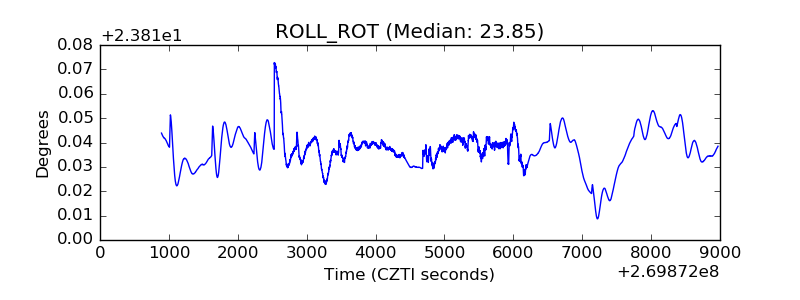 |
| _Roll_DEC | 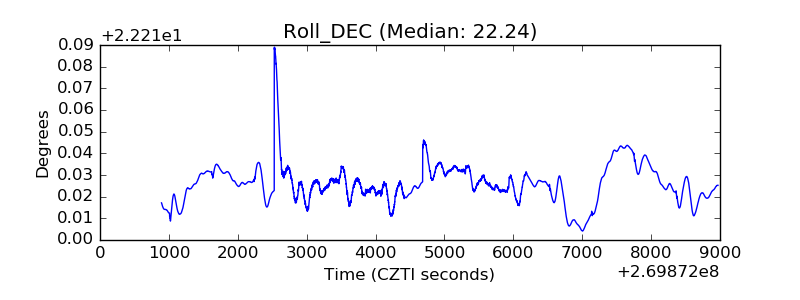 |
| _Roll_RA | 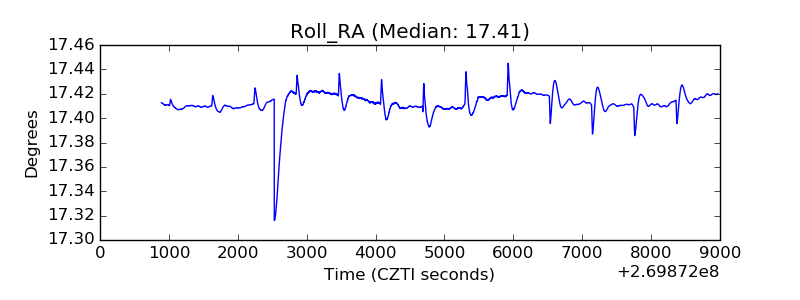 |
| Veto Counter | 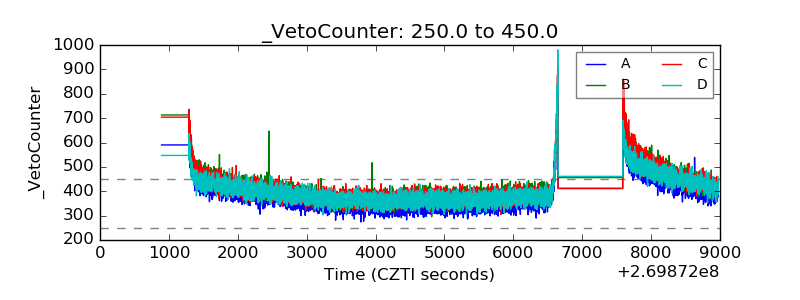 |