| Param | Original file | Final file |
|---|---|---|
| Filename | modeM0/AS1T02_070T01_9000002244_15208cztM0_level2.evt | modeM0/AS1T02_070T01_9000002244_15208cztM0_level2_quad_clean.evt |
| Size (bytes) | 228,680,640 | 25,231,680 |
| Size | 218.1 MB | 24.1 MB |
| Events in quadrant A | 1,563,189 | 137,275 |
| Events in quadrant B | 1,683,630 | 138,676 |
| Events in quadrant C | 1,965,321 | 134,699 |
| Events in quadrant D | 1,500,032 | 131,008 |
| Mode M0 | |||
|---|---|---|---|
| Quadrant | BADHDUFLAG | Total packets | Discarded packets |
| A | 0 | 6564 | 1 |
| B | 0 | 6916 | 1 |
| C | 0 | 8099 | 1 |
| D | 0 | 6465 | 1 |
| Mode SS | |||
|---|---|---|---|
| Quadrant | BADHDUFLAG | Total packets | Discarded packets |
| A | 0 | 64 | 0 |
| B | 0 | 64 | 0 |
| C | 0 | 64 | 0 |
| D | 0 | 64 | 0 |
| Mode M9 | |||
|---|---|---|---|
| Quadrant | BADHDUFLAG | Total packets | Discarded packets |
| A | 0 | 5 | 0 |
| B | 0 | 5 | 0 |
| C | 0 | 5 | 0 |
| D | 0 | 6 | 0 |
| Quadrant | Total seconds | Saturated seconds | Saturation percentage |
|---|---|---|---|
| A | 3110 | 10 | 0.321543% |
| B | 3110 | 17 | 0.546624% |
| C | 3110 | 9 | 0.289389% |
| D | 3110 | 9 | 0.289389% |
Noise dominated data is calculated using 1-second bins in cleaned event files. If a bin has >2000 counts, and if more than 50% of those come from <1% of pixels, then it is considered to be noise-dominated and hence unusable.
| Quadrant | # 1 sec bins | Bins with >0 counts | Bins with >2000 counts | High rate bins dominated by noise | Noise dominated (total time) | Noise dominated (detector-on time) | Marked lightcurve |
|---|---|---|---|---|---|---|---|
| A | 3111 | 3111 | 0 | 0 | 0.00% | 0.00% | 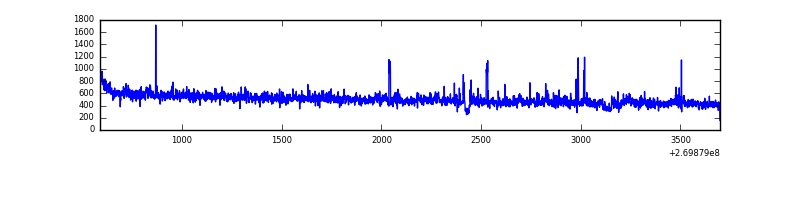 |
| B | 3111 | 3111 | 5 | 5 | 0.16% | 0.16% | 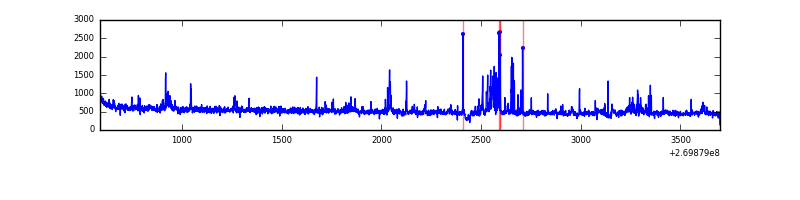 |
| C | 3111 | 3111 | 0 | 0 | 0.00% | 0.00% | 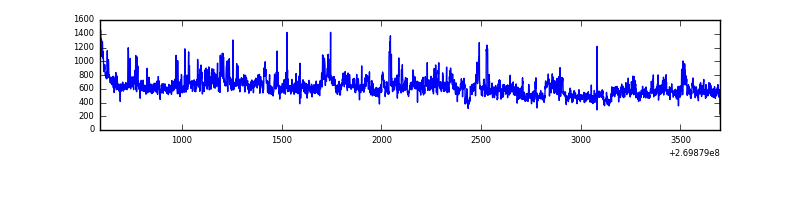 |
| D | 3111 | 3111 | 4 | 4 | 0.13% | 0.13% | 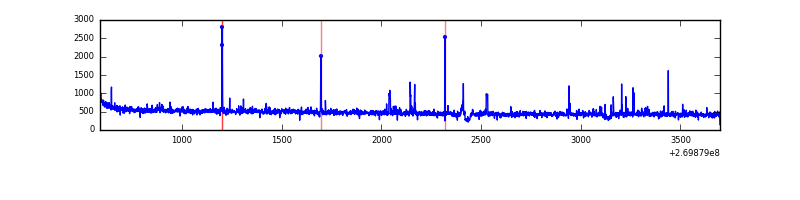 |
Top three noisy pixels from each quadrant. If the there are fewer than three noisy pixels in the level2.evt file, extra rows are filled as -1
| Pixel properties | Quadrant properties | ||||||
|---|---|---|---|---|---|---|---|
| Quadrant | DetID | PixID | Counts | Sigma | Mean | Median | Sigma |
| A | 12 | 189 | 48079 | 597.95 | 390 | 381 | 79.8 |
| A | 9 | 143 | 6048 | 71.04 | 390 | 381 | 79.8 |
| A | 13 | 248 | 5622 | 65.7 | 390 | 381 | 79.8 |
| B | 3 | 112 | 42493 | 556.04 | 388 | 377 | 75.7 |
| B | 3 | 64 | 34666 | 452.7 | 388 | 377 | 75.7 |
| B | 0 | 189 | 25637 | 333.5 | 388 | 377 | 75.7 |
| C | 3 | 233 | 330865 | 3778.35 | 375 | 378 | 87.5 |
| C | 7 | 247 | 170855 | 1949.01 | 375 | 378 | 87.5 |
| C | 13 | 61 | 2730 | 26.89 | 375 | 378 | 87.5 |
| D | 8 | 195 | 15554 | 160.64 | 379 | 367 | 94.5 |
| D | 2 | 234 | 11850 | 121.46 | 379 | 367 | 94.5 |
| D | 7 | 38 | 11675 | 119.61 | 379 | 367 | 94.5 |
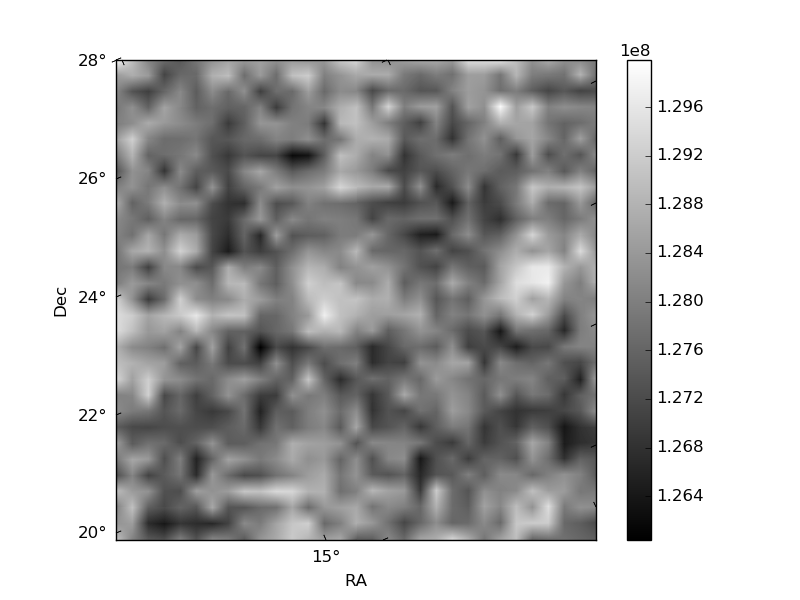
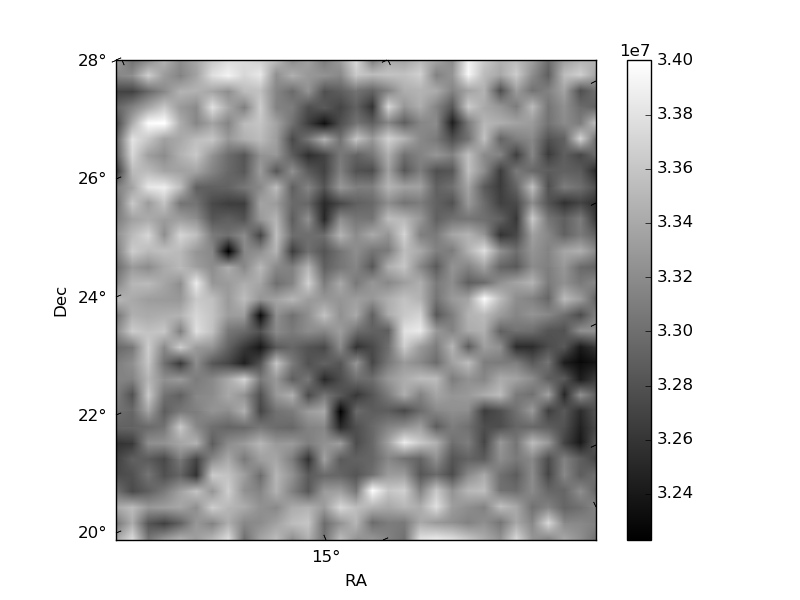
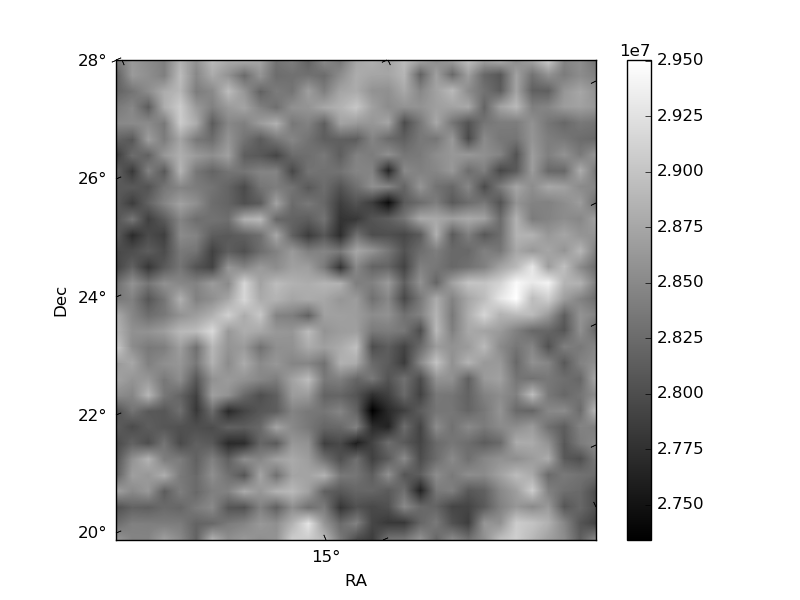
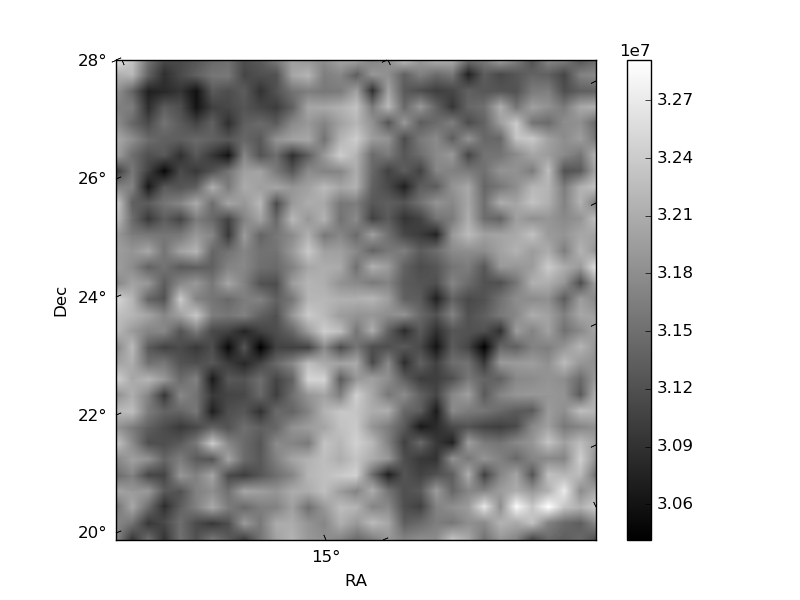
Histogram calculated using DETX and DETY for each event in the final _common_clean file
| Quadrant A | 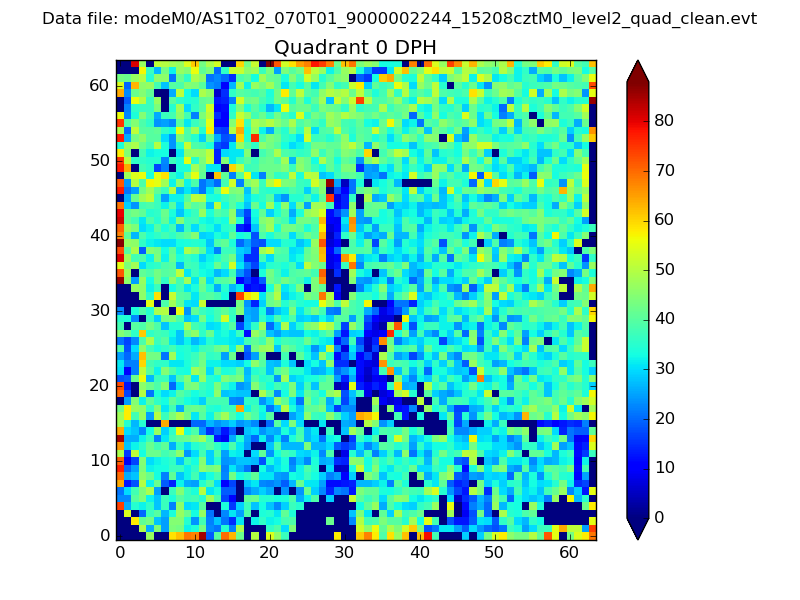 |
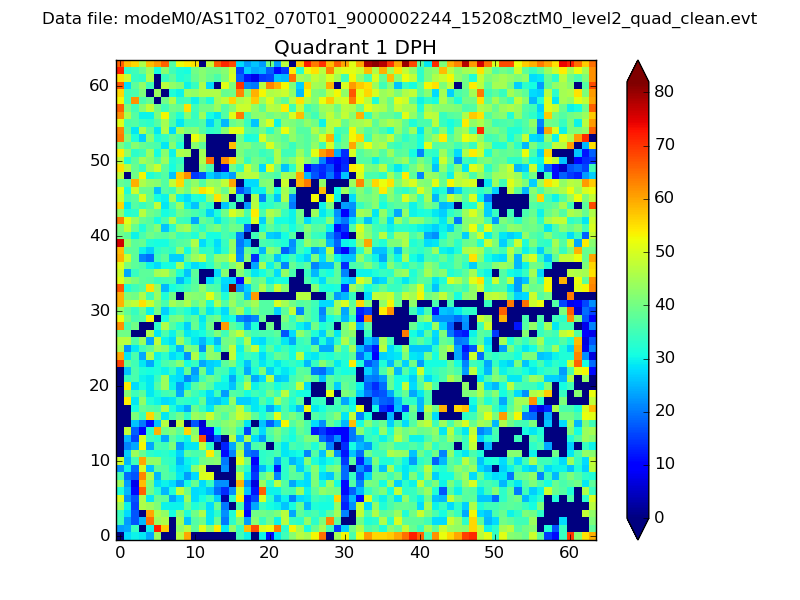 |
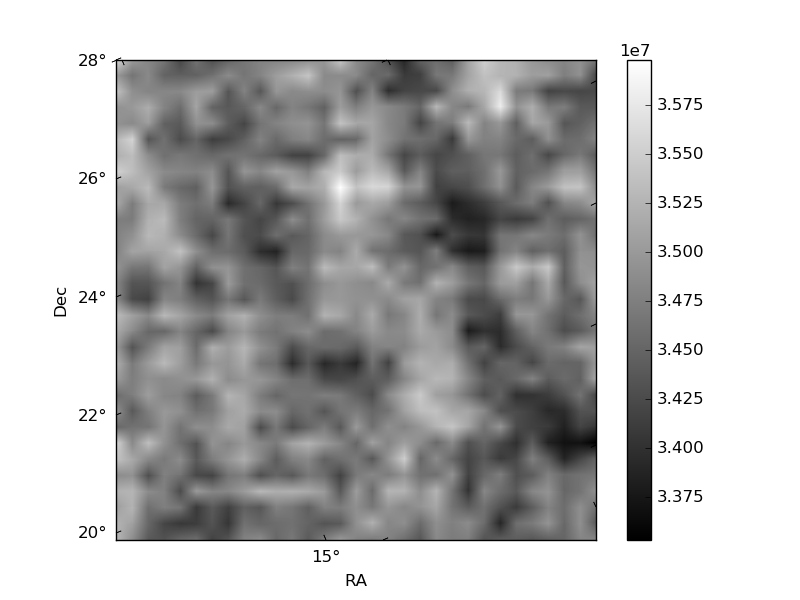
Quadrant B |
|---|---|---|---|
| Quadrant D | 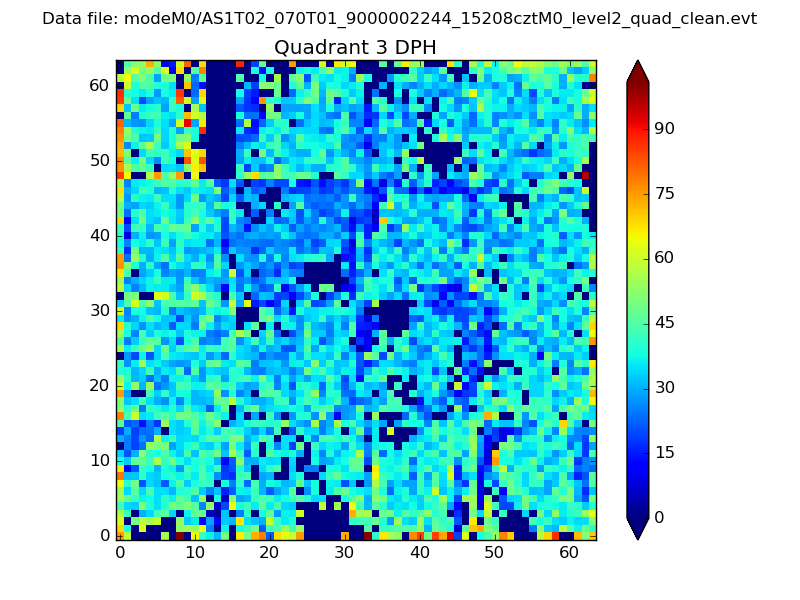 |
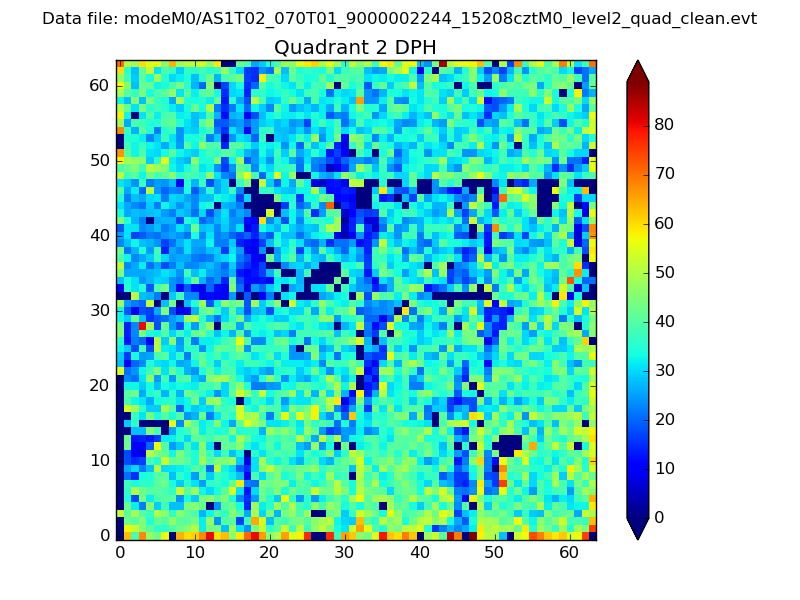 |
Quadrant C |
| Plot type | Count rate plots | Images |
|---|---|---|
| Comparison with Poisson distribution Blue bars denote a histogram of data divided into 1 sec bins. Red curve is a Poisson curve with rate = median count rate of data. |
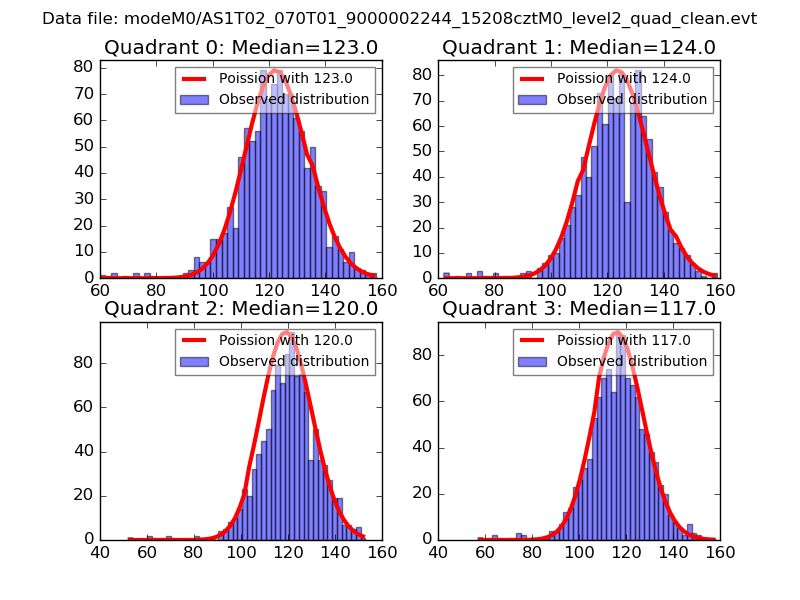 |
 |
| Quadrant-wise count rates Data is divided into 100 sec bins |
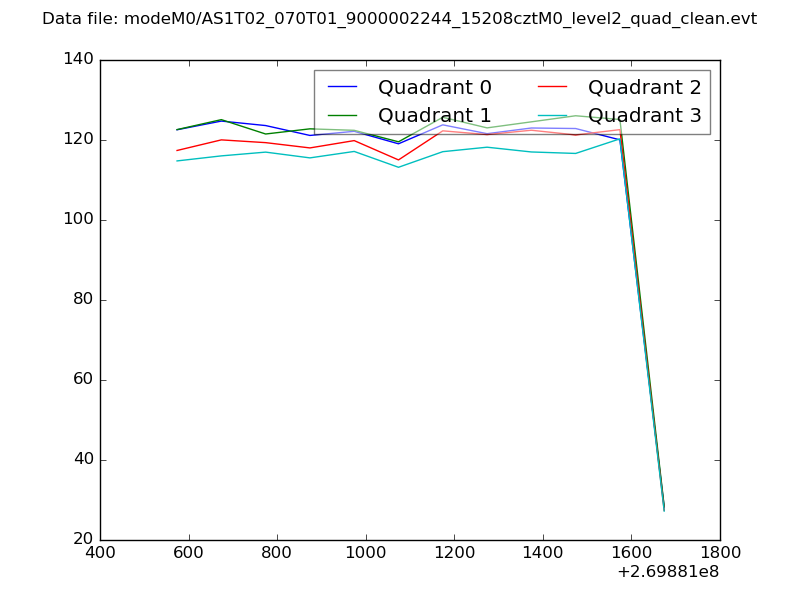 |
|
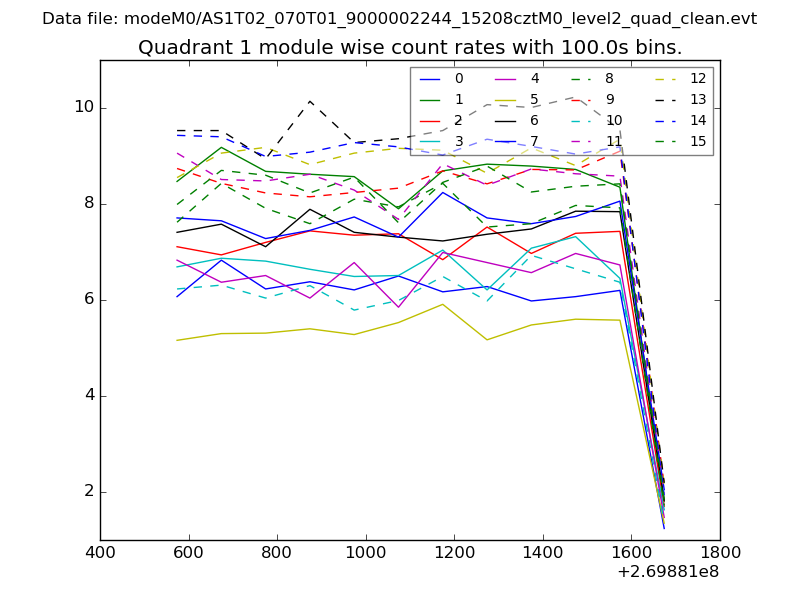
| Module-wise count rates for Quadrant A Data is divided into 100 sec bins |
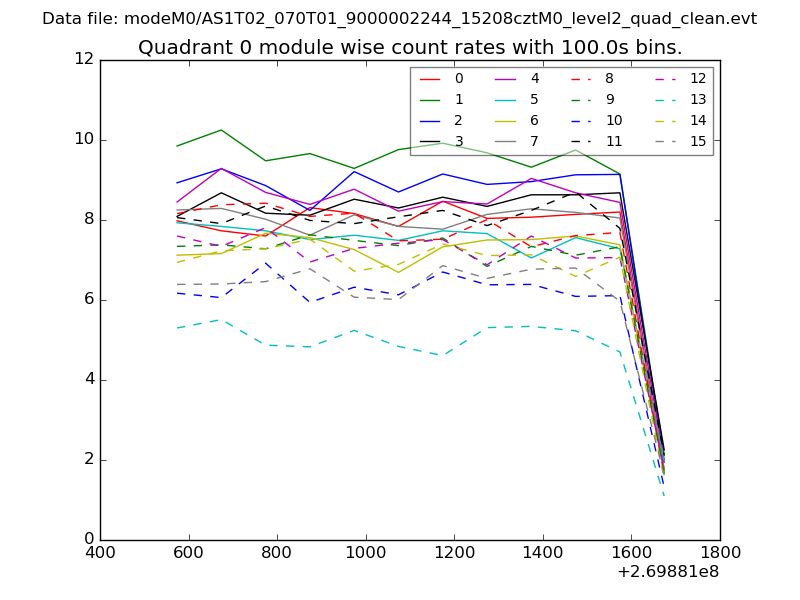 |
 |
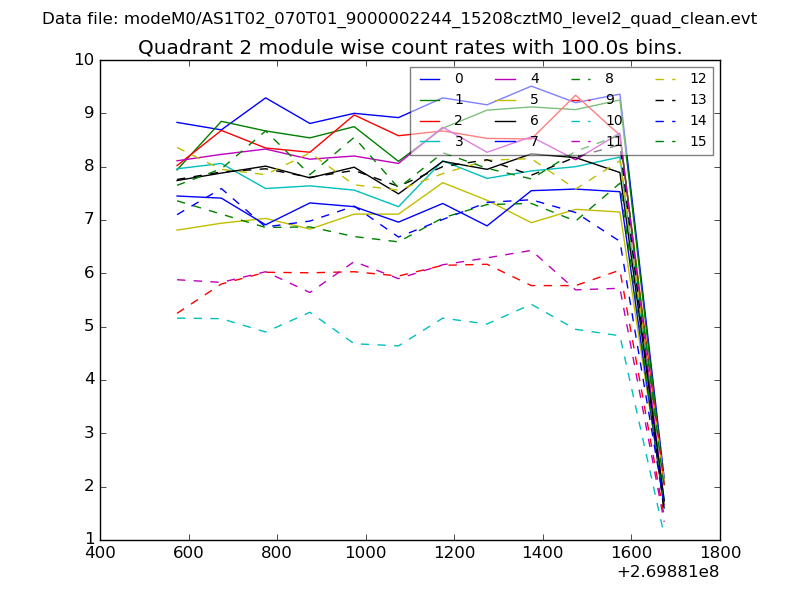
| Module-wise count rates for Quadrant B Data is divided into 100 sec bins |
 |
 |
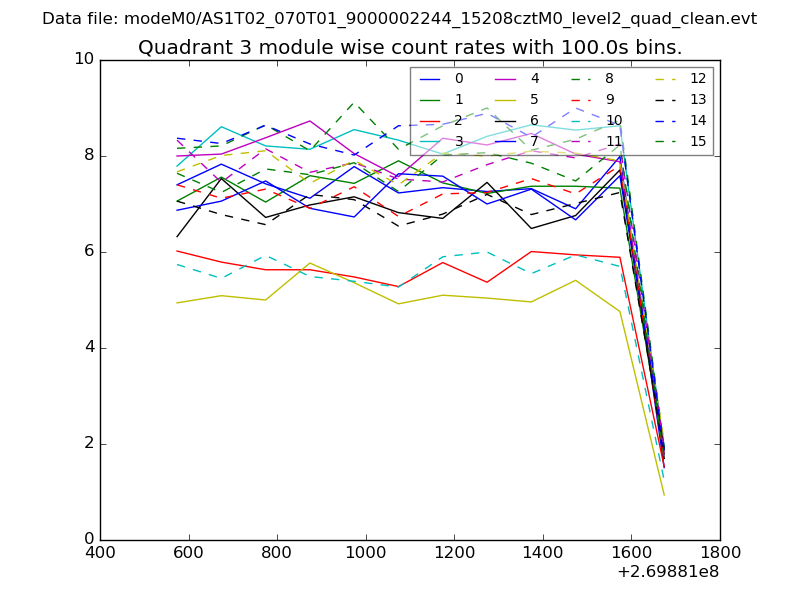
| Module-wise count rates for Quadrant C Data is divided into 100 sec bins |
 |
 |
| Module-wise count rates for Quadrant D Data is divided into 100 sec bins |
 |
 |
| Parameter | Plot |
|---|---|
| CZT HV Monitor | 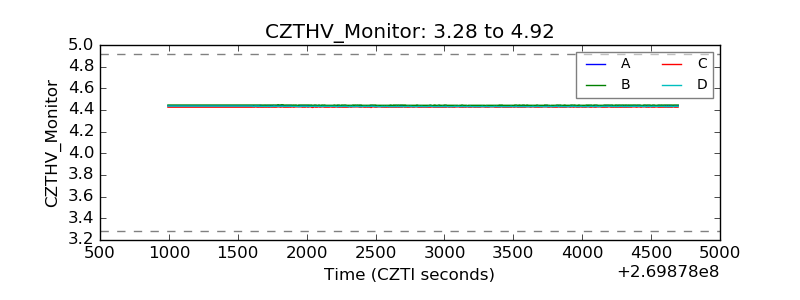 |
| D_VDD | 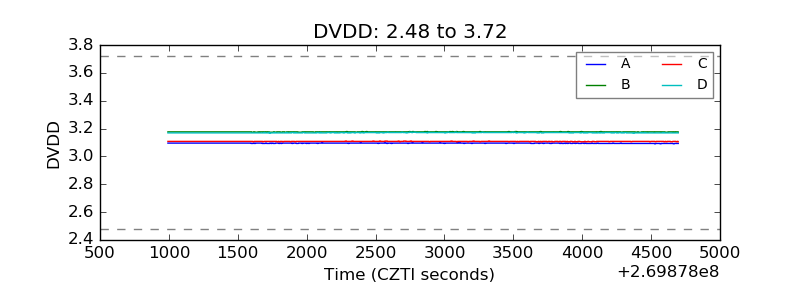 |
| Temperature 1 | 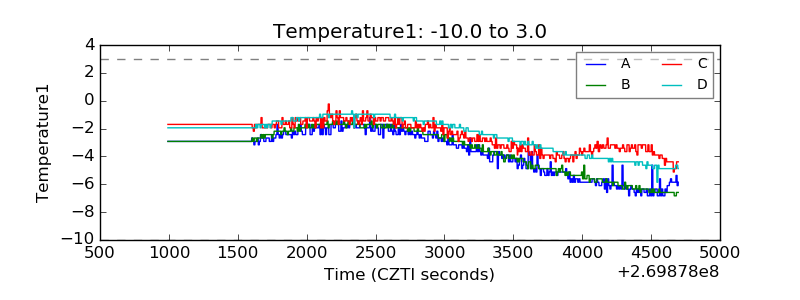 |
| Veto HV Monitor |  |
| Veto LLD | 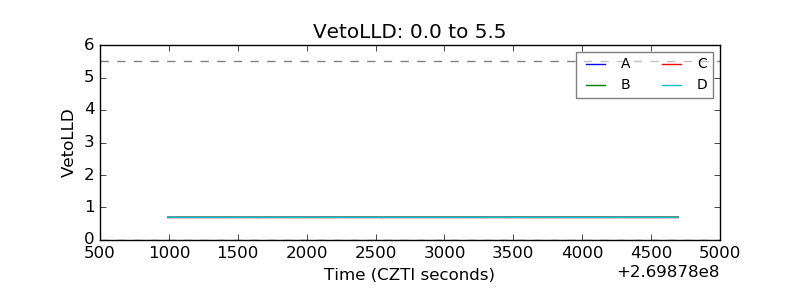 |
| Alpha Counter | 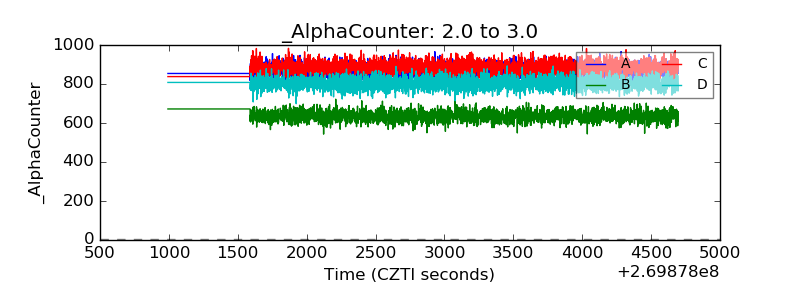 |
| _CPM_Rate | 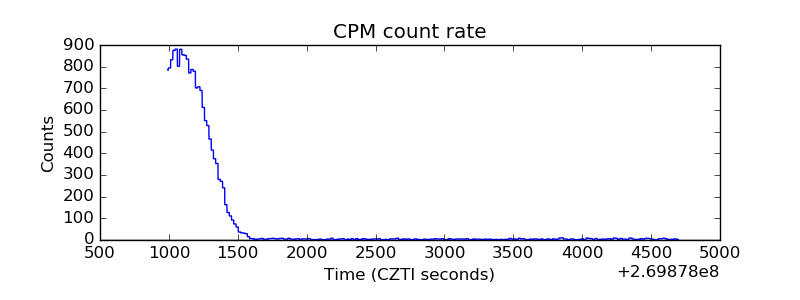 |
| CZT Counter |  |
| +2.5 Volts monitor |  |
| +5 Volts monitor |  |
| _ROLL_ROT | 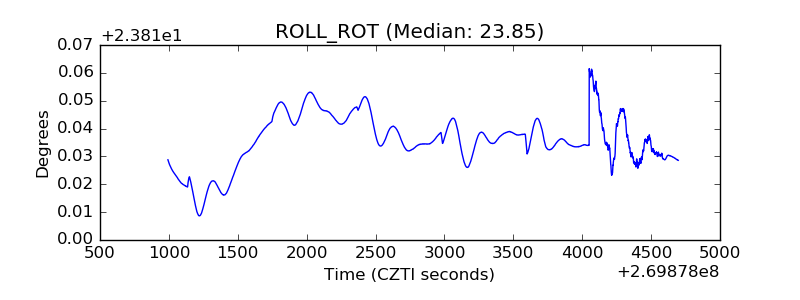 |
| _Roll_DEC | 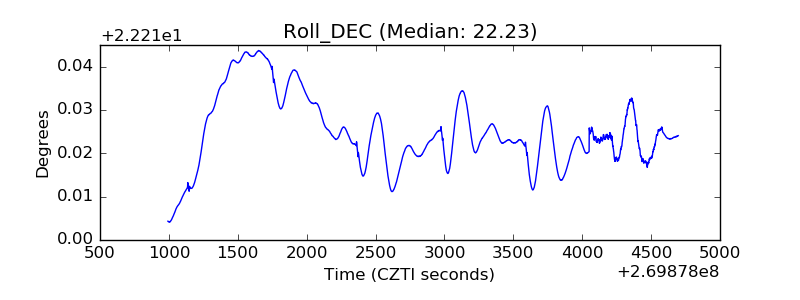 |
| _Roll_RA | 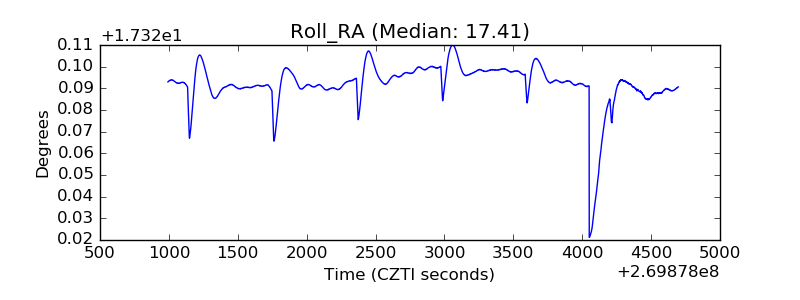 |
| Veto Counter | 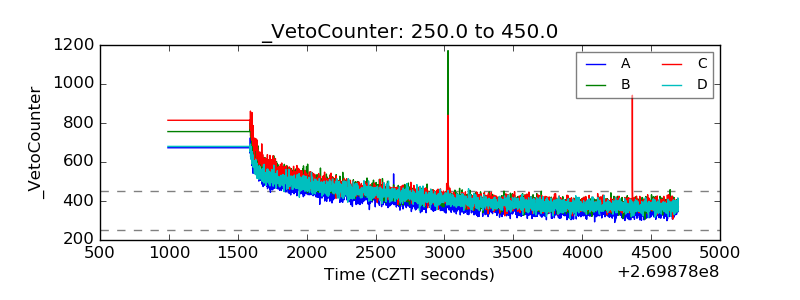 |