| Param | Original file | Final file |
|---|---|---|
| Filename | modeM0/AS1T02_071T01_9000002246cztM0_level2.fits | modeM0/AS1T02_071T01_9000002246cztM0_level2_quad_clean.evt |
| Size (bytes) | 458,429,760 | 521,887,680 |
| Size | 437.2 MB | 497.7 MB |
| Events in quadrant A | 2,771,310 | 3,184,025 |
| Events in quadrant B | 2,614,962 | 3,107,252 |
| Events in quadrant C | 2,756,880 | 3,209,585 |
| Events in quadrant D | 2,430,032 | 2,997,182 |
| Mode SS | |||
|---|---|---|---|
| Quadrant | BADHDUFLAG | Total packets | Discarded packets |
| A | 0 | 978 | 0 |
| B | 0 | 978 | 0 |
| C | 0 | 978 | 0 |
| D | 0 | 978 | 0 |
| Mode M9 | |||
|---|---|---|---|
| Quadrant | BADHDUFLAG | Total packets | Discarded packets |
| A | 0 | 93 | 0 |
| B | 0 | 93 | 0 |
| C | 0 | 93 | 0 |
| D | 0 | 93 | 0 |
| Mode M0 | |||
|---|---|---|---|
| Quadrant | BADHDUFLAG | Total packets | Discarded packets |
| A | 0 | 148369 | 0 |
| B | 0 | 139334 | 0 |
| C | 0 | 136554 | 0 |
| D | 0 | 103638 | 0 |
| Quadrant | Total seconds | Saturated seconds | Saturation percentage |
|---|---|---|---|
| A | 48209 | 2427 | 5.034330% |
| B | 48209 | 4441 | 9.211973% |
| C | 48209 | 950 | 1.970586% |
| D | 48209 | 470 | 0.974922% |
Noise dominated data is calculated using 1-second bins in cleaned event files. If a bin has >2000 counts, and if more than 50% of those come from <1% of pixels, then it is considered to be noise-dominated and hence unusable.
| Quadrant | # 1 sec bins | Bins with >0 counts | Bins with >2000 counts | High rate bins dominated by noise | Noise dominated (total time) | Noise dominated (detector-on time) | Marked lightcurve |
|---|---|---|---|---|---|---|---|
| A | 62838 | 48208 | 0 | 0 | 0.00% | 0.00% | 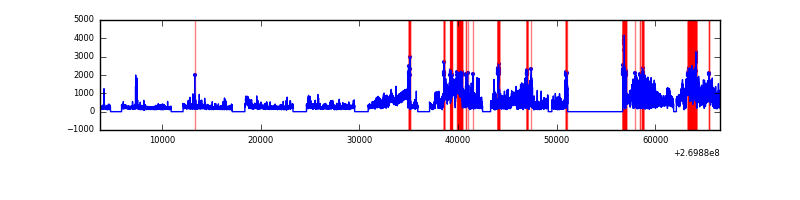 |
| B | 62838 | 48057 | 0 | 0 | 0.00% | 0.00% |  |
| C | 62838 | 48207 | 0 | 0 | 0.00% | 0.00% |  |
| D | 62838 | 48208 | 0 | 0 | 0.00% | 0.00% |  |
Top three noisy pixels from each quadrant. If the there are fewer than three noisy pixels in the level2.evt file, extra rows are filled as -1
| Pixel properties | Quadrant properties | ||||||
|---|---|---|---|---|---|---|---|
| Quadrant | DetID | PixID | Counts | Sigma | Mean | Median | Sigma |
| A | 0 | 29 | 2636 | 11.1 | 720 | 680 | 176.2 |
| A | 7 | 110 | 2194 | 8.59 | 720 | 680 | 176.2 |
| A | 9 | 19 | 2155 | 8.37 | 720 | 680 | 176.2 |
| B | 2 | 9 | 2229 | 11.84 | 692 | 666 | 132.1 |
| B | 14 | 254 | 1757 | 8.26 | 692 | 666 | 132.1 |
| B | 3 | 17 | 1736 | 8.1 | 692 | 666 | 132.1 |
| C | 12 | 241 | 1973 | 6.9 | 729 | 687 | 186.5 |
| C | 7 | 111 | 1864 | 6.31 | 729 | 687 | 186.5 |
| C | 3 | 126 | 1851 | 6.24 | 729 | 687 | 186.5 |
| D | 6 | 231 | 1807 | 6.28 | 693 | 630 | 187.4 |
| D | 3 | 14 | 1767 | 6.07 | 693 | 630 | 187.4 |
| D | 6 | 67 | 1709 | 5.76 | 693 | 630 | 187.4 |
Histogram calculated using DETX and DETY for each event in the final _common_clean file
| Quadrant A | 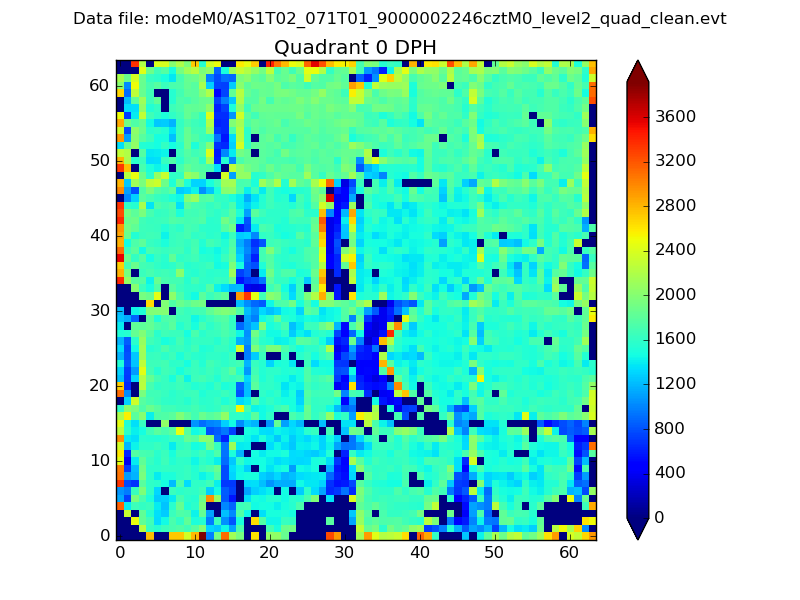 |
 |
Quadrant B |
|---|---|---|---|
| Quadrant D |  |
 |
Quadrant C |
| Plot type | Count rate plots | Images |
|---|---|---|
| Comparison with Poisson distribution Blue bars denote a histogram of data divided into 1 sec bins. Red curve is a Poisson curve with rate = median count rate of data. |
 |
 |
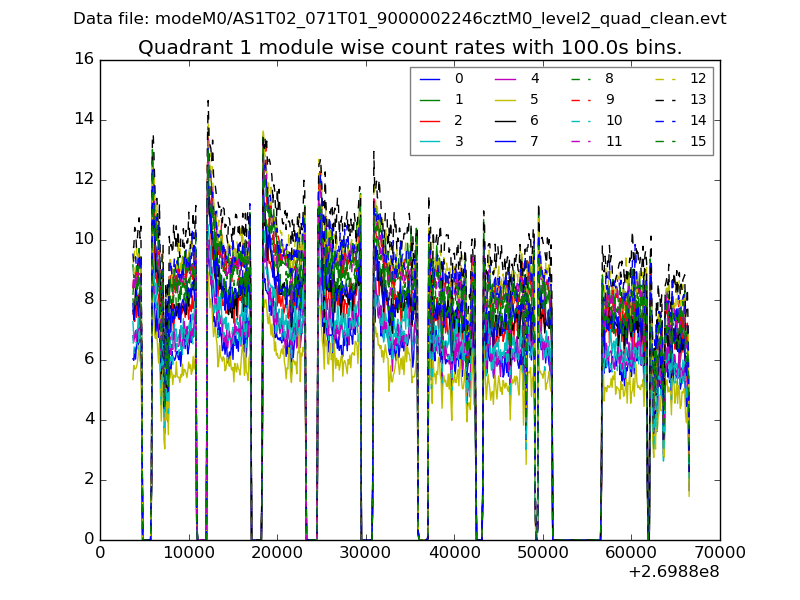
| Quadrant-wise count rates Data is divided into 100 sec bins |
 |
|
| Module-wise count rates for Quadrant A Data is divided into 100 sec bins |
 |
 |
| Module-wise count rates for Quadrant B Data is divided into 100 sec bins |
 |
 |
| Module-wise count rates for Quadrant C Data is divided into 100 sec bins |
 |
 |
| Module-wise count rates for Quadrant D Data is divided into 100 sec bins |
 |
 |
| Parameter | Plot |
|---|---|
| CZT HV Monitor | 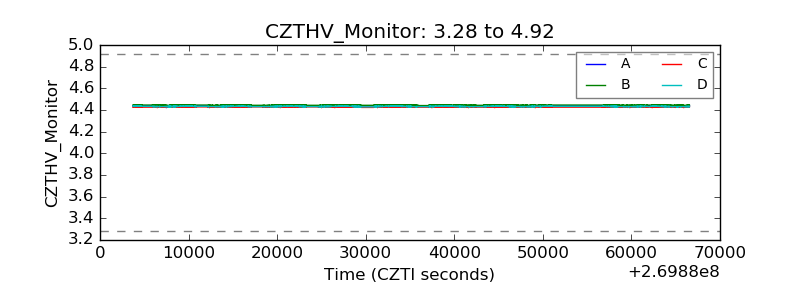 |
| D_VDD |  |
| Temperature 1 | 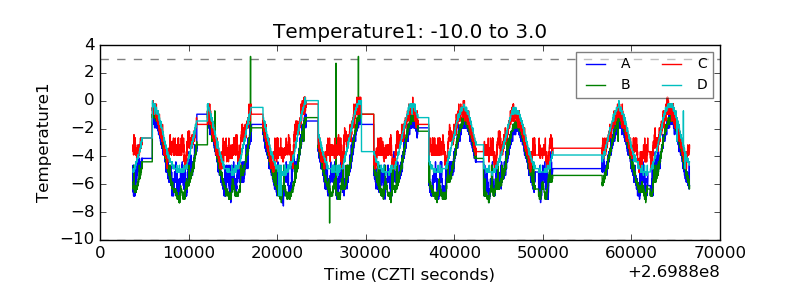 |
| Veto HV Monitor | 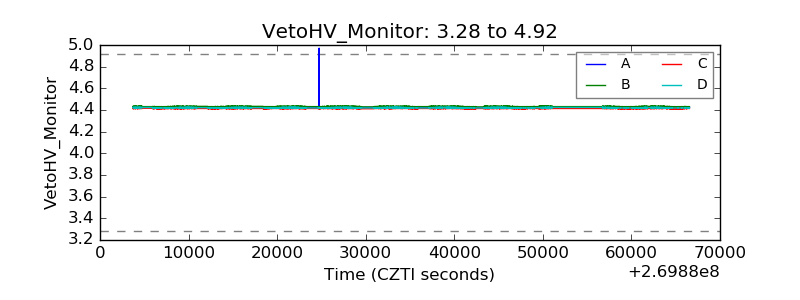 |
| Veto LLD |  |
| Alpha Counter | 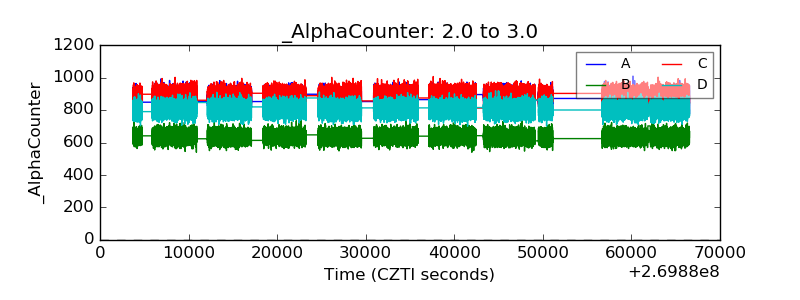 |
| _CPM_Rate |  |
| CZT Counter | 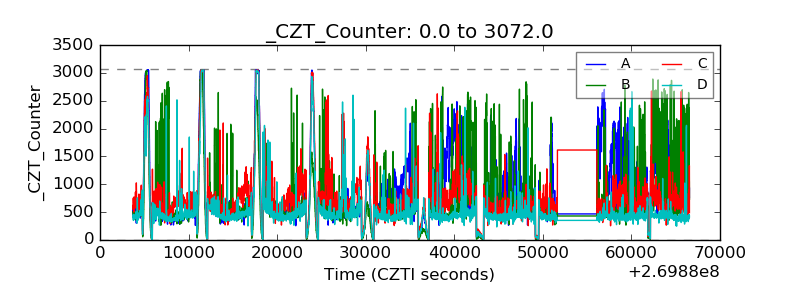 |
| +2.5 Volts monitor | 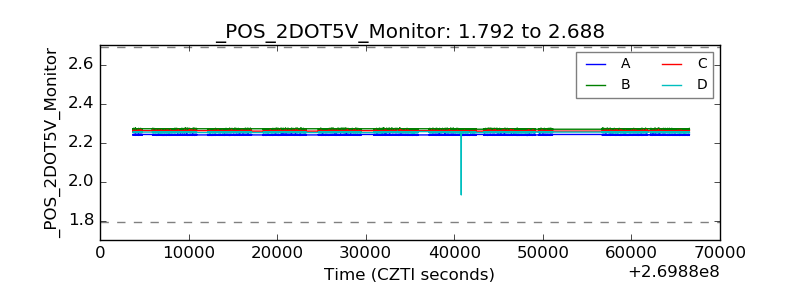 |
| +5 Volts monitor | 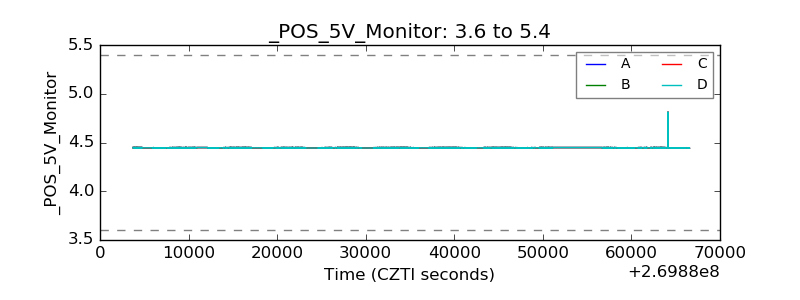 |
| _ROLL_ROT | 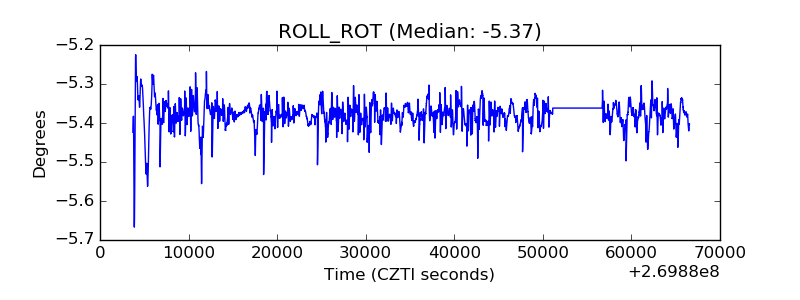 |
| _Roll_DEC | 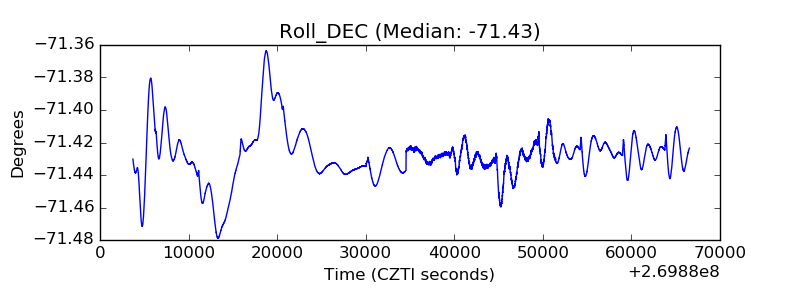 |
| _Roll_RA |  |
| Veto Counter |  |