| Param | Original file | Final file |
|---|---|---|
| Filename | modeM0/AS1T02_071T01_9000002246_15208cztM0_level2.evt | modeM0/AS1T02_071T01_9000002246_15208cztM0_level2_quad_clean.evt |
| Size (bytes) | 187,545,600 | 47,275,200 |
| Size | 178.9 MB | 45.1 MB |
| Events in quadrant A | 1,195,942 | 322,317 |
| Events in quadrant B | 1,588,592 | 314,493 |
| Events in quadrant C | 1,591,164 | 320,513 |
| Events in quadrant D | 1,146,334 | 308,797 |
| Mode SS | |||
|---|---|---|---|
| Quadrant | BADHDUFLAG | Total packets | Discarded packets |
| A | 0 | 46 | 0 |
| B | 0 | 46 | 0 |
| C | 0 | 46 | 0 |
| D | 0 | 46 | 0 |
| Mode M9 | |||
|---|---|---|---|
| Quadrant | BADHDUFLAG | Total packets | Discarded packets |
| A | 0 | 12 | 0 |
| B | 0 | 12 | 0 |
| C | 0 | 12 | 0 |
| D | 0 | 12 | 0 |
| Mode M0 | |||
|---|---|---|---|
| Quadrant | BADHDUFLAG | Total packets | Discarded packets |
| A | 0 | 4988 | 2 |
| B | 0 | 6271 | 1 |
| C | 0 | 6500 | 1 |
| D | 0 | 4902 | 1 |
| Quadrant | Total seconds | Saturated seconds | Saturation percentage |
|---|---|---|---|
| A | 2296 | 28 | 1.219512% |
| B | 2296 | 188 | 8.188153% |
| C | 2296 | 21 | 0.914634% |
| D | 2296 | 21 | 0.914634% |
Noise dominated data is calculated using 1-second bins in cleaned event files. If a bin has >2000 counts, and if more than 50% of those come from <1% of pixels, then it is considered to be noise-dominated and hence unusable.
| Quadrant | # 1 sec bins | Bins with >0 counts | Bins with >2000 counts | High rate bins dominated by noise | Noise dominated (total time) | Noise dominated (detector-on time) | Marked lightcurve |
|---|---|---|---|---|---|---|---|
| A | 3418 | 2297 | 0 | 0 | 0.00% | 0.00% | 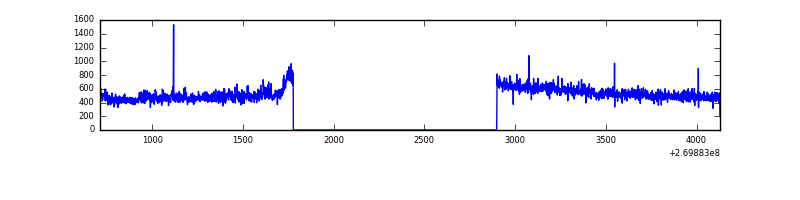 |
| B | 3418 | 2297 | 88 | 88 | 2.57% | 3.83% | 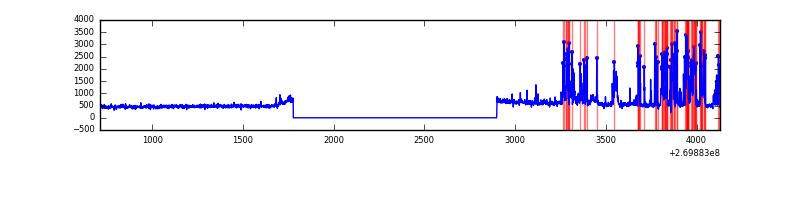 |
| C | 3418 | 2297 | 0 | 0 | 0.00% | 0.00% | 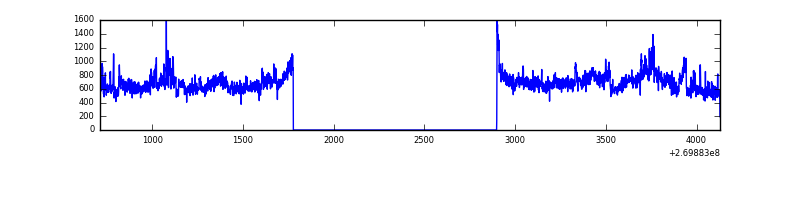 |
| D | 3418 | 2298 | 3 | 3 | 0.09% | 0.13% | 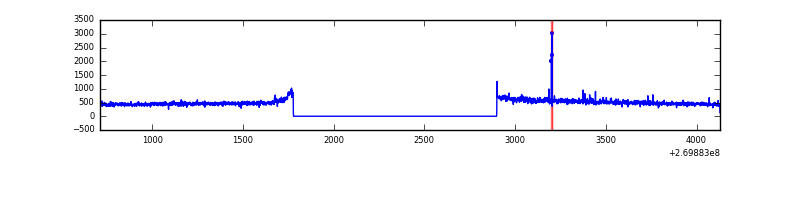 |
Top three noisy pixels from each quadrant. If the there are fewer than three noisy pixels in the level2.evt file, extra rows are filled as -1
| Pixel properties | Quadrant properties | ||||||
|---|---|---|---|---|---|---|---|
| Quadrant | DetID | PixID | Counts | Sigma | Mean | Median | Sigma |
| A | 12 | 189 | 25514 | 403.82 | 304 | 297 | 62.4 |
| A | 0 | 226 | 2741 | 39.14 | 304 | 297 | 62.4 |
| A | 12 | 194 | 2399 | 33.66 | 304 | 297 | 62.4 |
| B | 3 | 64 | 229781 | 3991.42 | 293 | 286 | 57.5 |
| B | 10 | 245 | 207793 | 3609.0 | 293 | 286 | 57.5 |
| B | 12 | 111 | 5970 | 98.86 | 293 | 286 | 57.5 |
| C | 3 | 233 | 413346 | 6075.23 | 291 | 292 | 68.0 |
| C | 7 | 247 | 41940 | 612.56 | 291 | 292 | 68.0 |
| C | 13 | 61 | 2080 | 26.3 | 291 | 292 | 68.0 |
| D | 10 | 70 | 8998 | 120.29 | 295 | 285 | 72.4 |
| D | 2 | 234 | 8635 | 115.28 | 295 | 285 | 72.4 |
| D | 7 | 38 | 7160 | 94.91 | 295 | 285 | 72.4 |
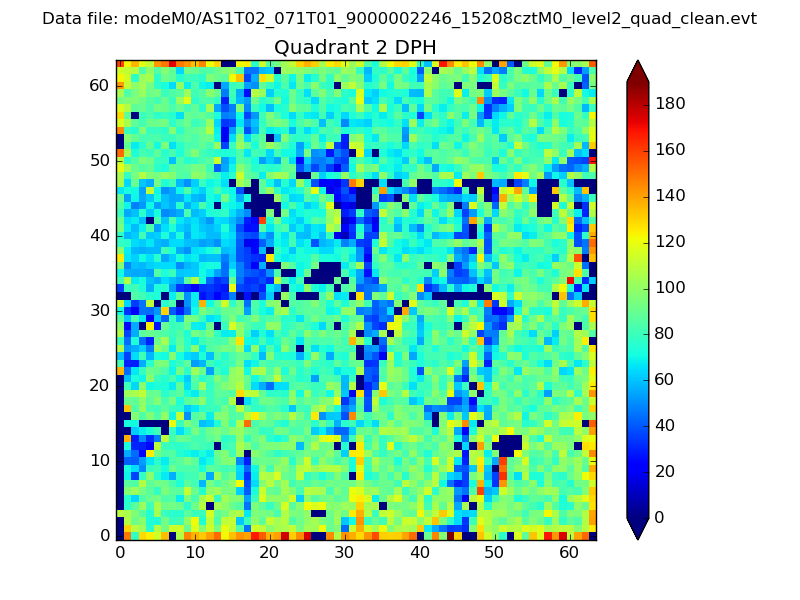
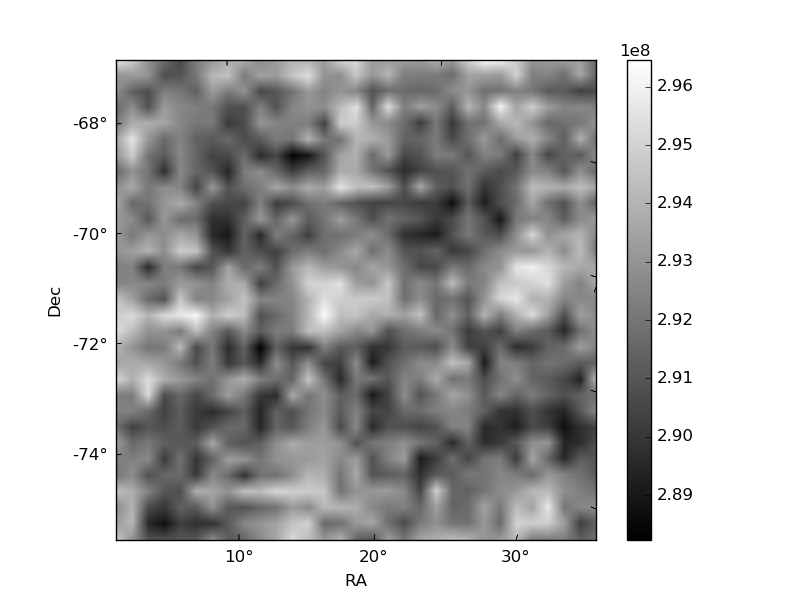
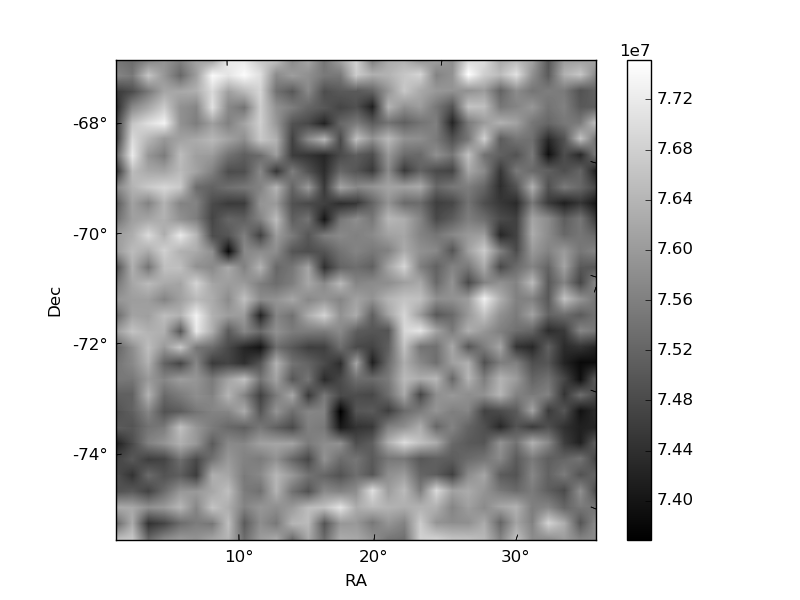
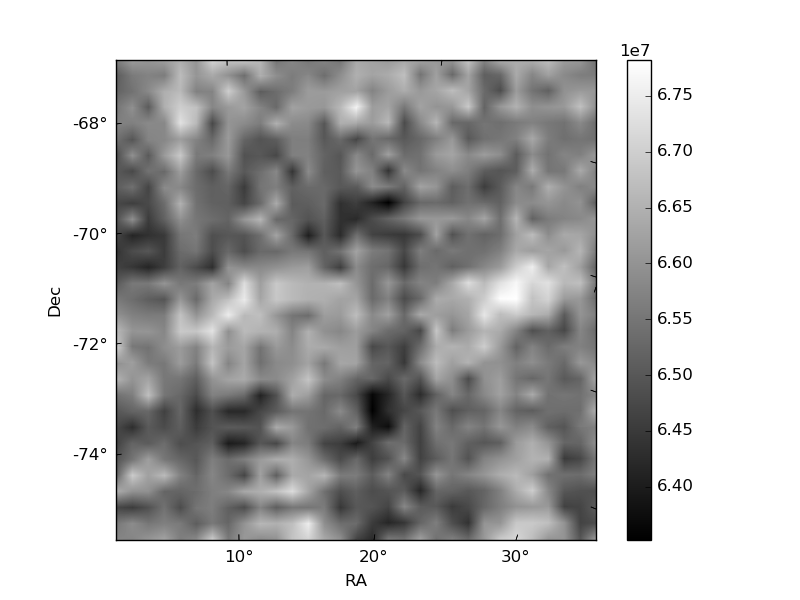
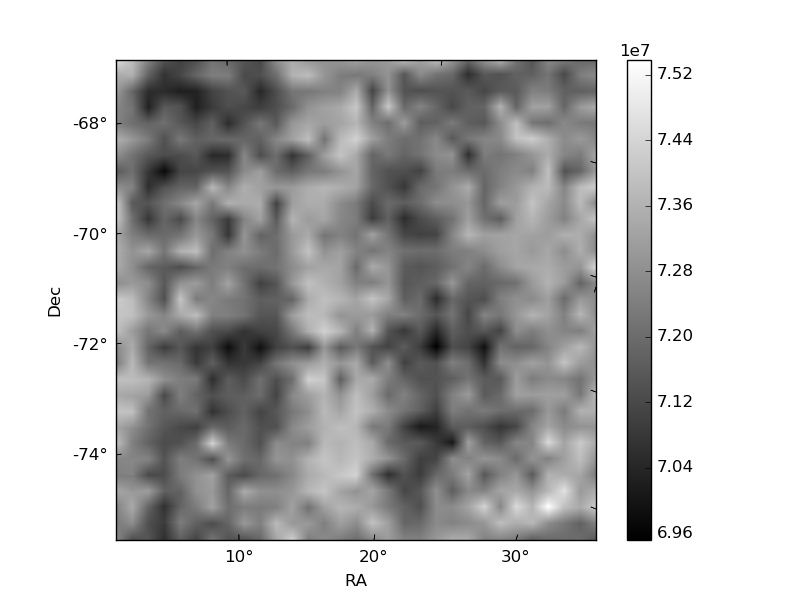
Histogram calculated using DETX and DETY for each event in the final _common_clean file
| Quadrant A | 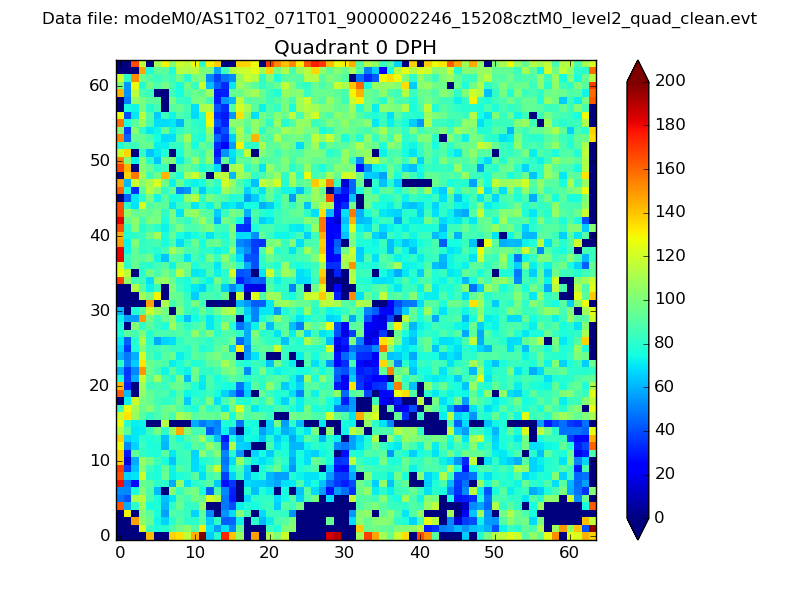 |
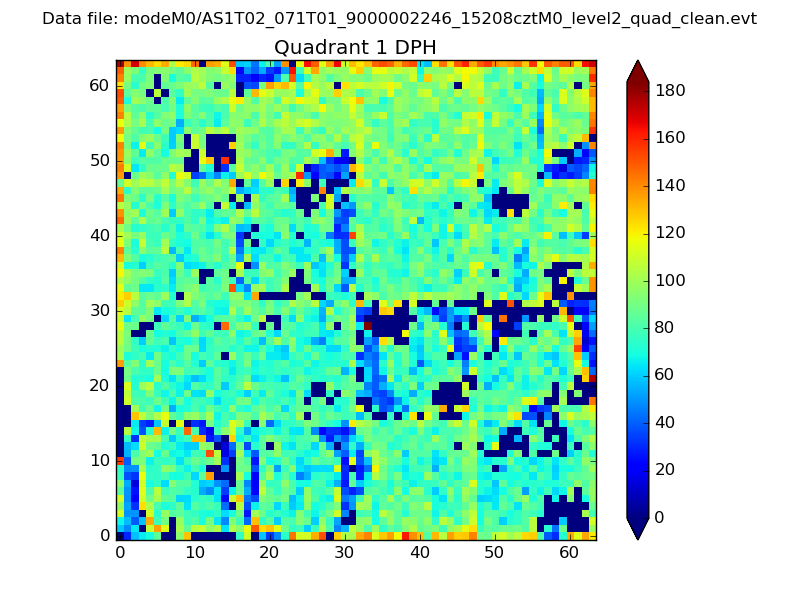 |
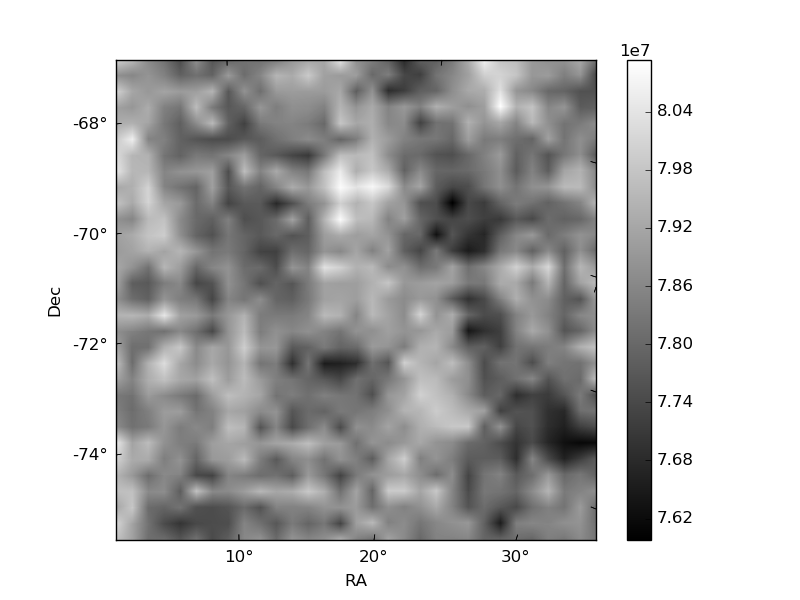
Quadrant B |
|---|---|---|---|
| Quadrant D | 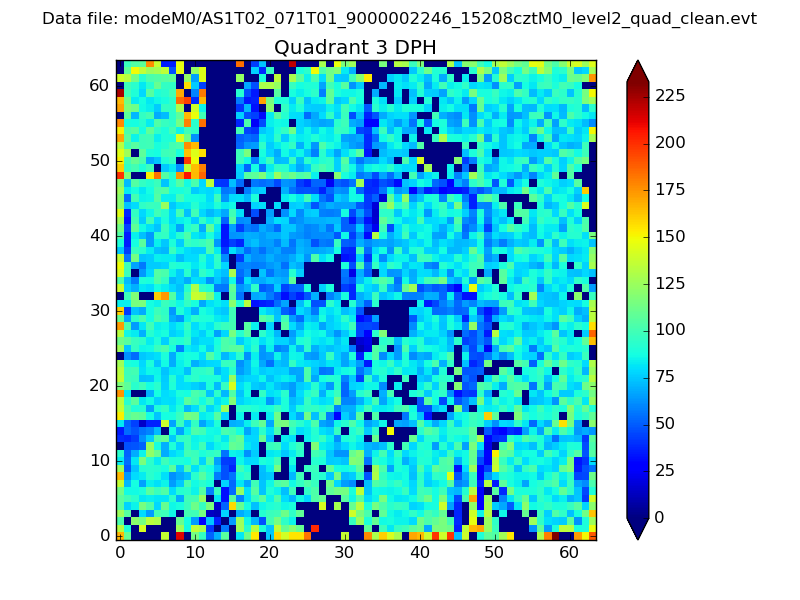 |
 |
Quadrant C |
| Plot type | Count rate plots | Images |
|---|---|---|
| Comparison with Poisson distribution Blue bars denote a histogram of data divided into 1 sec bins. Red curve is a Poisson curve with rate = median count rate of data. |
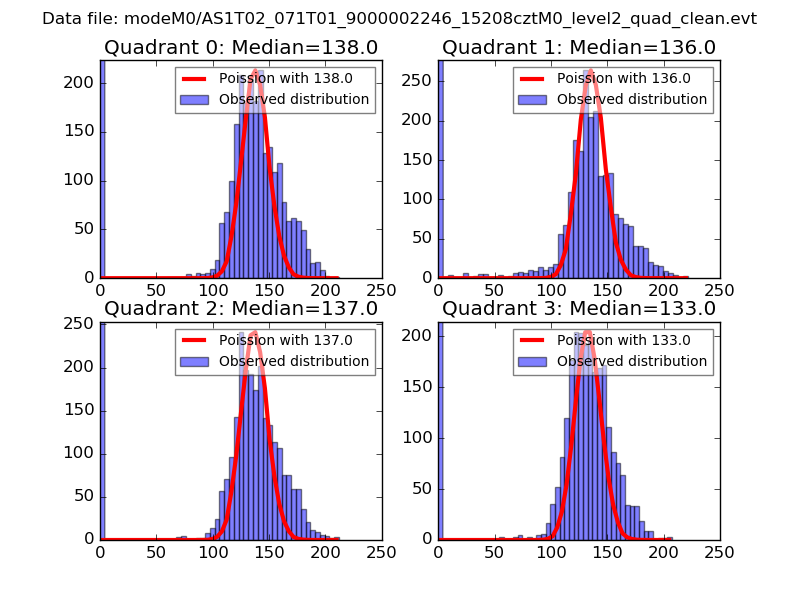 |
 |
| Quadrant-wise count rates Data is divided into 100 sec bins |
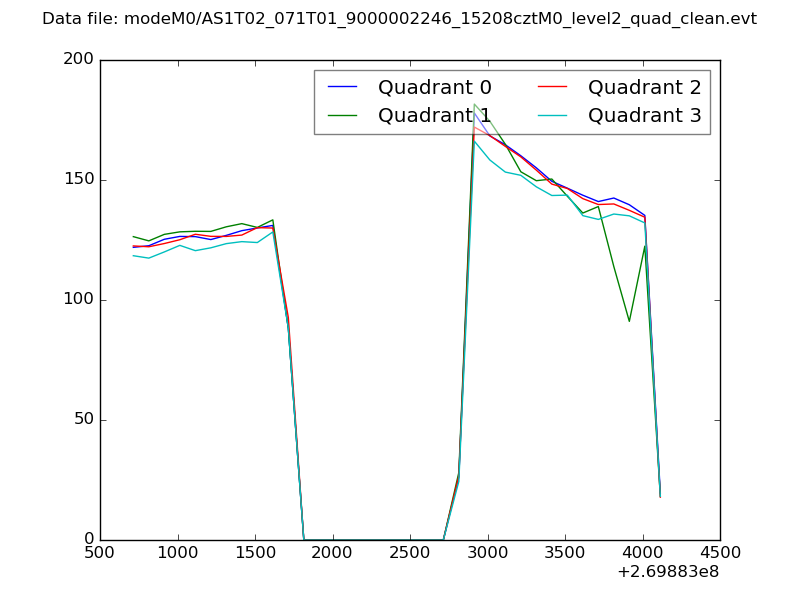 |
|
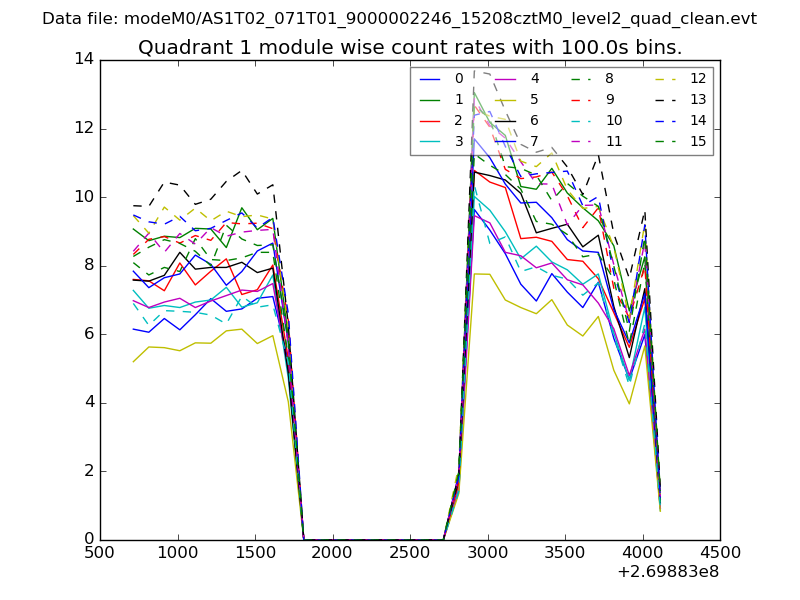
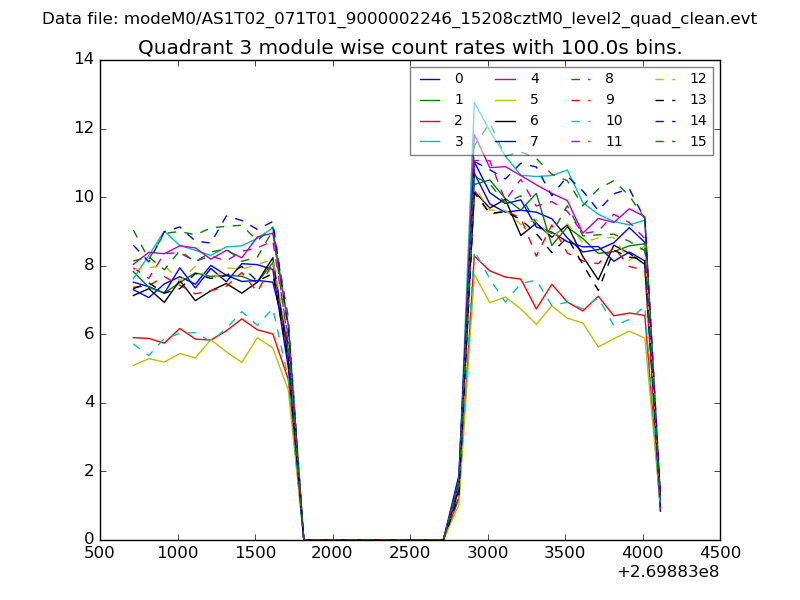
| Module-wise count rates for Quadrant A Data is divided into 100 sec bins |
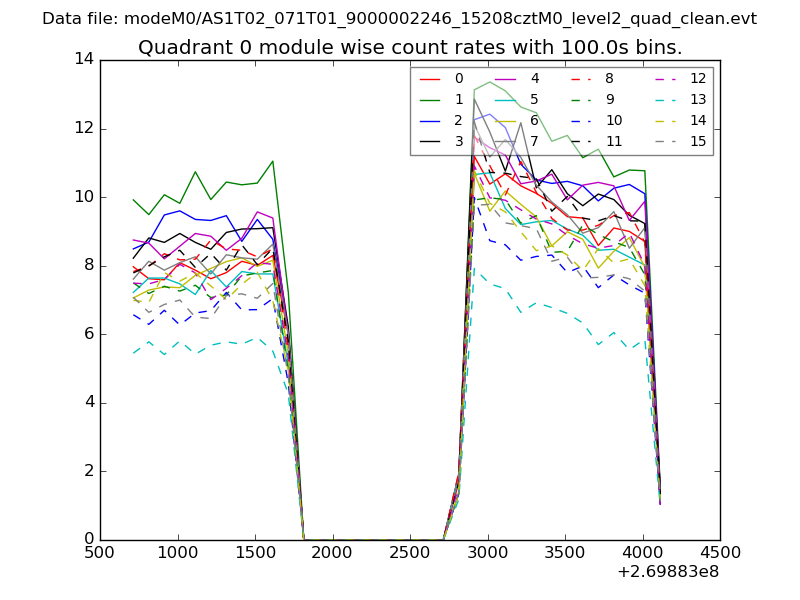 |
 |
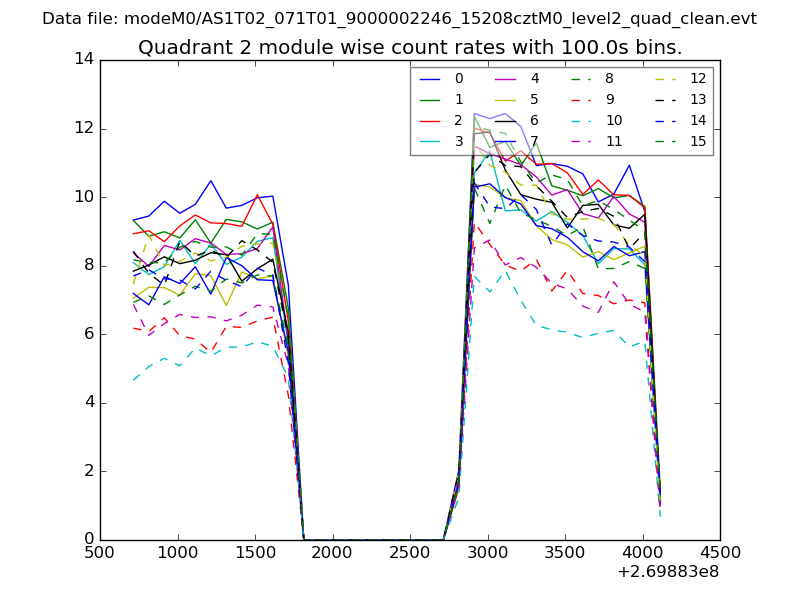
| Module-wise count rates for Quadrant B Data is divided into 100 sec bins |
 |
 |
| Module-wise count rates for Quadrant C Data is divided into 100 sec bins |
 |
 |
| Module-wise count rates for Quadrant D Data is divided into 100 sec bins |
 |
 |
| Parameter | Plot |
|---|---|
| CZT HV Monitor | 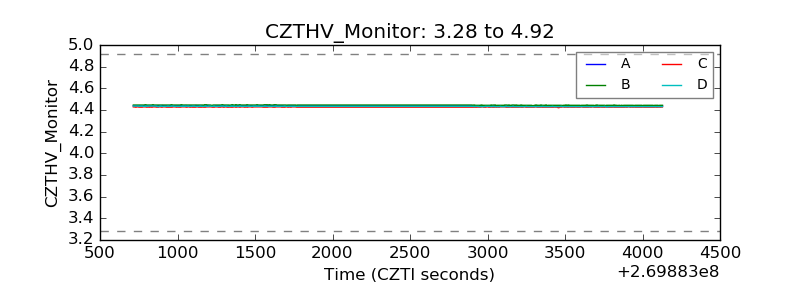 |
| D_VDD | 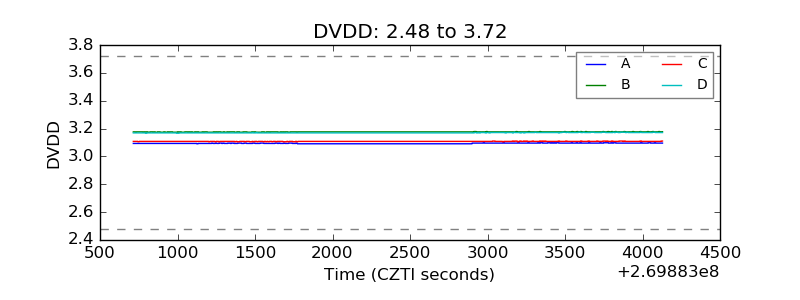 |
| Temperature 1 | 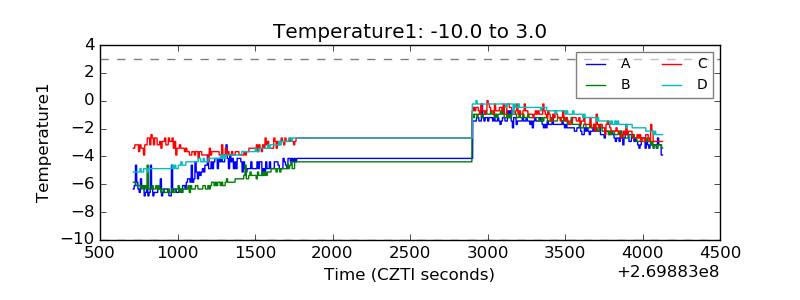 |
| Veto HV Monitor | 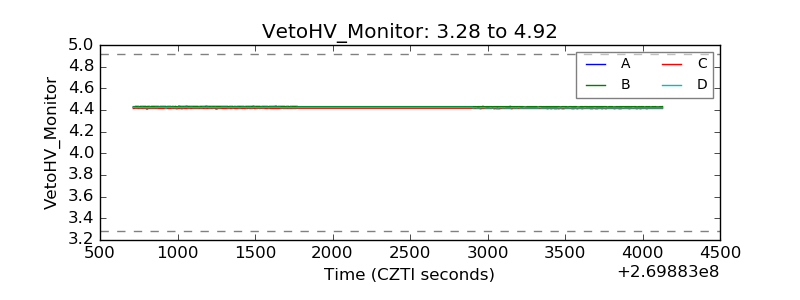 |
| Veto LLD | 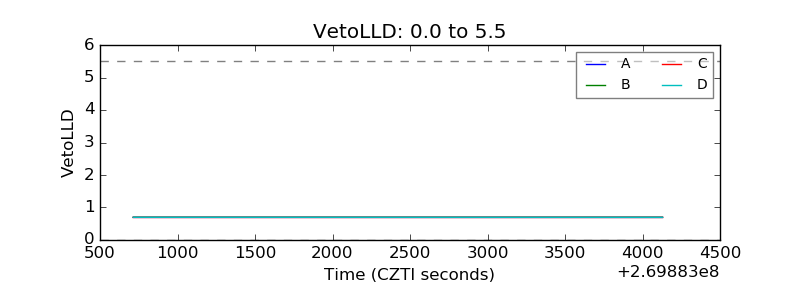 |
| Alpha Counter | 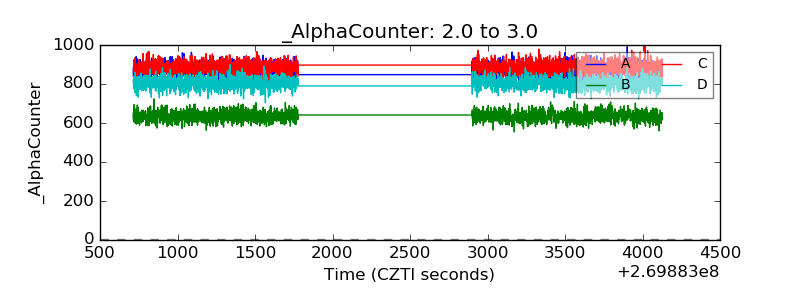 |
| _CPM_Rate | 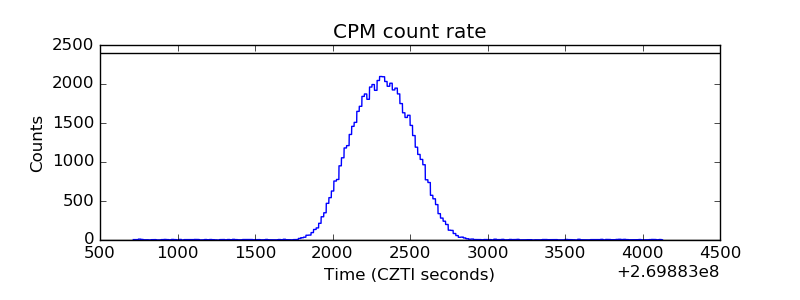 |
| CZT Counter | 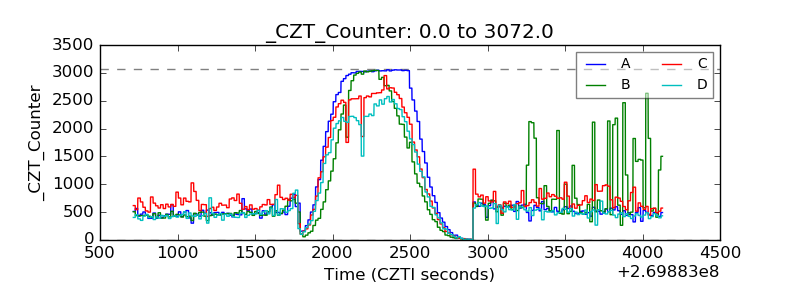 |
| +2.5 Volts monitor |  |
| +5 Volts monitor | 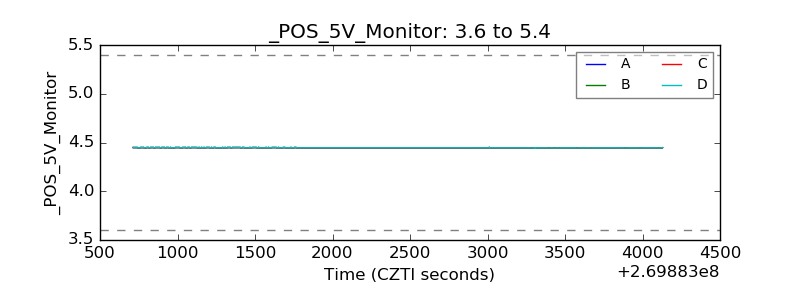 |
| _ROLL_ROT | 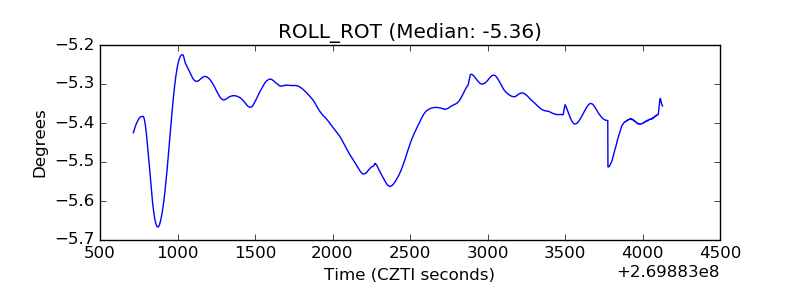 |
| _Roll_DEC |  |
| _Roll_RA | 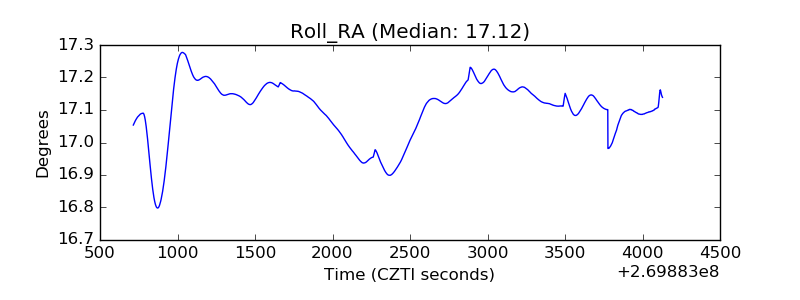 |
| Veto Counter | 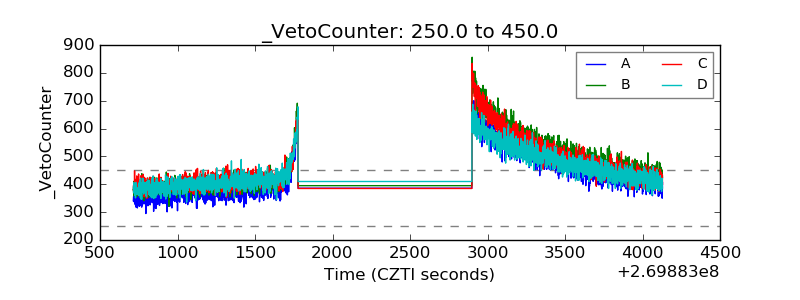 |