| Param | Original file | Final file |
|---|---|---|
| Filename | modeM0/AS1T02_071T01_9000002246_15210cztM0_level2.evt | modeM0/AS1T02_071T01_9000002246_15210cztM0_level2_quad_clean.evt |
| Size (bytes) | 505,411,200 | 126,509,760 |
| Size | 482.0 MB | 120.6 MB |
| Events in quadrant A | 3,112,869 | 870,641 |
| Events in quadrant B | 4,425,245 | 842,499 |
| Events in quadrant C | 4,197,388 | 857,376 |
| Events in quadrant D | 3,146,813 | 824,764 |
| Mode SS | |||
|---|---|---|---|
| Quadrant | BADHDUFLAG | Total packets | Discarded packets |
| A | 0 | 126 | 0 |
| B | 0 | 126 | 0 |
| C | 0 | 126 | 0 |
| D | 0 | 126 | 0 |
| Mode M9 | |||
|---|---|---|---|
| Quadrant | BADHDUFLAG | Total packets | Discarded packets |
| A | 0 | 12 | 0 |
| B | 0 | 12 | 0 |
| C | 0 | 12 | 0 |
| D | 0 | 13 | 0 |
| Mode M0 | |||
|---|---|---|---|
| Quadrant | BADHDUFLAG | Total packets | Discarded packets |
| A | 0 | 13450 | 3 |
| B | 0 | 17493 | 2 |
| C | 0 | 17143 | 2 |
| D | 0 | 13692 | 2 |
| Quadrant | Total seconds | Saturated seconds | Saturation percentage |
|---|---|---|---|
| A | 6255 | 49 | 0.783373% |
| B | 6255 | 547 | 8.745004% |
| C | 6255 | 36 | 0.575540% |
| D | 6255 | 54 | 0.863309% |
Noise dominated data is calculated using 1-second bins in cleaned event files. If a bin has >2000 counts, and if more than 50% of those come from <1% of pixels, then it is considered to be noise-dominated and hence unusable.
| Quadrant | # 1 sec bins | Bins with >0 counts | Bins with >2000 counts | High rate bins dominated by noise | Noise dominated (total time) | Noise dominated (detector-on time) | Marked lightcurve |
|---|---|---|---|---|---|---|---|
| A | 7461 | 6257 | 6 | 6 | 0.08% | 0.10% | 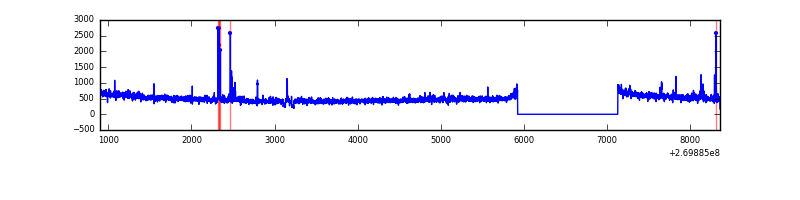 |
| B | 7461 | 6256 | 374 | 374 | 5.01% | 5.98% | 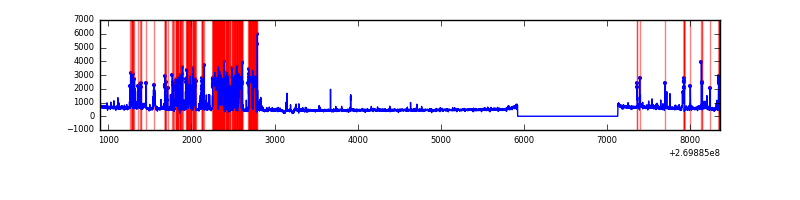 |
| C | 7461 | 6256 | 0 | 0 | 0.00% | 0.00% | 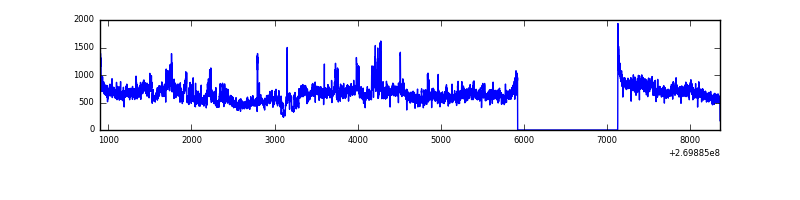 |
| D | 7461 | 6257 | 31 | 31 | 0.42% | 0.50% | 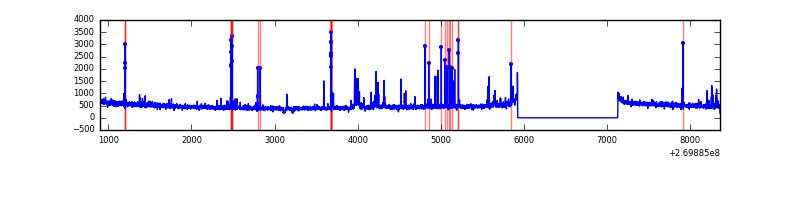 |
Top three noisy pixels from each quadrant. If the there are fewer than three noisy pixels in the level2.evt file, extra rows are filled as -1
| Pixel properties | Quadrant properties | ||||||
|---|---|---|---|---|---|---|---|
| Quadrant | DetID | PixID | Counts | Sigma | Mean | Median | Sigma |
| A | 12 | 189 | 62464 | 395.78 | 780 | 764 | 155.9 |
| A | 9 | 143 | 26231 | 163.36 | 780 | 764 | 155.9 |
| A | 13 | 248 | 14080 | 85.42 | 780 | 764 | 155.9 |
| B | 3 | 64 | 1052472 | 7486.11 | 752 | 735 | 140.5 |
| B | 10 | 245 | 274713 | 1950.13 | 752 | 735 | 140.5 |
| B | 3 | 112 | 56843 | 399.37 | 752 | 735 | 140.5 |
| C | 3 | 233 | 1285863 | 7578.5 | 745 | 750 | 169.6 |
| C | 7 | 247 | 5568 | 28.41 | 745 | 750 | 169.6 |
| C | 13 | 61 | 5418 | 27.53 | 745 | 750 | 169.6 |
| D | 2 | 33 | 172646 | 948.31 | 749 | 725 | 181.3 |
| D | 7 | 38 | 55237 | 300.69 | 749 | 725 | 181.3 |
| D | 13 | 104 | 24158 | 129.26 | 749 | 725 | 181.3 |
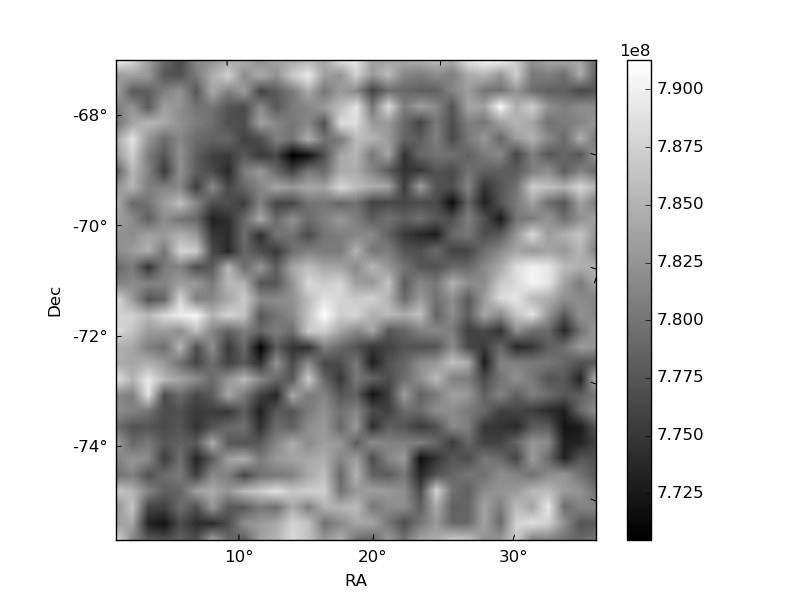
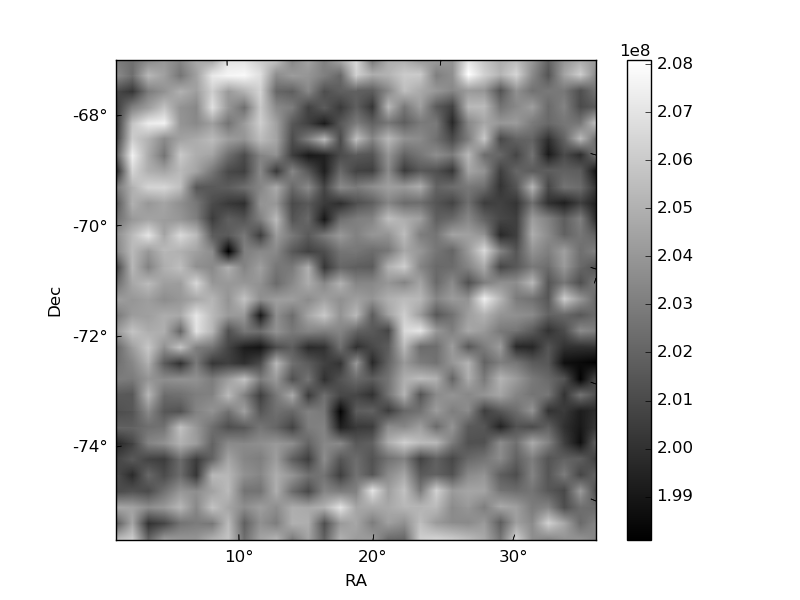
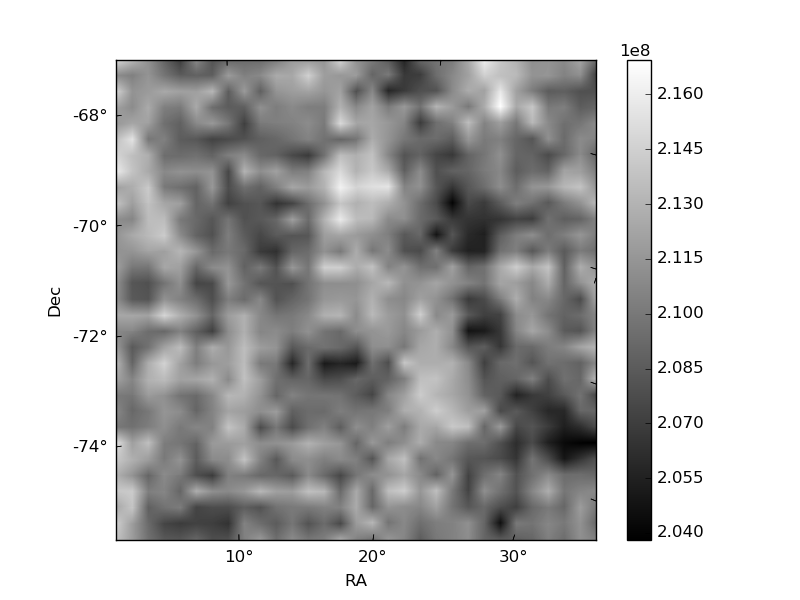
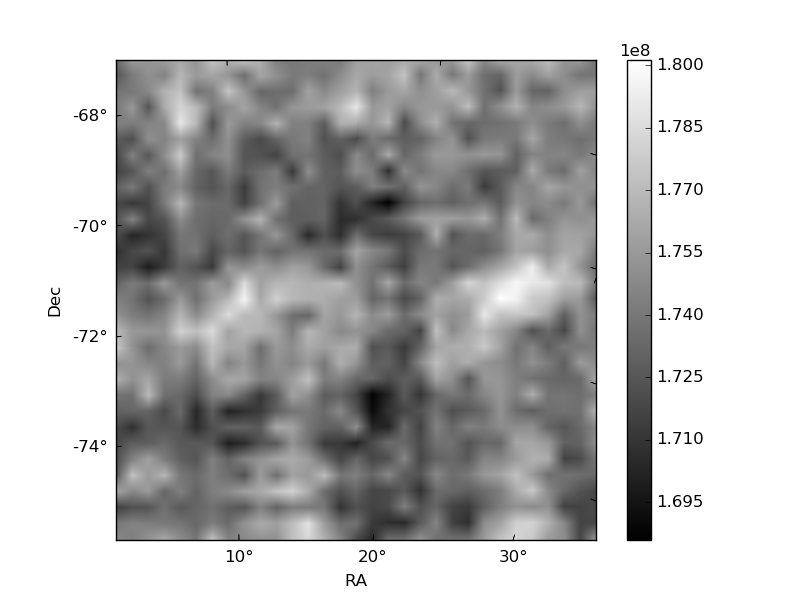
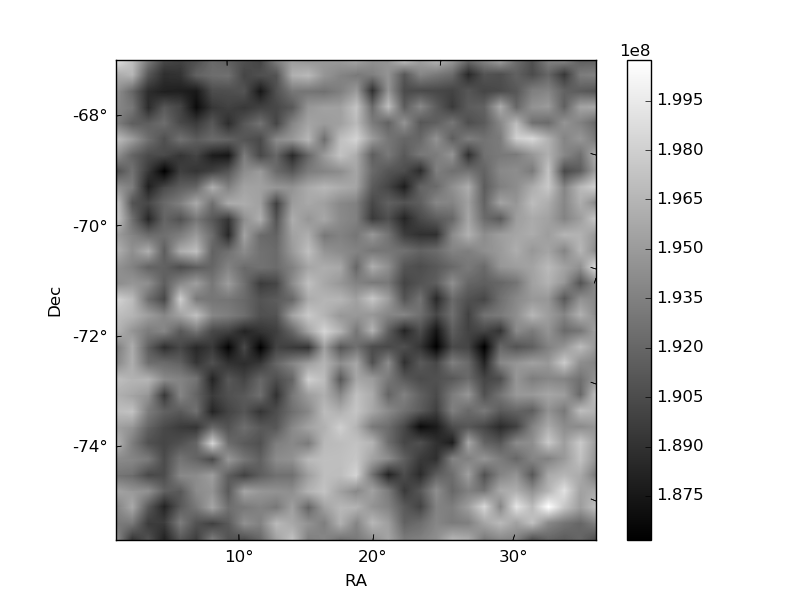
Histogram calculated using DETX and DETY for each event in the final _common_clean file
| Quadrant A | 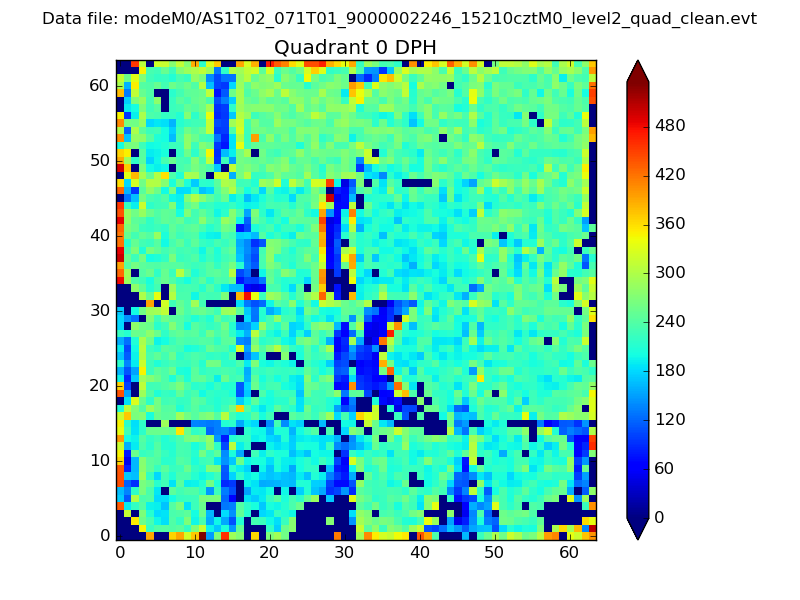 |
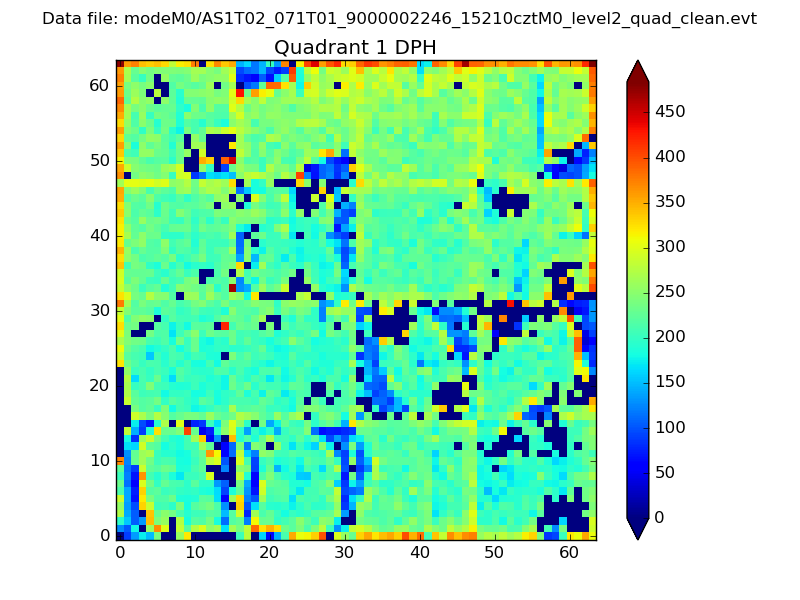 |
Quadrant B |
|---|---|---|---|
| Quadrant D | 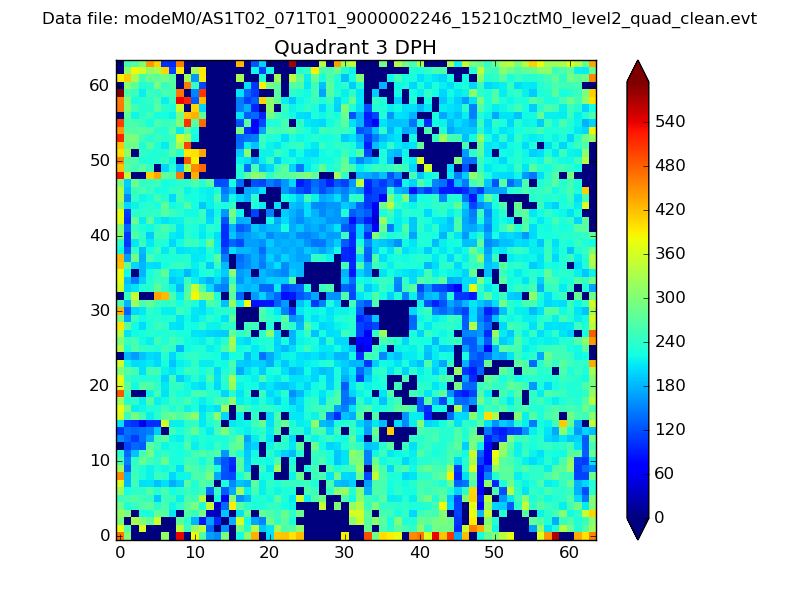 |
 |
Quadrant C |
| Plot type | Count rate plots | Images |
|---|---|---|
| Comparison with Poisson distribution Blue bars denote a histogram of data divided into 1 sec bins. Red curve is a Poisson curve with rate = median count rate of data. |
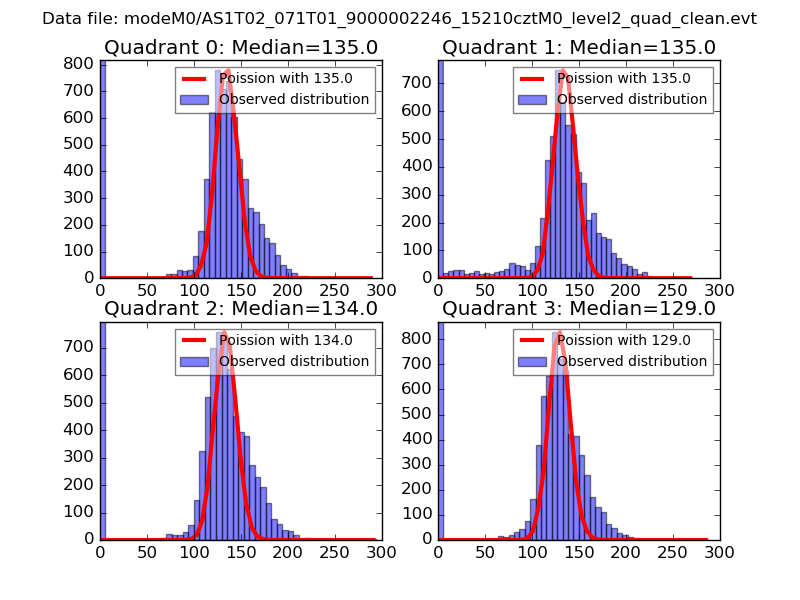 |
 |
| Quadrant-wise count rates Data is divided into 100 sec bins |
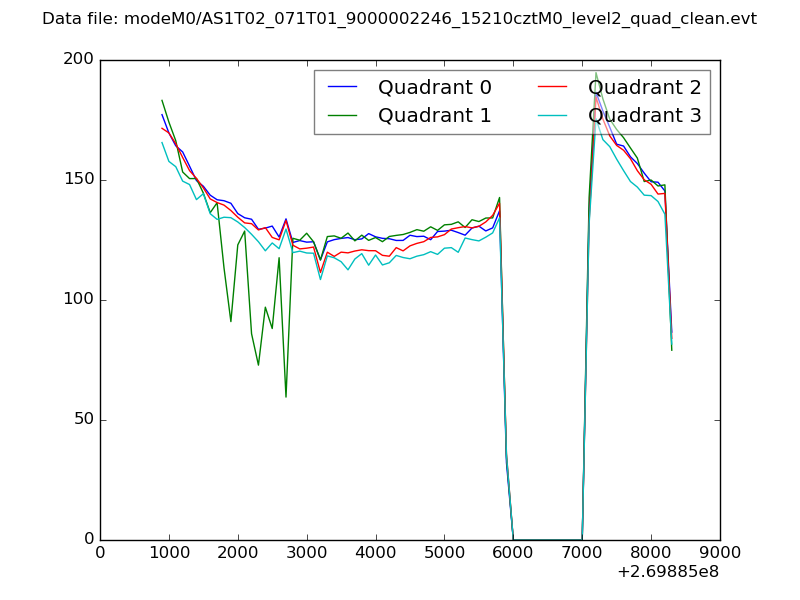 |
|
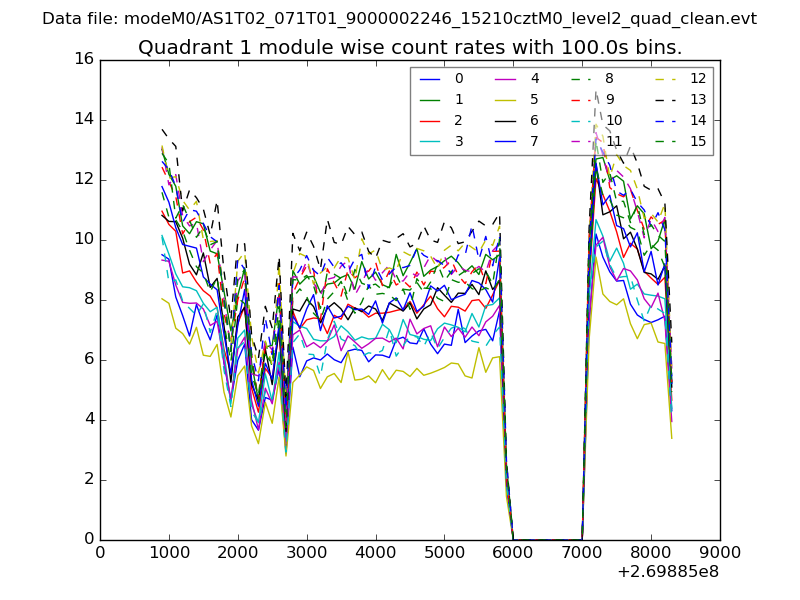
| Module-wise count rates for Quadrant A Data is divided into 100 sec bins |
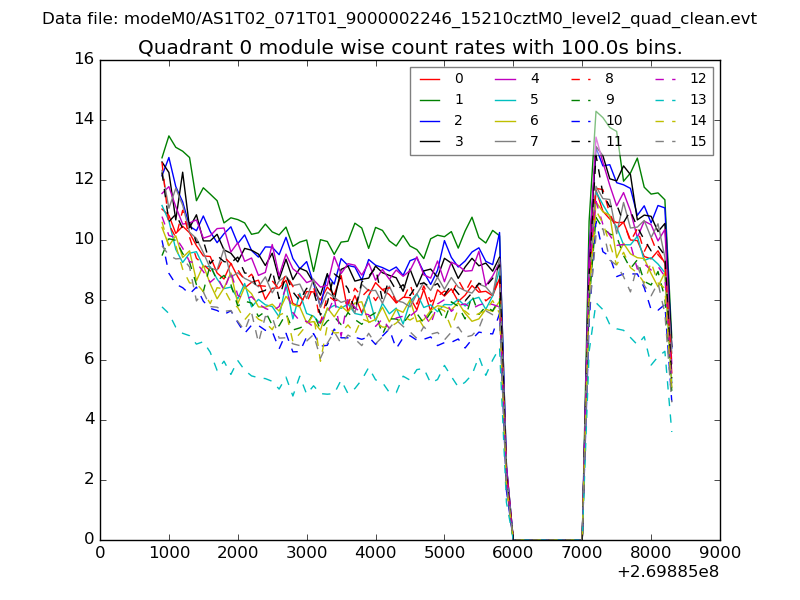 |
 |
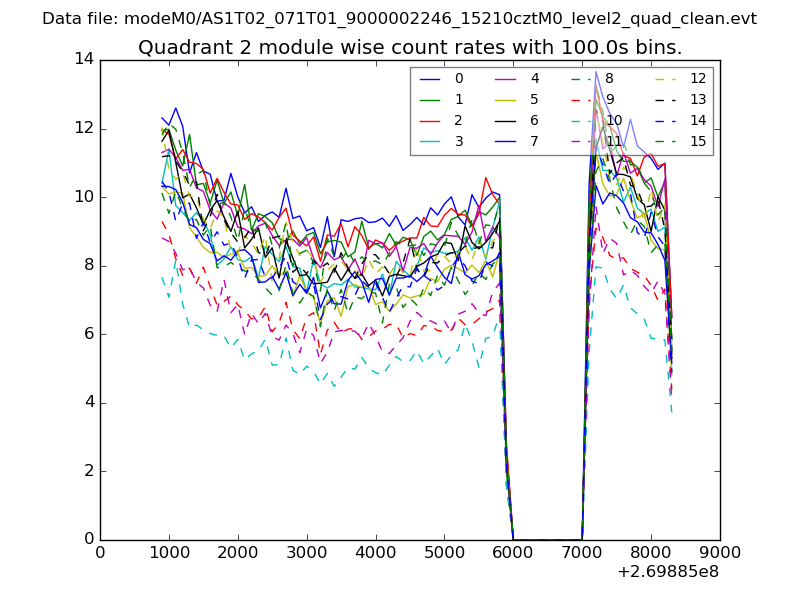
| Module-wise count rates for Quadrant B Data is divided into 100 sec bins |
 |
 |
| Module-wise count rates for Quadrant C Data is divided into 100 sec bins |
 |
 |
| Module-wise count rates for Quadrant D Data is divided into 100 sec bins |
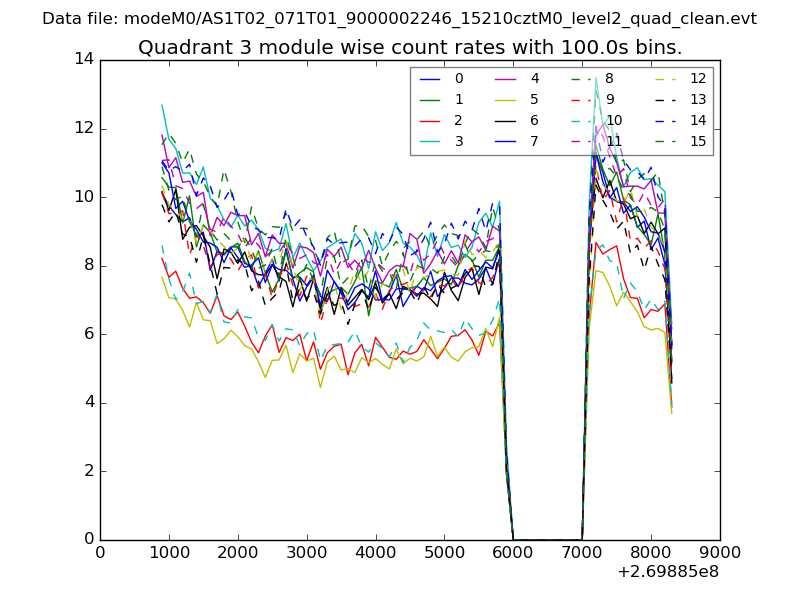 |
 |
| Parameter | Plot |
|---|---|
| CZT HV Monitor | 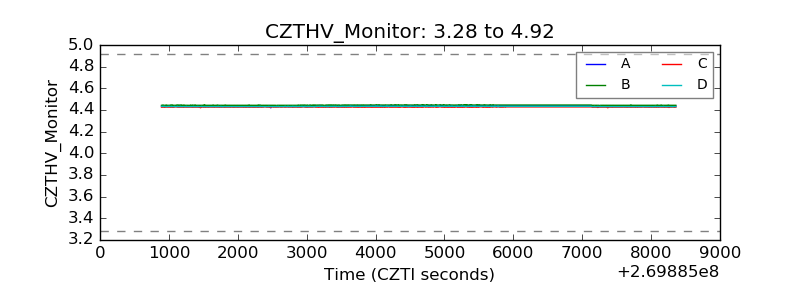 |
| D_VDD |  |
| Temperature 1 | 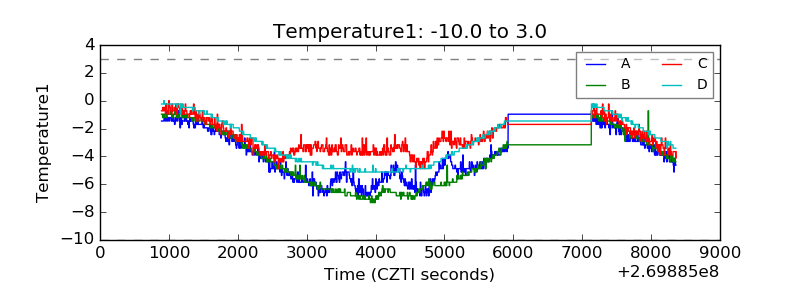 |
| Veto HV Monitor |  |
| Veto LLD | 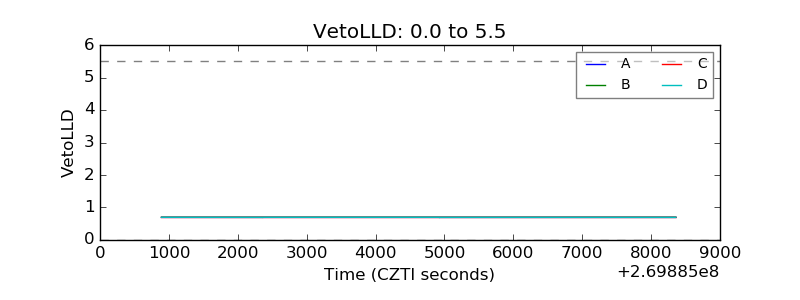 |
| Alpha Counter | 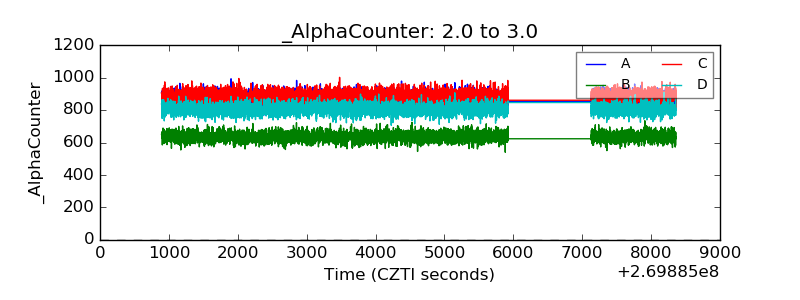 |
| _CPM_Rate | 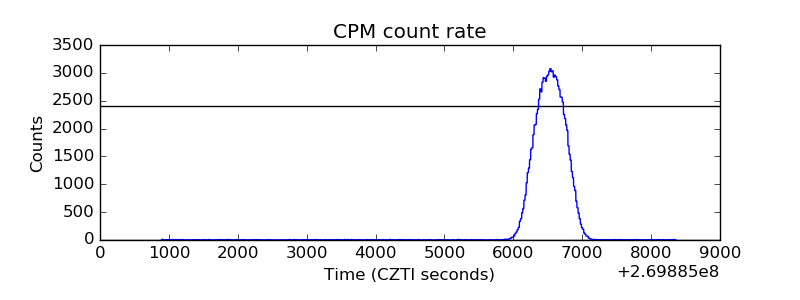 |
| CZT Counter |  |
| +2.5 Volts monitor |  |
| +5 Volts monitor |  |
| _ROLL_ROT | 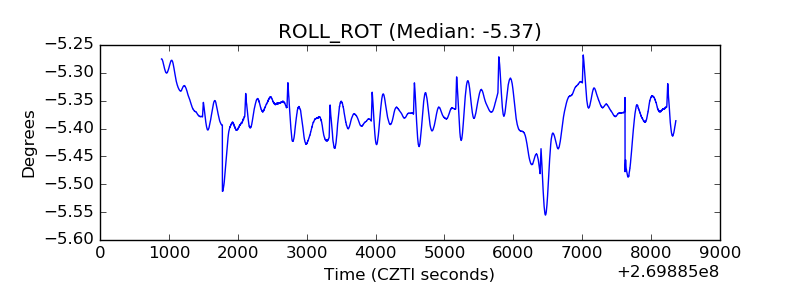 |
| _Roll_DEC | 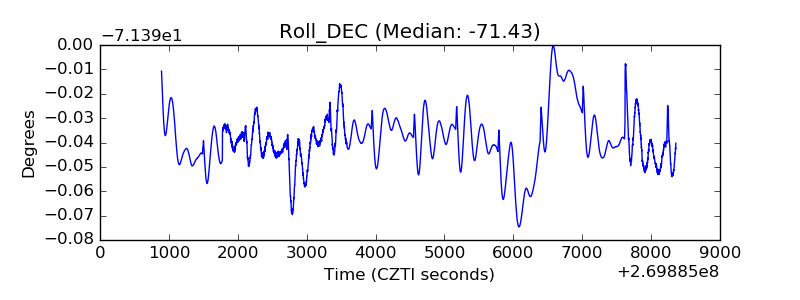 |
| _Roll_RA |  |
| Veto Counter | 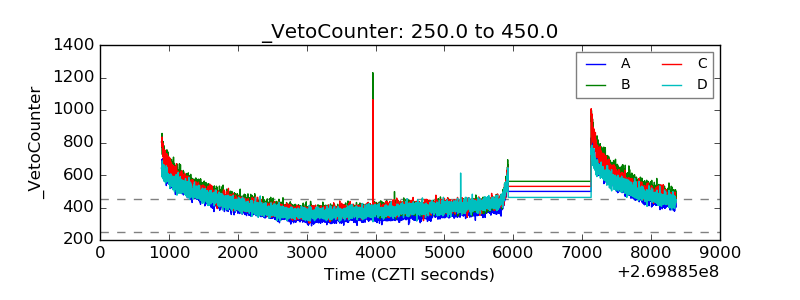 |