| Param | Original file | Final file |
|---|---|---|
| Filename | modeM0/AS1T02_071T01_9000002246_15211cztM0_level2.evt | modeM0/AS1T02_071T01_9000002246_15211cztM0_level2_quad_clean.evt |
| Size (bytes) | 503,896,320 | 131,976,000 |
| Size | 480.6 MB | 125.9 MB |
| Events in quadrant A | 3,287,078 | 903,138 |
| Events in quadrant B | 3,841,257 | 915,144 |
| Events in quadrant C | 4,583,792 | 887,878 |
| Events in quadrant D | 3,125,489 | 855,765 |
| Mode SS | |||
|---|---|---|---|
| Quadrant | BADHDUFLAG | Total packets | Discarded packets |
| A | 0 | 126 | 0 |
| B | 0 | 126 | 0 |
| C | 0 | 126 | 0 |
| D | 0 | 126 | 0 |
| Mode M9 | |||
|---|---|---|---|
| Quadrant | BADHDUFLAG | Total packets | Discarded packets |
| A | 0 | 13 | 0 |
| B | 0 | 13 | 0 |
| C | 0 | 13 | 0 |
| D | 0 | 14 | 0 |
| Mode M0 | |||
|---|---|---|---|
| Quadrant | BADHDUFLAG | Total packets | Discarded packets |
| A | 0 | 13846 | 3 |
| B | 0 | 15524 | 2 |
| C | 0 | 17991 | 2 |
| D | 0 | 13491 | 2 |
| Quadrant | Total seconds | Saturated seconds | Saturation percentage |
|---|---|---|---|
| A | 6243 | 59 | 0.945058% |
| B | 6243 | 156 | 2.498799% |
| C | 6243 | 108 | 1.729938% |
| D | 6243 | 50 | 0.800897% |
Noise dominated data is calculated using 1-second bins in cleaned event files. If a bin has >2000 counts, and if more than 50% of those come from <1% of pixels, then it is considered to be noise-dominated and hence unusable.
| Quadrant | # 1 sec bins | Bins with >0 counts | Bins with >2000 counts | High rate bins dominated by noise | Noise dominated (total time) | Noise dominated (detector-on time) | Marked lightcurve |
|---|---|---|---|---|---|---|---|
| A | 7539 | 6244 | 2 | 2 | 0.03% | 0.03% | 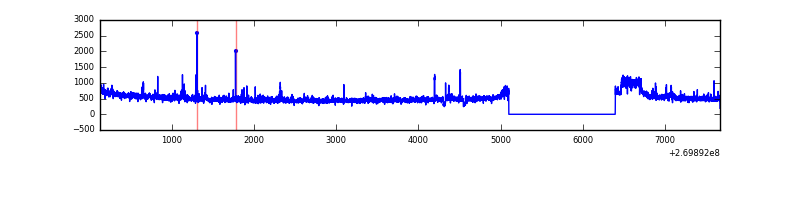 |
| B | 7539 | 6244 | 58 | 58 | 0.77% | 0.93% | 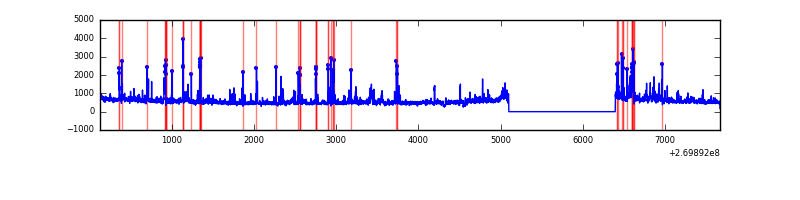 |
| C | 7539 | 6245 | 22 | 22 | 0.29% | 0.35% | 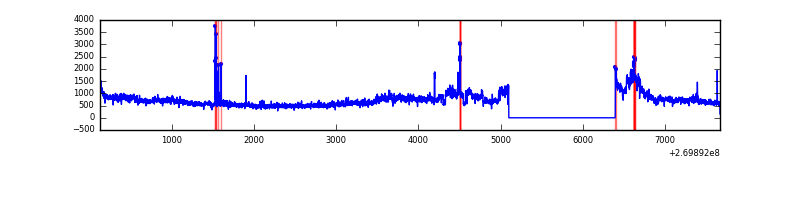 |
| D | 7539 | 6245 | 18 | 18 | 0.24% | 0.29% | 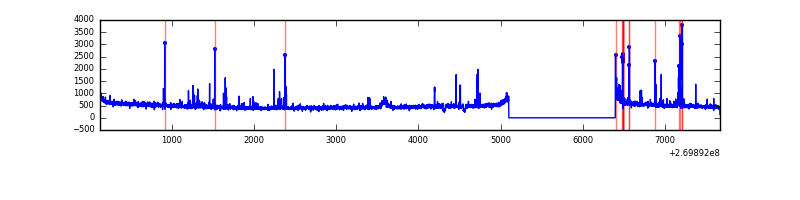 |
Top three noisy pixels from each quadrant. If the there are fewer than three noisy pixels in the level2.evt file, extra rows are filled as -1
| Pixel properties | Quadrant properties | ||||||
|---|---|---|---|---|---|---|---|
| Quadrant | DetID | PixID | Counts | Sigma | Mean | Median | Sigma |
| A | 12 | 189 | 114819 | 717.53 | 792 | 778 | 158.9 |
| A | 0 | 253 | 105407 | 658.31 | 792 | 778 | 158.9 |
| A | 11 | 29 | 13871 | 82.38 | 792 | 778 | 158.9 |
| B | 3 | 112 | 314525 | 2168.98 | 793 | 777 | 144.7 |
| B | 3 | 64 | 143533 | 986.89 | 793 | 777 | 144.7 |
| B | 0 | 245 | 70847 | 484.4 | 793 | 777 | 144.7 |
| C | 3 | 233 | 1567403 | 9171.07 | 760 | 764 | 170.8 |
| C | 4 | 254 | 45137 | 259.76 | 760 | 764 | 170.8 |
| C | 13 | 61 | 5549 | 28.01 | 760 | 764 | 170.8 |
| D | 7 | 38 | 93154 | 505.25 | 760 | 738 | 182.9 |
| D | 2 | 33 | 28622 | 152.45 | 760 | 738 | 182.9 |
| D | 2 | 234 | 23025 | 121.85 | 760 | 738 | 182.9 |
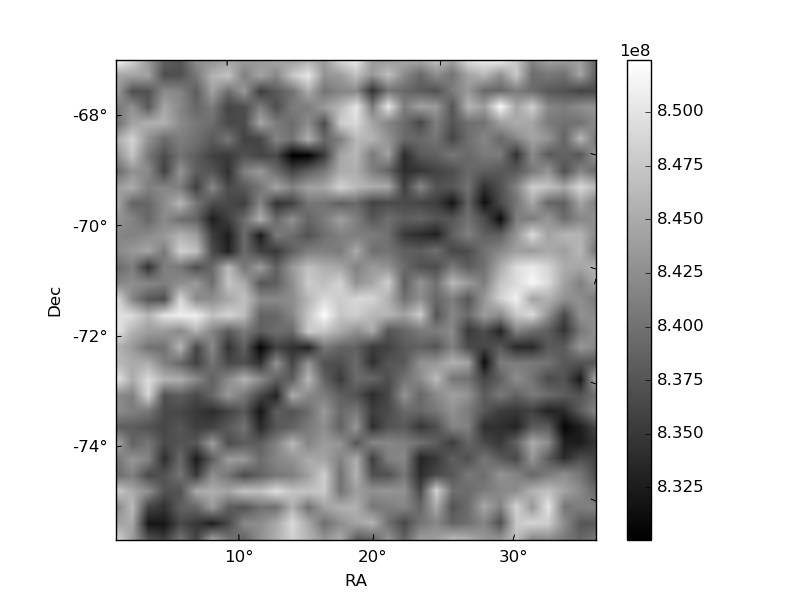
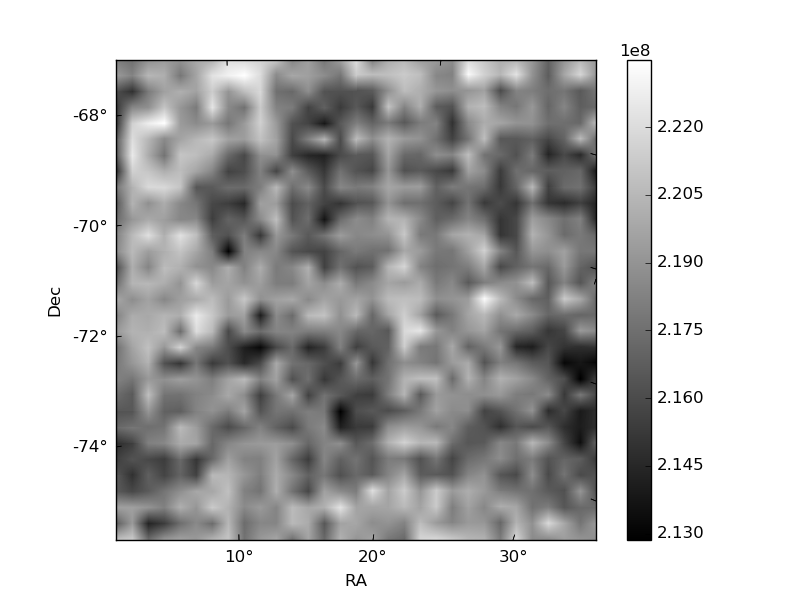
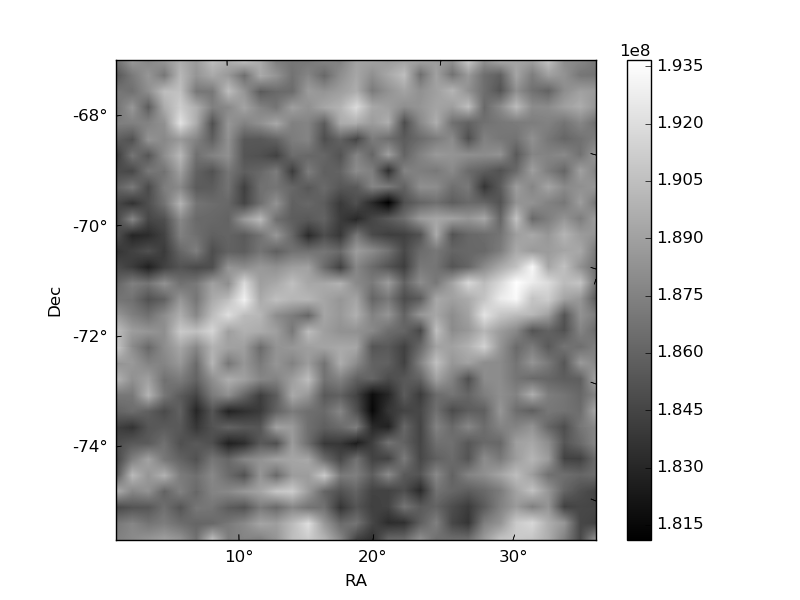
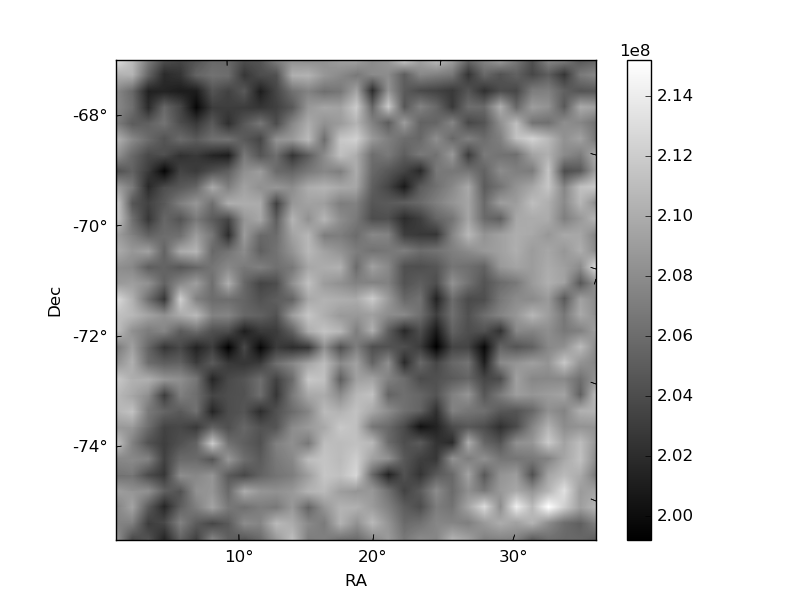
Histogram calculated using DETX and DETY for each event in the final _common_clean file
| Quadrant A | 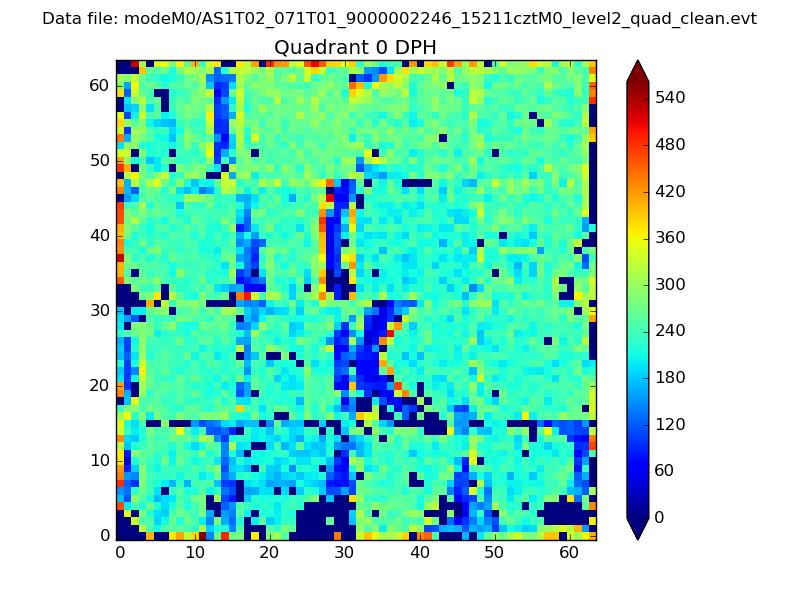 |
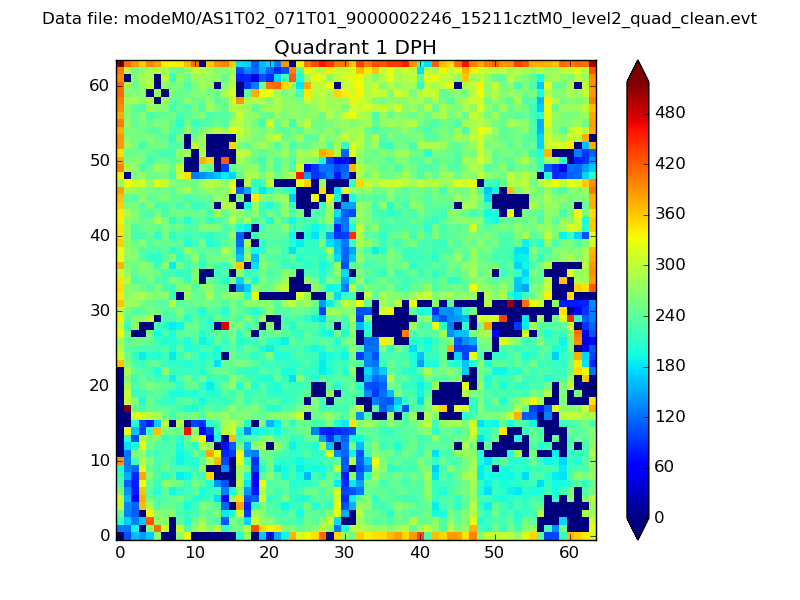 |
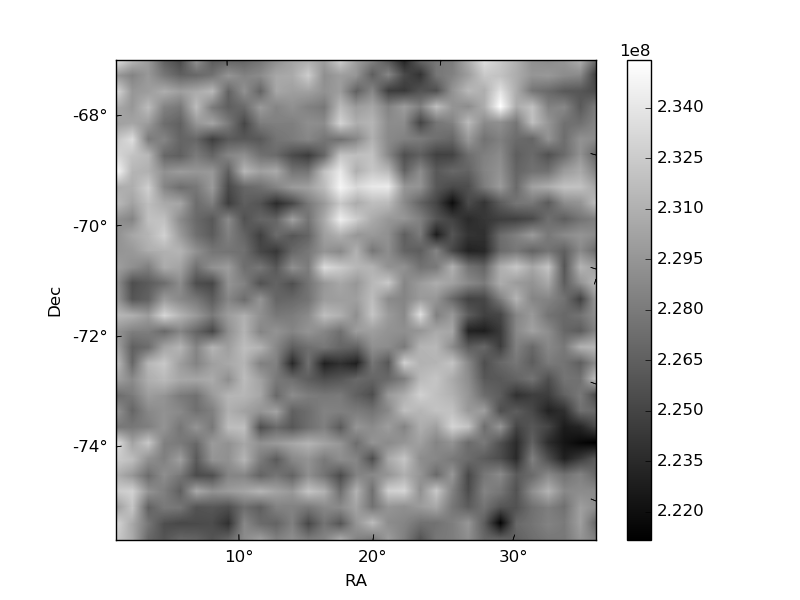
Quadrant B |
|---|---|---|---|
| Quadrant D | 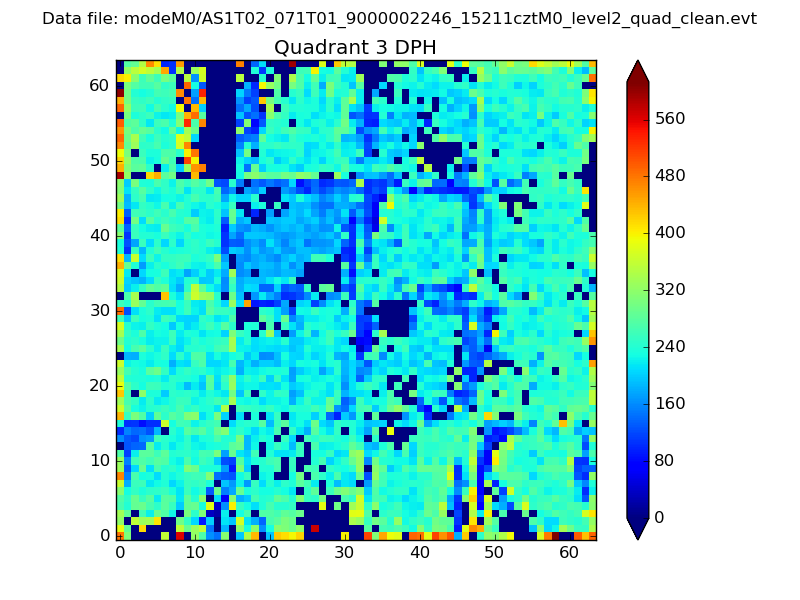 |
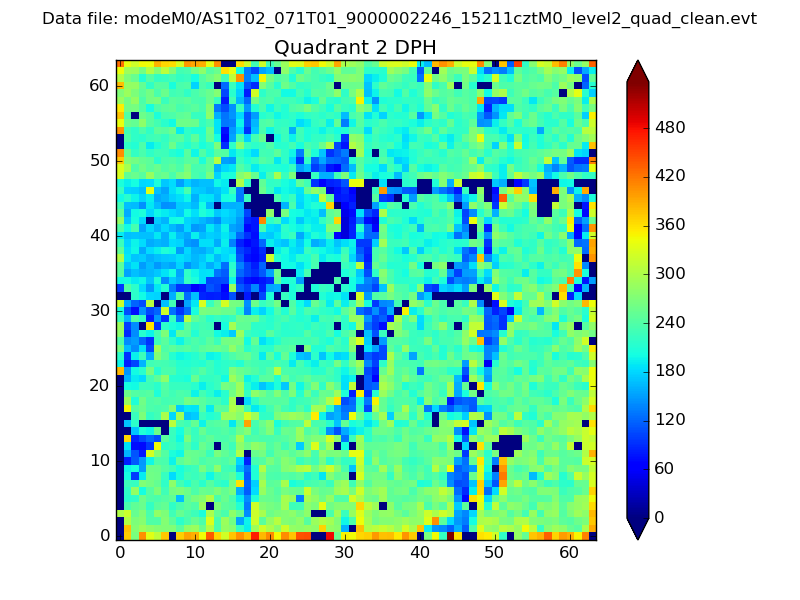 |
Quadrant C |
| Plot type | Count rate plots | Images |
|---|---|---|
| Comparison with Poisson distribution Blue bars denote a histogram of data divided into 1 sec bins. Red curve is a Poisson curve with rate = median count rate of data. |
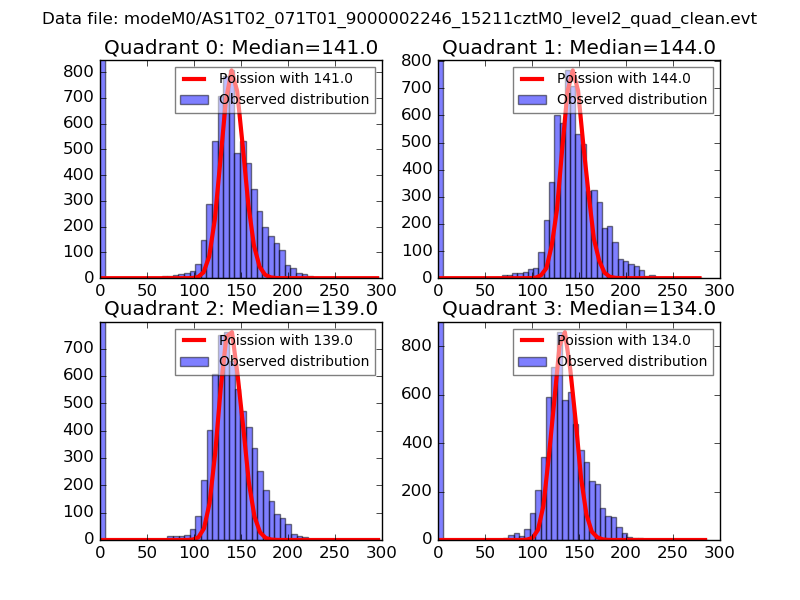 |
 |
| Quadrant-wise count rates Data is divided into 100 sec bins |
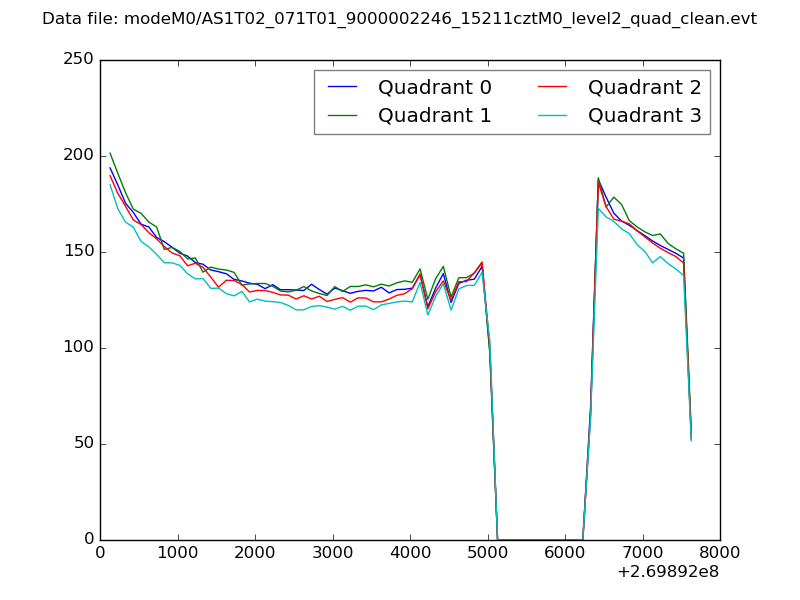 |
|
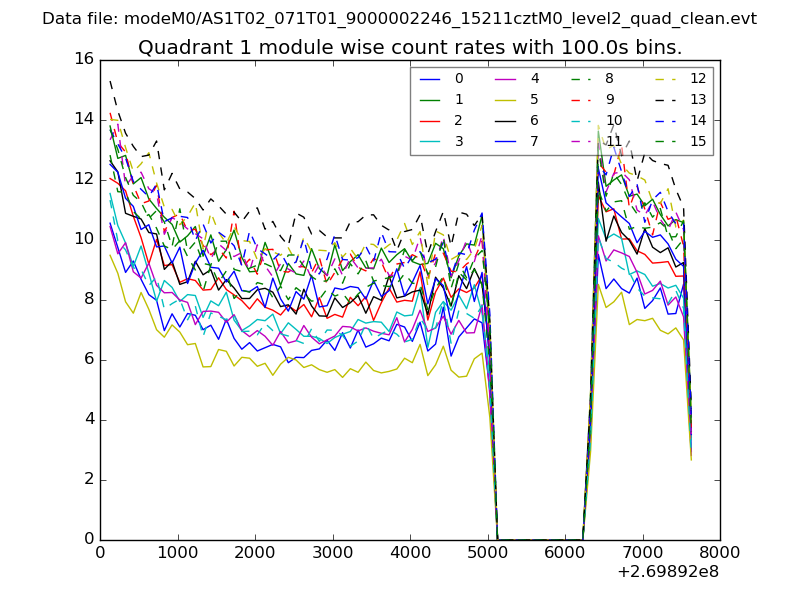
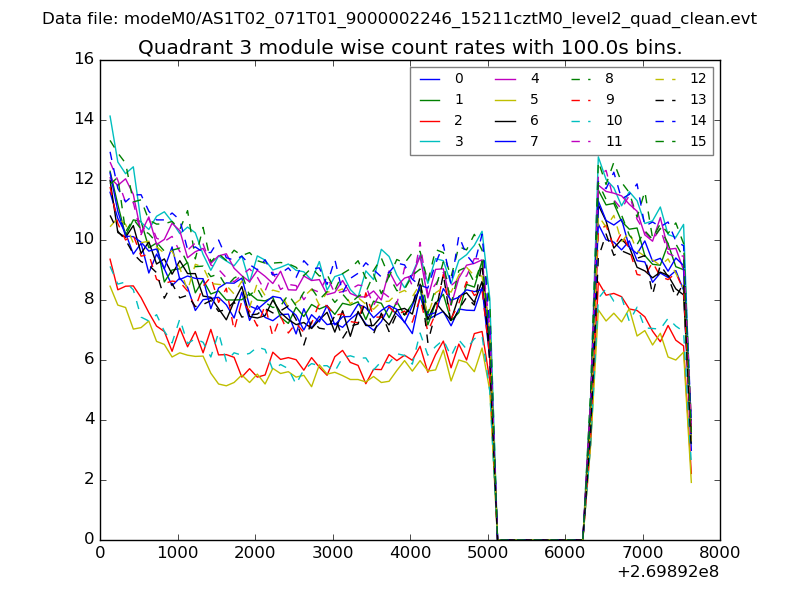
| Module-wise count rates for Quadrant A Data is divided into 100 sec bins |
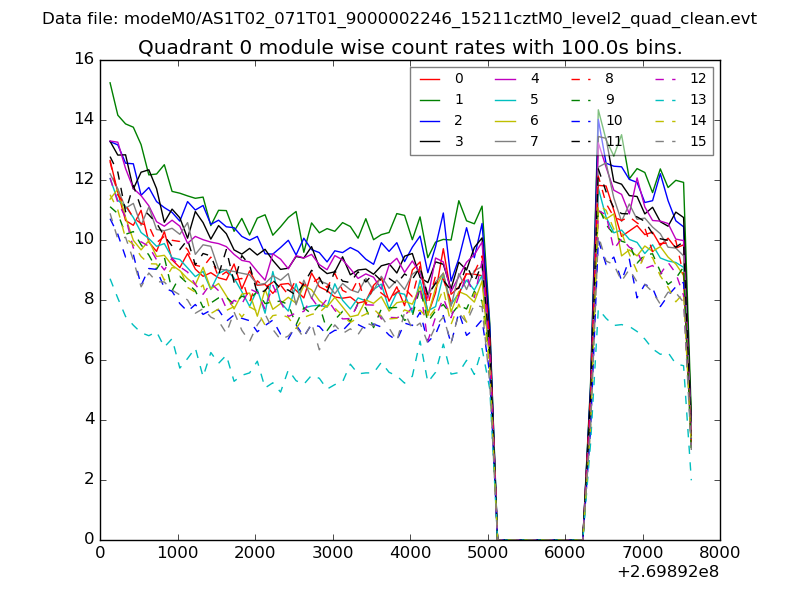 |
 |
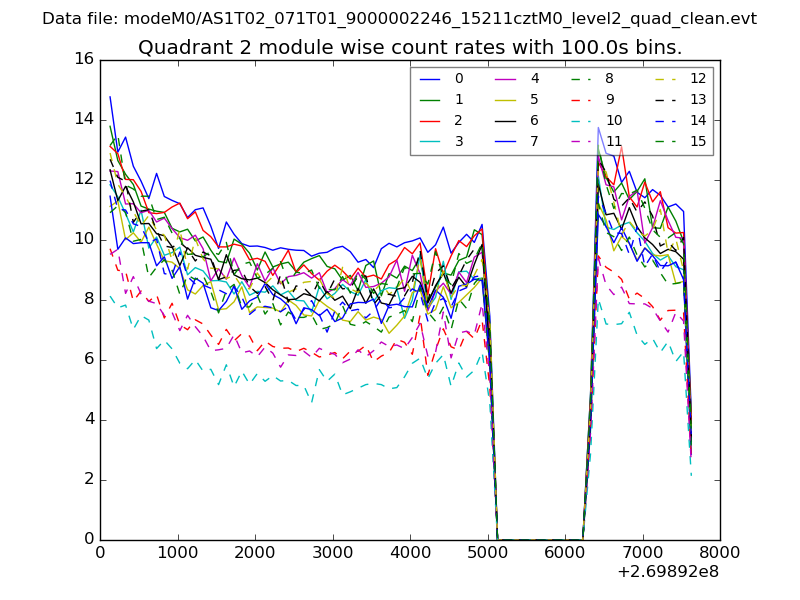
| Module-wise count rates for Quadrant B Data is divided into 100 sec bins |
 |
 |
| Module-wise count rates for Quadrant C Data is divided into 100 sec bins |
 |
 |
| Module-wise count rates for Quadrant D Data is divided into 100 sec bins |
 |
 |
| Parameter | Plot |
|---|---|
| CZT HV Monitor | 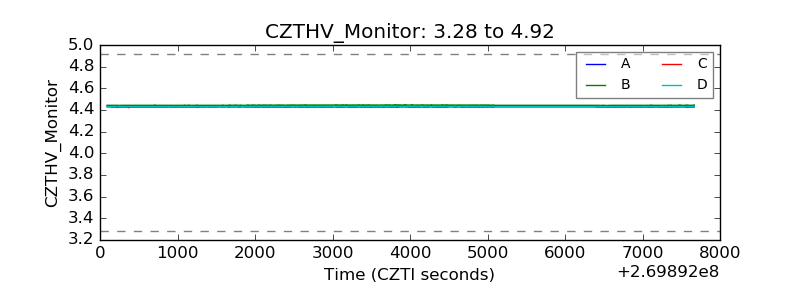 |
| D_VDD | 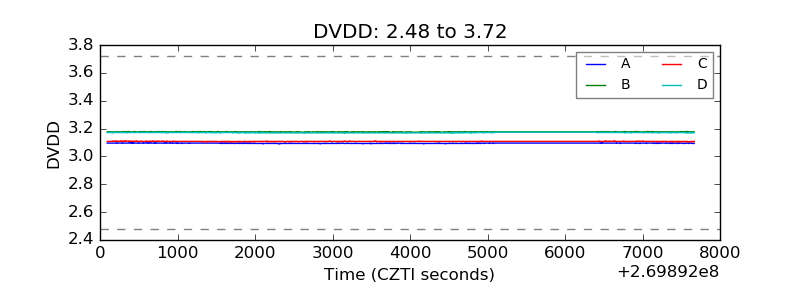 |
| Temperature 1 | 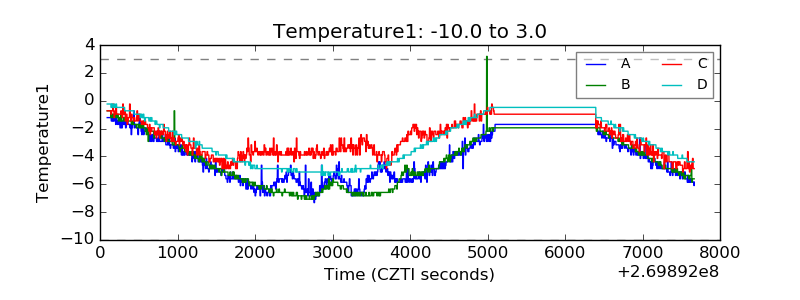 |
| Veto HV Monitor | 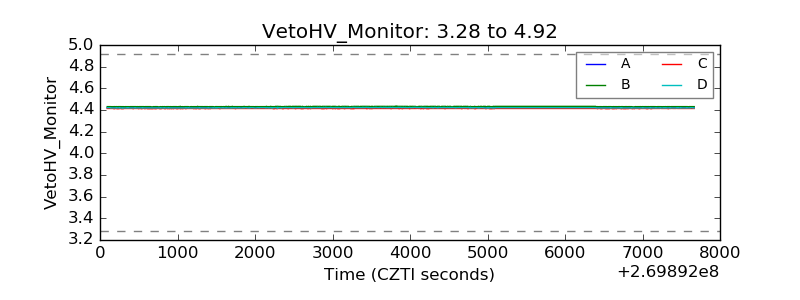 |
| Veto LLD | 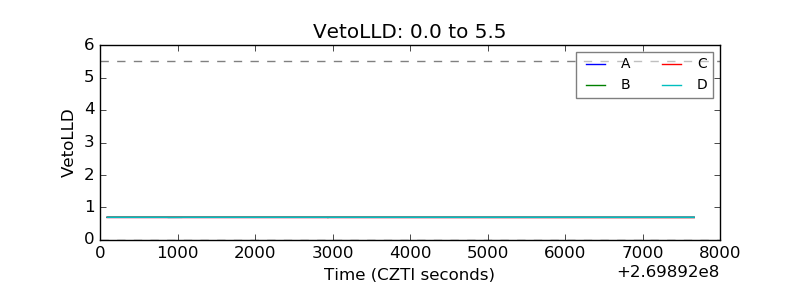 |
| Alpha Counter | 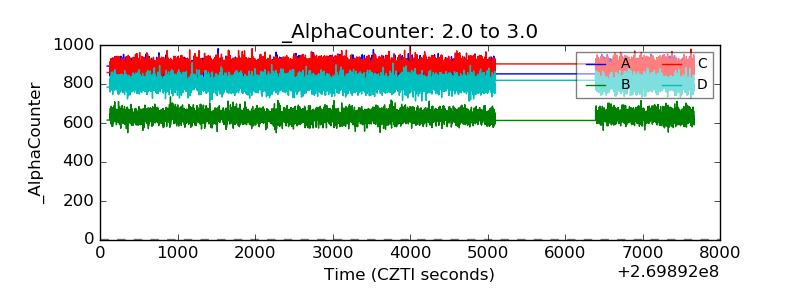 |
| _CPM_Rate | 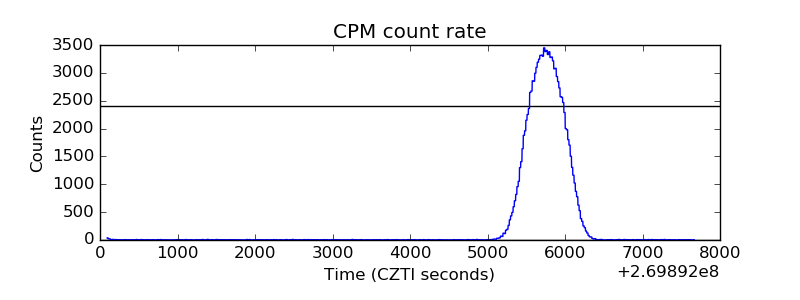 |
| CZT Counter | 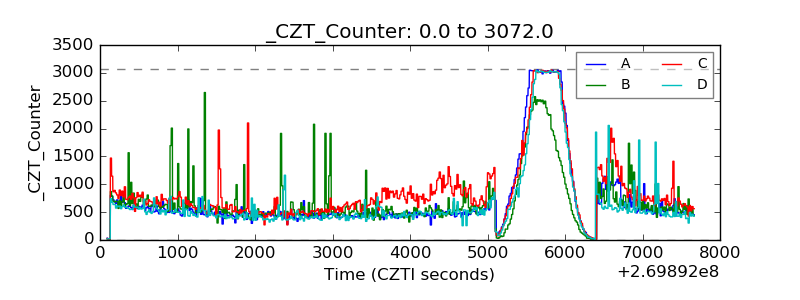 |
| +2.5 Volts monitor | 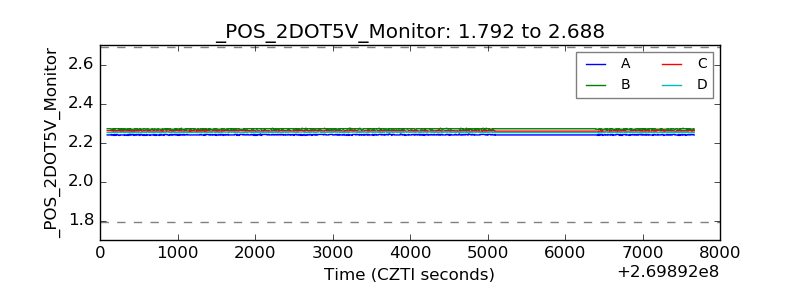 |
| +5 Volts monitor |  |
| _ROLL_ROT | 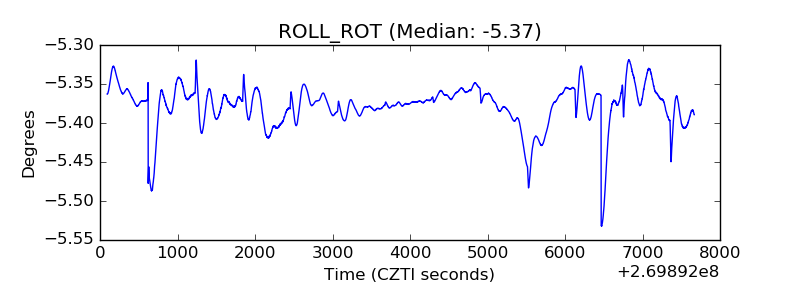 |
| _Roll_DEC | 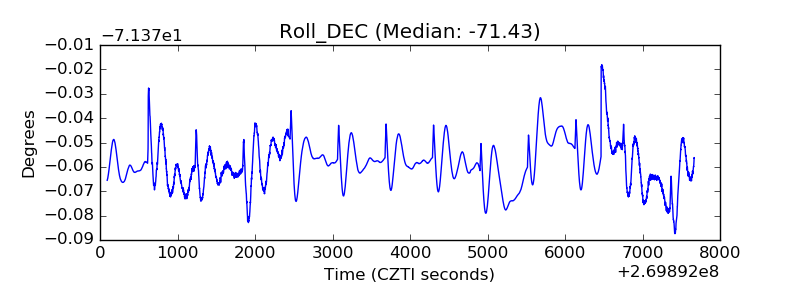 |
| _Roll_RA | 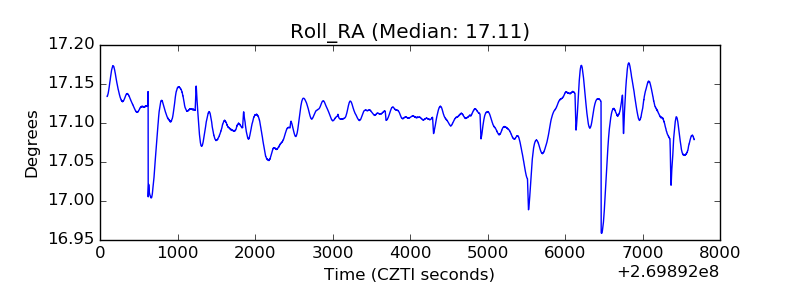 |
| Veto Counter | 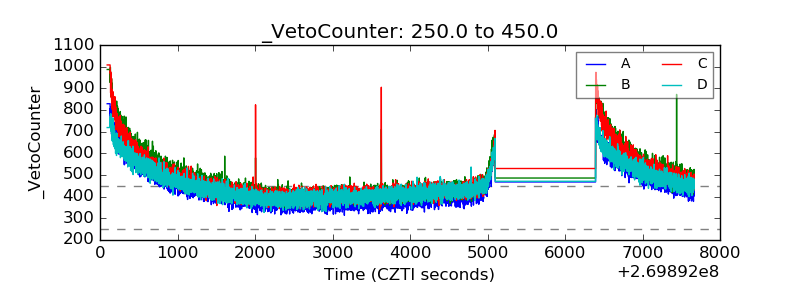 |