| Param | Original file | Final file |
|---|---|---|
| Filename | modeM0/AS1T02_071T01_9000002246_15212cztM0_level2.evt | modeM0/AS1T02_071T01_9000002246_15212cztM0_level2_quad_clean.evt |
| Size (bytes) | 533,877,120 | 131,598,720 |
| Size | 509.1 MB | 125.5 MB |
| Events in quadrant A | 3,277,286 | 905,192 |
| Events in quadrant B | 4,169,896 | 904,904 |
| Events in quadrant C | 5,193,050 | 883,295 |
| Events in quadrant D | 3,107,338 | 858,826 |
| Mode SS | |||
|---|---|---|---|
| Quadrant | BADHDUFLAG | Total packets | Discarded packets |
| A | 0 | 124 | 0 |
| B | 0 | 124 | 0 |
| C | 0 | 124 | 0 |
| D | 0 | 124 | 0 |
| Mode M9 | |||
|---|---|---|---|
| Quadrant | BADHDUFLAG | Total packets | Discarded packets |
| A | 0 | 24 | 0 |
| B | 0 | 24 | 0 |
| C | 0 | 24 | 0 |
| D | 0 | 25 | 0 |
| Mode M0 | |||
|---|---|---|---|
| Quadrant | BADHDUFLAG | Total packets | Discarded packets |
| A | 0 | 13757 | 3 |
| B | 0 | 16474 | 2 |
| C | 0 | 19960 | 2 |
| D | 0 | 13408 | 2 |
| Quadrant | Total seconds | Saturated seconds | Saturation percentage |
|---|---|---|---|
| A | 6221 | 36 | 0.578685% |
| B | 6221 | 313 | 5.031345% |
| C | 6221 | 199 | 3.198843% |
| D | 6221 | 38 | 0.610834% |
Noise dominated data is calculated using 1-second bins in cleaned event files. If a bin has >2000 counts, and if more than 50% of those come from <1% of pixels, then it is considered to be noise-dominated and hence unusable.
| Quadrant | # 1 sec bins | Bins with >0 counts | Bins with >2000 counts | High rate bins dominated by noise | Noise dominated (total time) | Noise dominated (detector-on time) | Marked lightcurve |
|---|---|---|---|---|---|---|---|
| A | 7597 | 6223 | 1 | 1 | 0.01% | 0.02% | 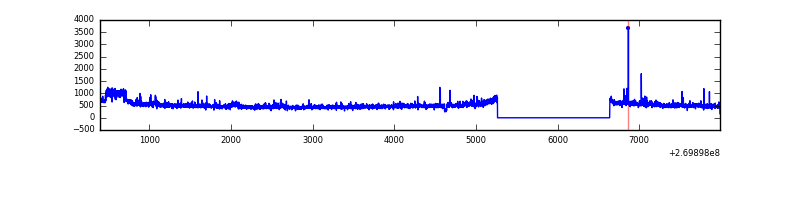 |
| B | 7597 | 6223 | 187 | 187 | 2.46% | 3.00% | 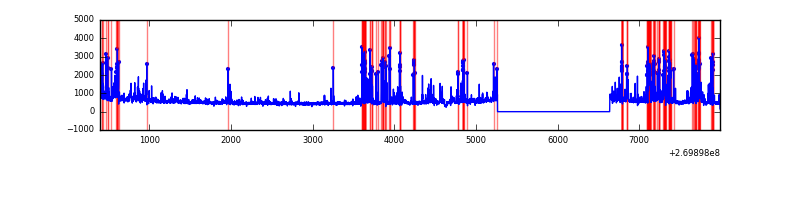 |
| C | 7597 | 6223 | 125 | 125 | 1.65% | 2.01% | 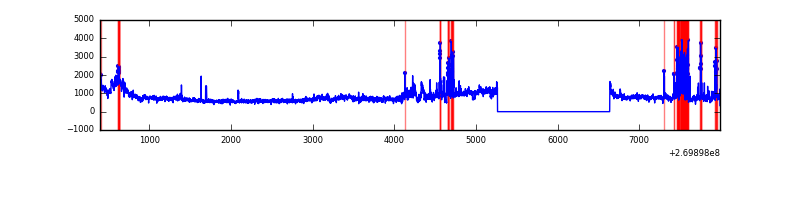 |
| D | 7597 | 6223 | 31 | 31 | 0.41% | 0.50% | 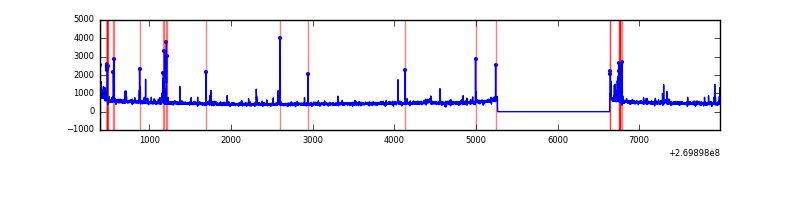 |
Top three noisy pixels from each quadrant. If the there are fewer than three noisy pixels in the level2.evt file, extra rows are filled as -1
| Pixel properties | Quadrant properties | ||||||
|---|---|---|---|---|---|---|---|
| Quadrant | DetID | PixID | Counts | Sigma | Mean | Median | Sigma |
| A | 0 | 253 | 119037 | 762.57 | 784 | 771 | 155.1 |
| A | 12 | 189 | 108189 | 692.62 | 784 | 771 | 155.1 |
| A | 15 | 239 | 20235 | 125.5 | 784 | 771 | 155.1 |
| B | 3 | 112 | 789103 | 5544.73 | 777 | 760 | 142.2 |
| B | 3 | 64 | 129608 | 906.24 | 777 | 760 | 142.2 |
| B | 10 | 245 | 80028 | 557.52 | 777 | 760 | 142.2 |
| C | 3 | 233 | 1803773 | 10575.86 | 754 | 760 | 170.5 |
| C | 4 | 254 | 440001 | 2576.44 | 754 | 760 | 170.5 |
| C | 13 | 61 | 5477 | 27.67 | 754 | 760 | 170.5 |
| D | 7 | 38 | 111643 | 610.35 | 755 | 733 | 181.7 |
| D | 2 | 33 | 25165 | 134.45 | 755 | 733 | 181.7 |
| D | 2 | 234 | 23187 | 123.57 | 755 | 733 | 181.7 |
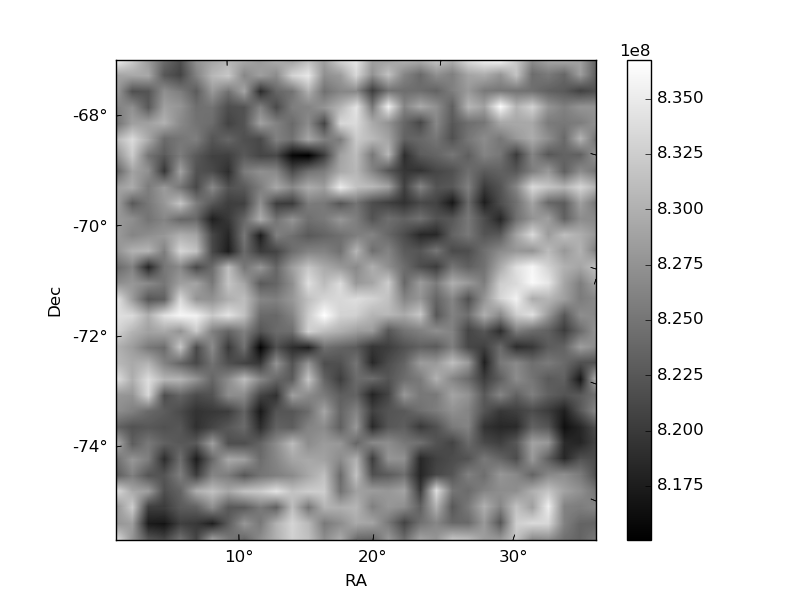
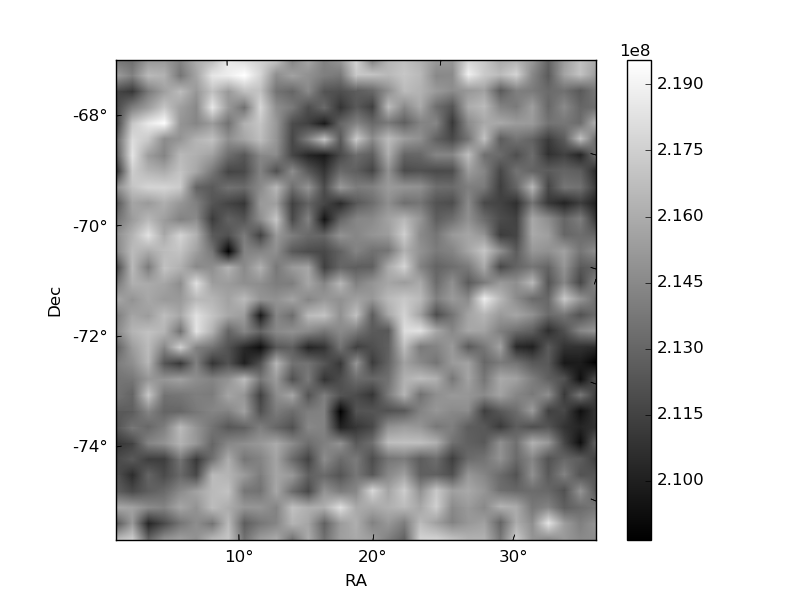
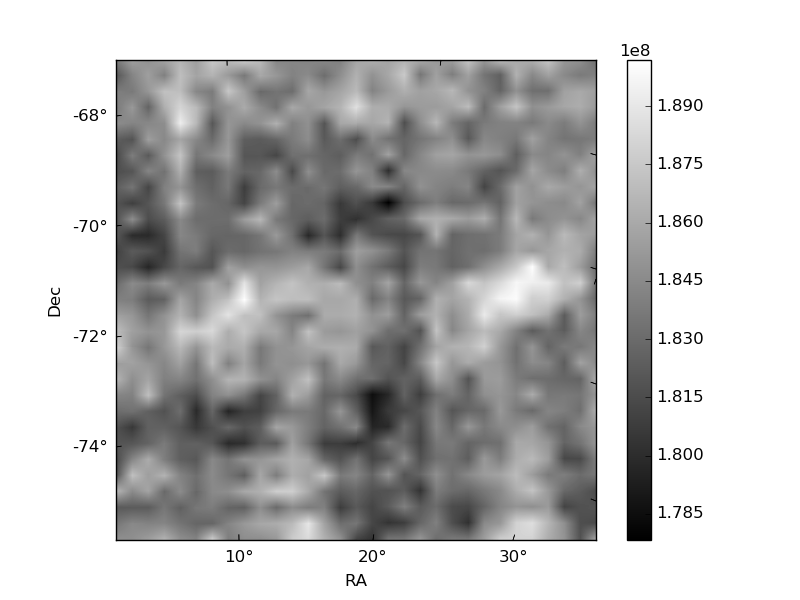
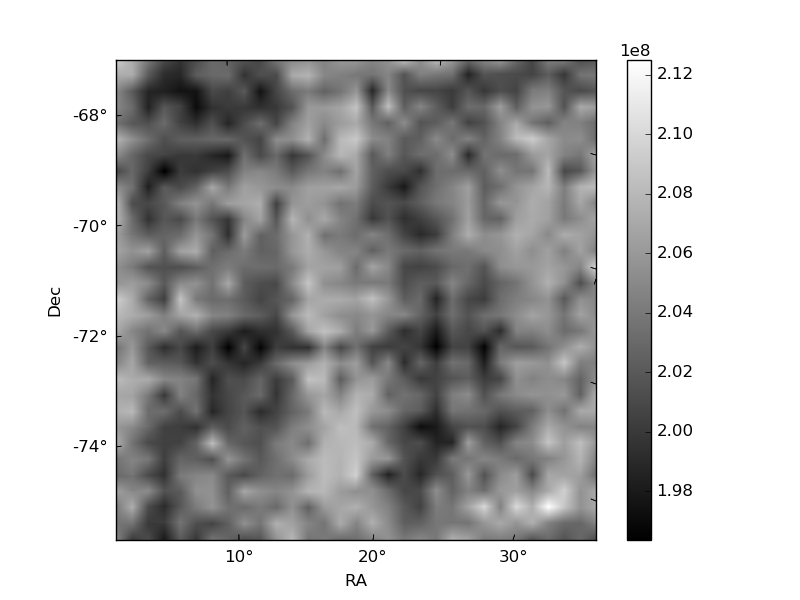
Histogram calculated using DETX and DETY for each event in the final _common_clean file
| Quadrant A | 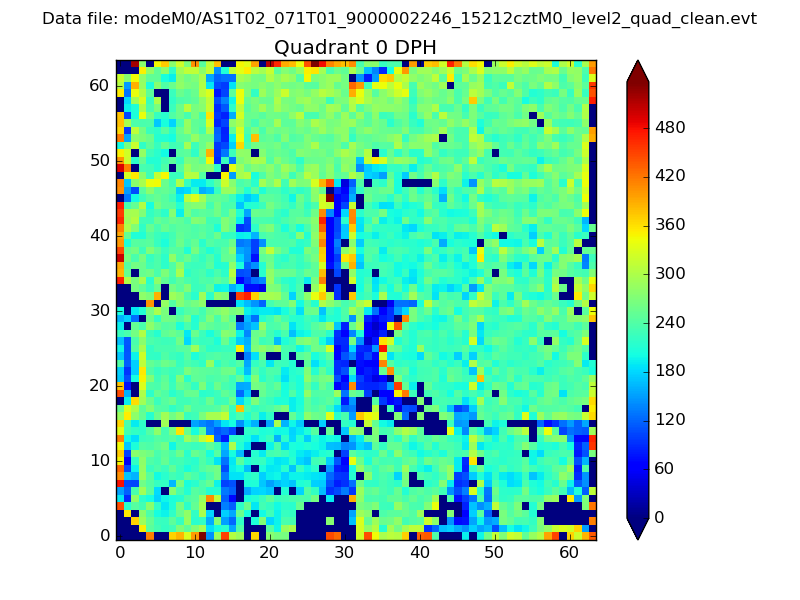 |
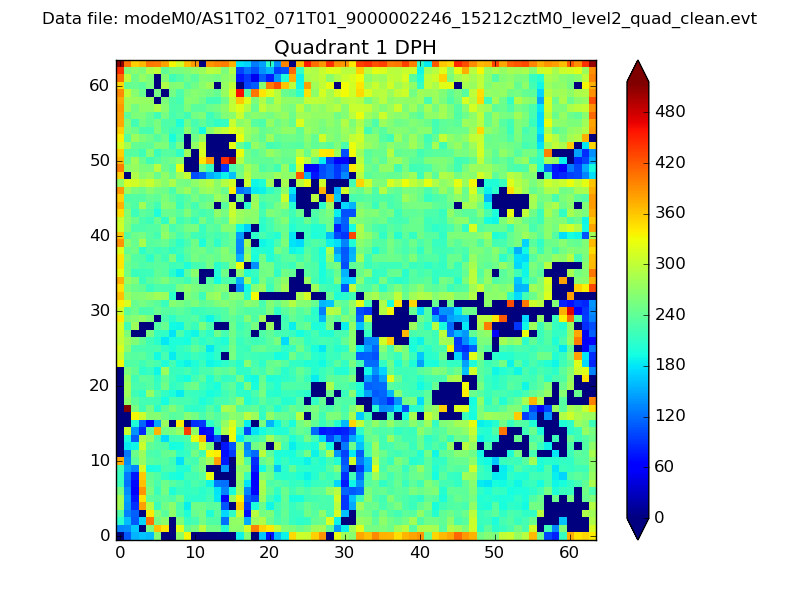 |
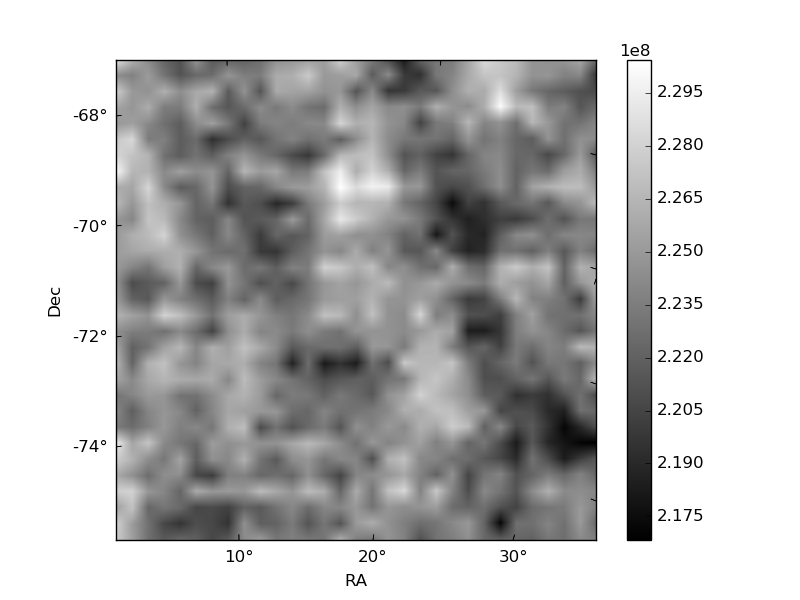
Quadrant B |
|---|---|---|---|
| Quadrant D | 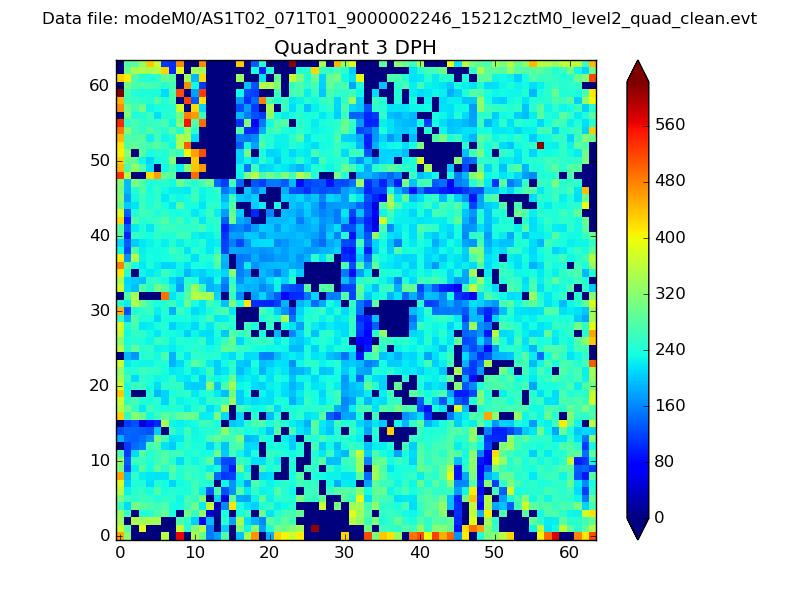 |
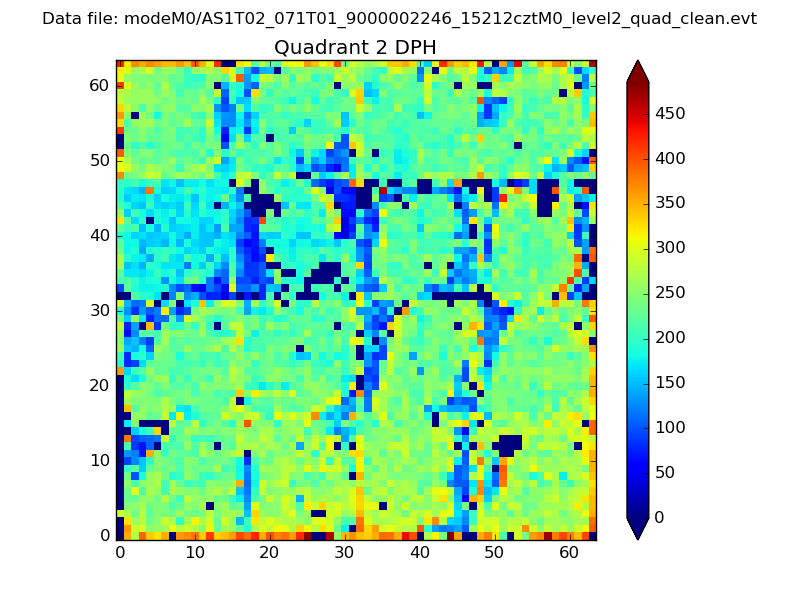 |
Quadrant C |
| Plot type | Count rate plots | Images |
|---|---|---|
| Comparison with Poisson distribution Blue bars denote a histogram of data divided into 1 sec bins. Red curve is a Poisson curve with rate = median count rate of data. |
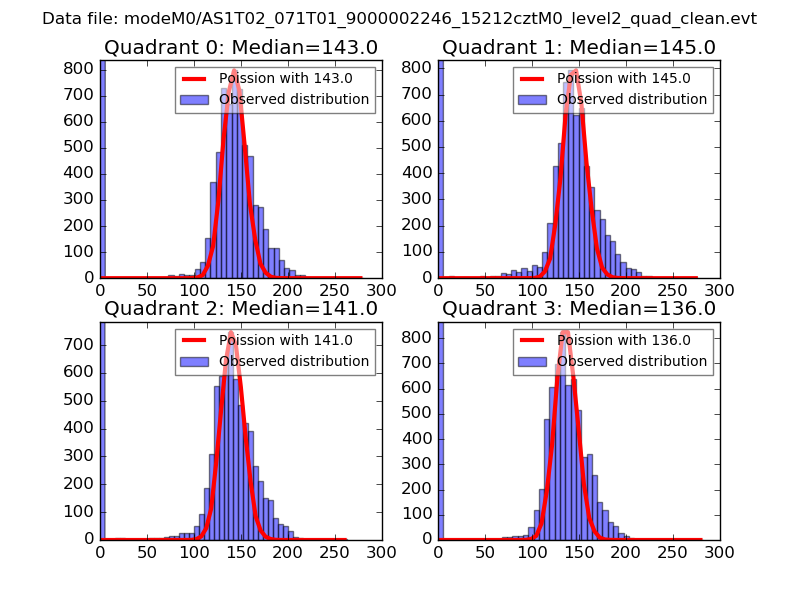 |
 |
| Quadrant-wise count rates Data is divided into 100 sec bins |
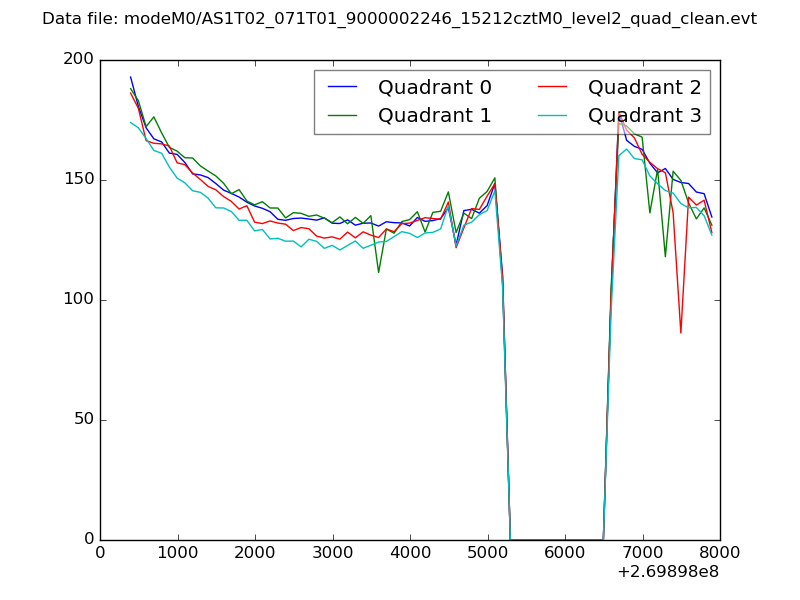 |
|
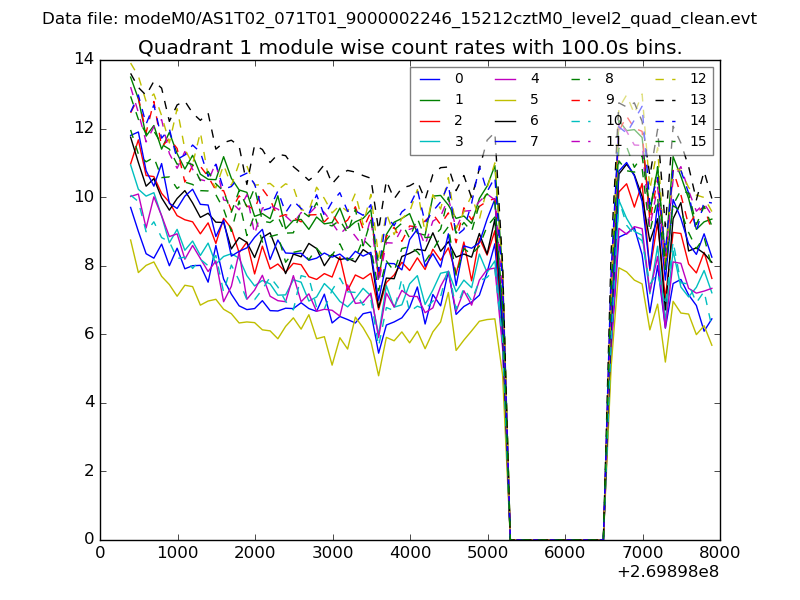
| Module-wise count rates for Quadrant A Data is divided into 100 sec bins |
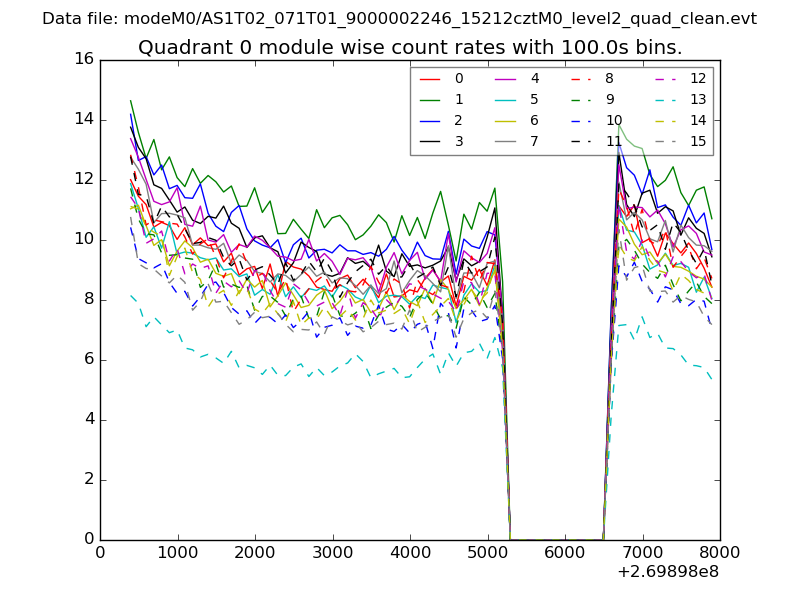 |
 |
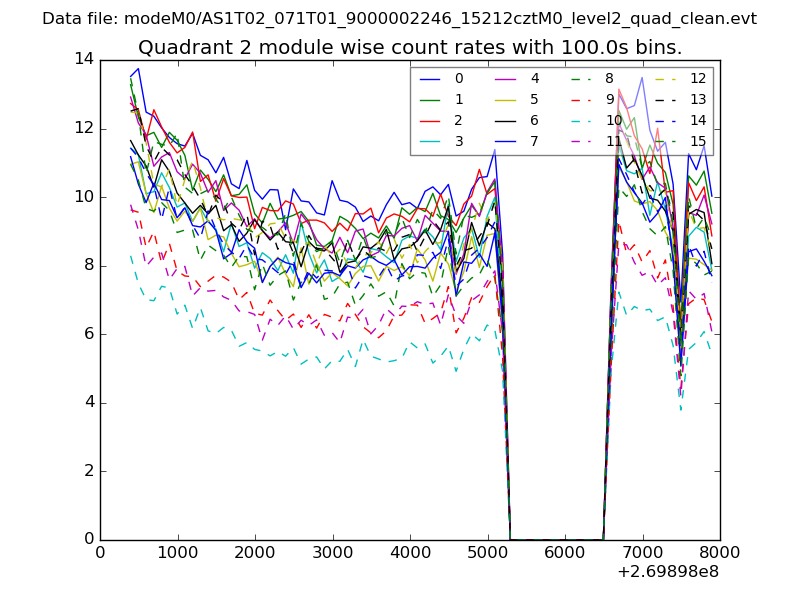
| Module-wise count rates for Quadrant B Data is divided into 100 sec bins |
 |
 |
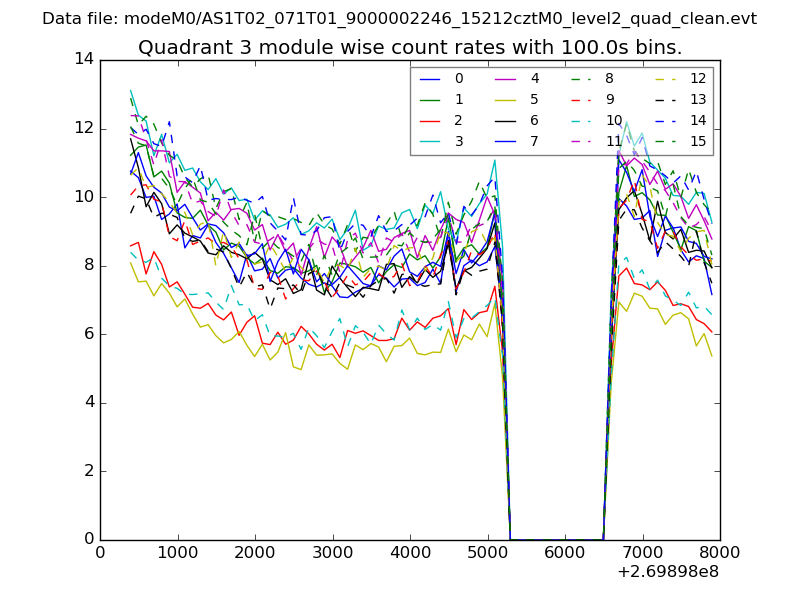
| Module-wise count rates for Quadrant C Data is divided into 100 sec bins |
 |
 |
| Module-wise count rates for Quadrant D Data is divided into 100 sec bins |
 |
 |
| Parameter | Plot |
|---|---|
| CZT HV Monitor | 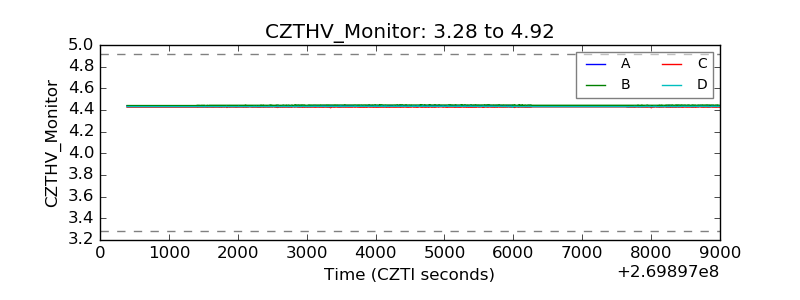 |
| D_VDD | 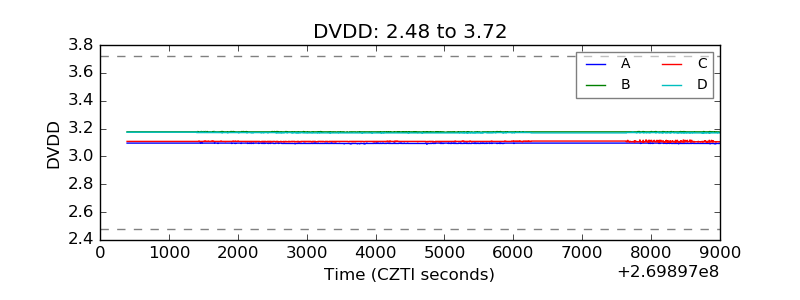 |
| Temperature 1 | 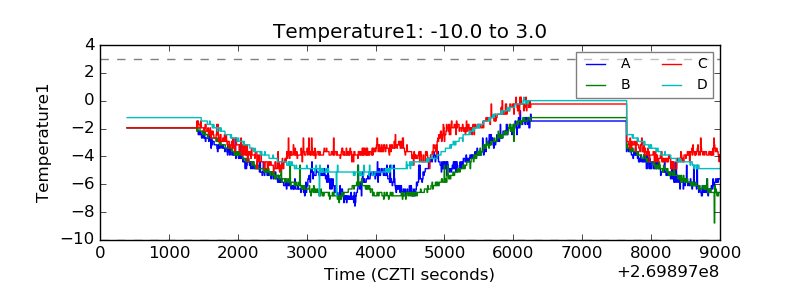 |
| Veto HV Monitor | 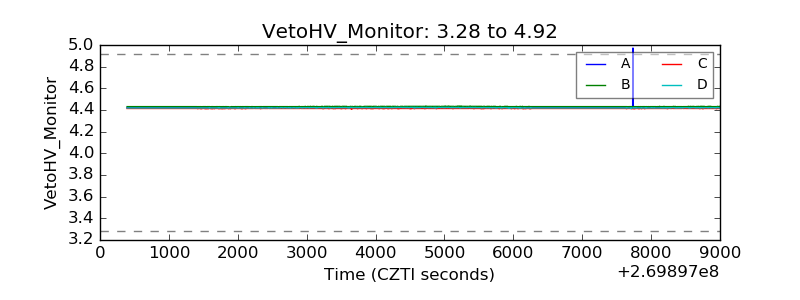 |
| Veto LLD | 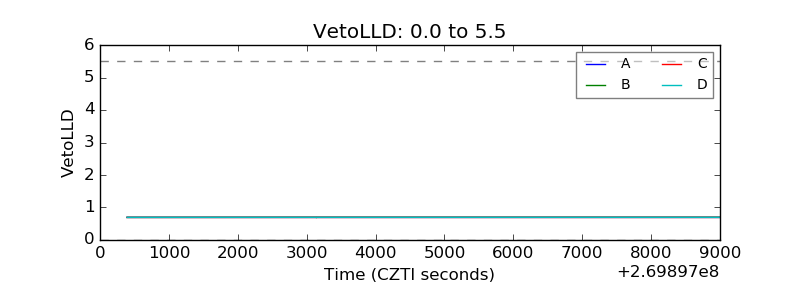 |
| Alpha Counter | 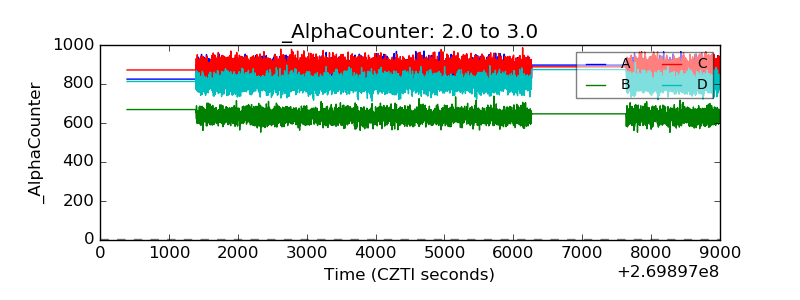 |
| _CPM_Rate | 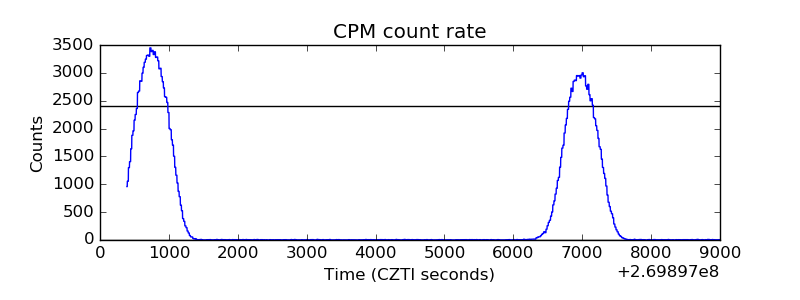 |
| CZT Counter | 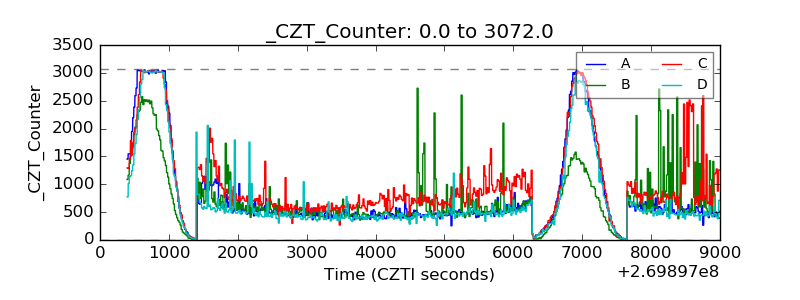 |
| +2.5 Volts monitor |  |
| +5 Volts monitor |  |
| _ROLL_ROT | 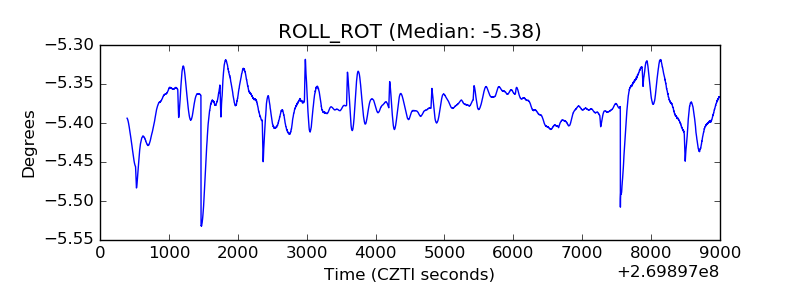 |
| _Roll_DEC | 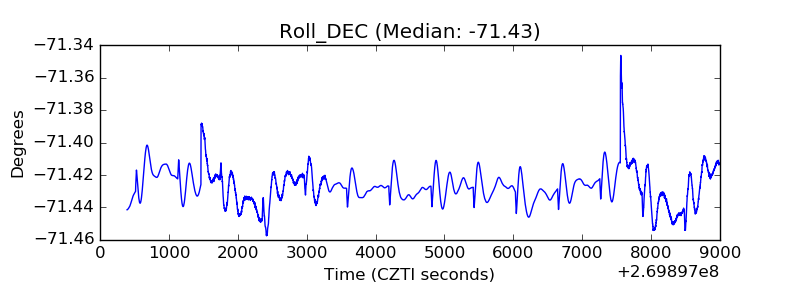 |
| _Roll_RA | 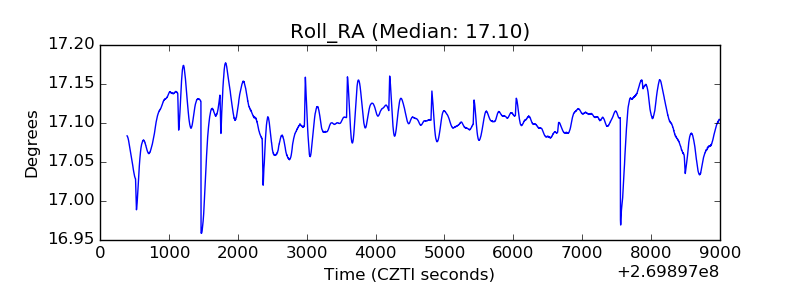 |
| Veto Counter | 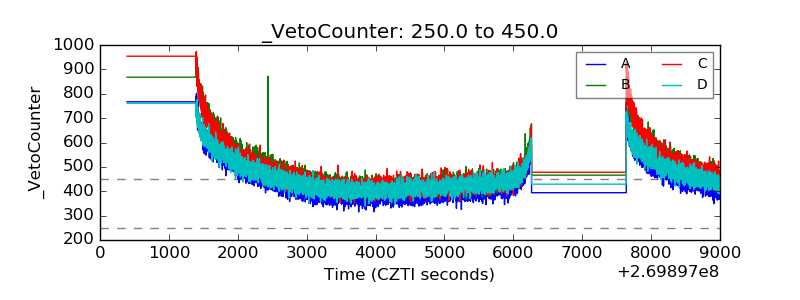 |