| Param | Original file | Final file |
|---|---|---|
| Filename | modeM0/AS1T02_071T01_9000002246_15213cztM0_level2.evt | modeM0/AS1T02_071T01_9000002246_15213cztM0_level2_quad_clean.evt |
| Size (bytes) | 520,453,440 | 125,974,080 |
| Size | 496.3 MB | 120.1 MB |
| Events in quadrant A | 3,302,639 | 858,803 |
| Events in quadrant B | 3,891,674 | 866,176 |
| Events in quadrant C | 4,732,129 | 846,704 |
| Events in quadrant D | 3,422,205 | 817,956 |
| Mode SS | |||
|---|---|---|---|
| Quadrant | BADHDUFLAG | Total packets | Discarded packets |
| A | 0 | 124 | 0 |
| B | 0 | 124 | 0 |
| C | 0 | 124 | 0 |
| D | 0 | 124 | 0 |
| Mode M9 | |||
|---|---|---|---|
| Quadrant | BADHDUFLAG | Total packets | Discarded packets |
| A | 0 | 24 | 0 |
| B | 0 | 24 | 0 |
| C | 0 | 24 | 0 |
| D | 0 | 25 | 0 |
| Mode M0 | |||
|---|---|---|---|
| Quadrant | BADHDUFLAG | Total packets | Discarded packets |
| A | 0 | 13731 | 3 |
| B | 0 | 15450 | 2 |
| C | 0 | 18383 | 2 |
| D | 0 | 14296 | 2 |
| Quadrant | Total seconds | Saturated seconds | Saturation percentage |
|---|---|---|---|
| A | 6100 | 18 | 0.295082% |
| B | 6100 | 235 | 3.852459% |
| C | 6100 | 217 | 3.557377% |
| D | 6100 | 78 | 1.278689% |
Noise dominated data is calculated using 1-second bins in cleaned event files. If a bin has >2000 counts, and if more than 50% of those come from <1% of pixels, then it is considered to be noise-dominated and hence unusable.
| Quadrant | # 1 sec bins | Bins with >0 counts | Bins with >2000 counts | High rate bins dominated by noise | Noise dominated (total time) | Noise dominated (detector-on time) | Marked lightcurve |
|---|---|---|---|---|---|---|---|
| A | 7481 | 6102 | 1 | 1 | 0.01% | 0.02% | 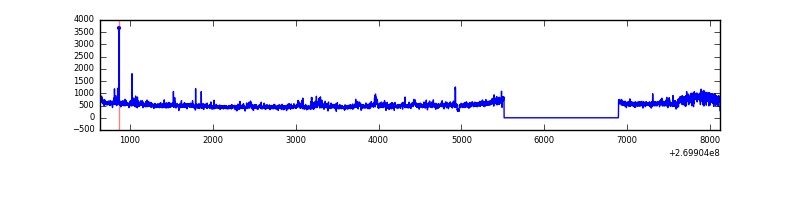 |
| B | 7481 | 6102 | 155 | 155 | 2.07% | 2.54% | 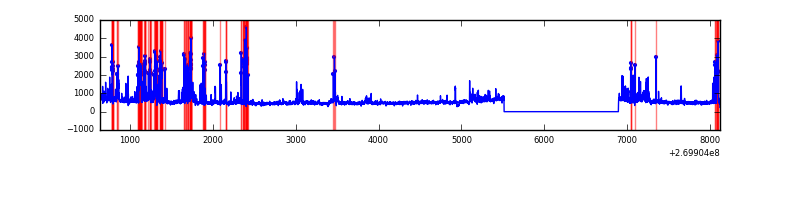 |
| C | 7481 | 6102 | 153 | 153 | 2.05% | 2.51% | 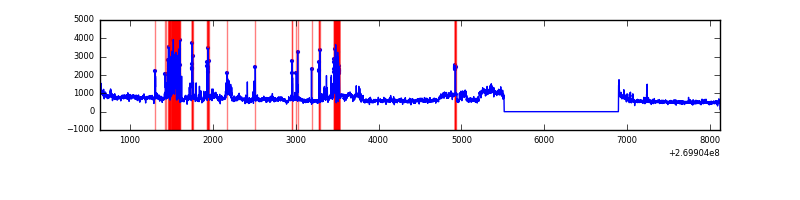 |
| D | 7481 | 6102 | 73 | 73 | 0.98% | 1.20% | 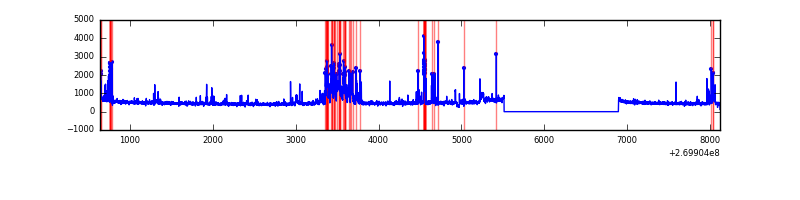 |
Top three noisy pixels from each quadrant. If the there are fewer than three noisy pixels in the level2.evt file, extra rows are filled as -1
| Pixel properties | Quadrant properties | ||||||
|---|---|---|---|---|---|---|---|
| Quadrant | DetID | PixID | Counts | Sigma | Mean | Median | Sigma |
| A | 0 | 253 | 227729 | 1522.67 | 749 | 736 | 149.1 |
| A | 12 | 189 | 178385 | 1191.67 | 749 | 736 | 149.1 |
| A | 9 | 143 | 10168 | 63.27 | 749 | 736 | 149.1 |
| B | 3 | 112 | 705403 | 5137.3 | 748 | 729 | 137.2 |
| B | 3 | 64 | 65494 | 472.16 | 748 | 729 | 137.2 |
| B | 10 | 245 | 58543 | 421.48 | 748 | 729 | 137.2 |
| C | 3 | 233 | 1346105 | 8123.61 | 730 | 736 | 165.6 |
| C | 4 | 254 | 501865 | 3025.92 | 730 | 736 | 165.6 |
| C | 7 | 247 | 14495 | 83.08 | 730 | 736 | 165.6 |
| D | 2 | 33 | 299900 | 1714.13 | 728 | 709 | 174.5 |
| D | 12 | 0 | 168777 | 962.9 | 728 | 709 | 174.5 |
| D | 13 | 172 | 46009 | 259.53 | 728 | 709 | 174.5 |
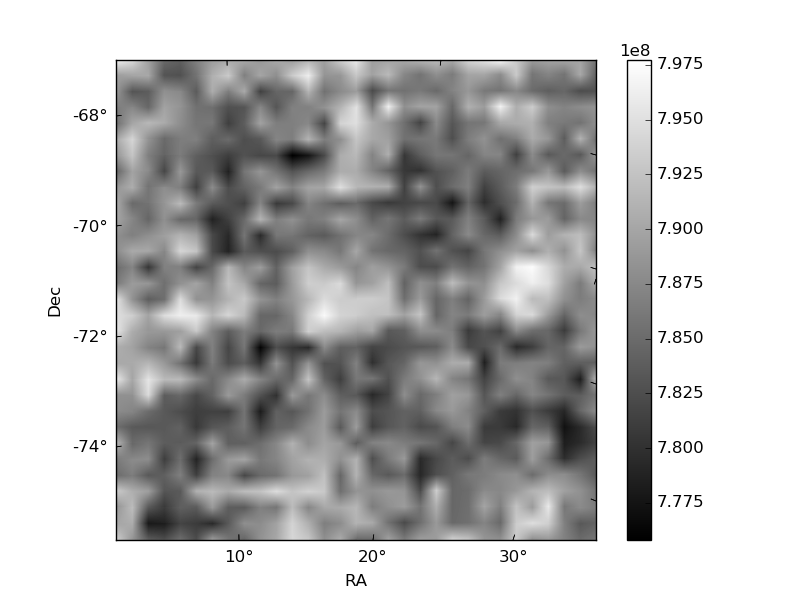
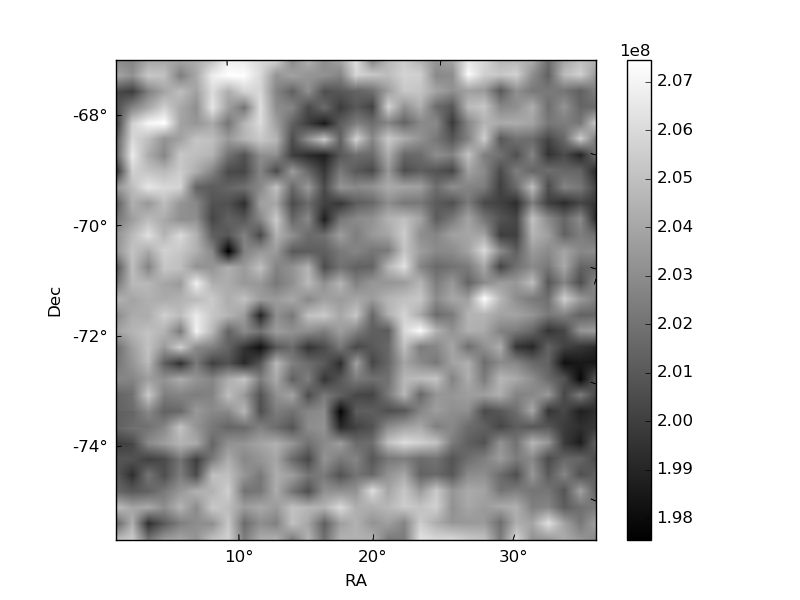
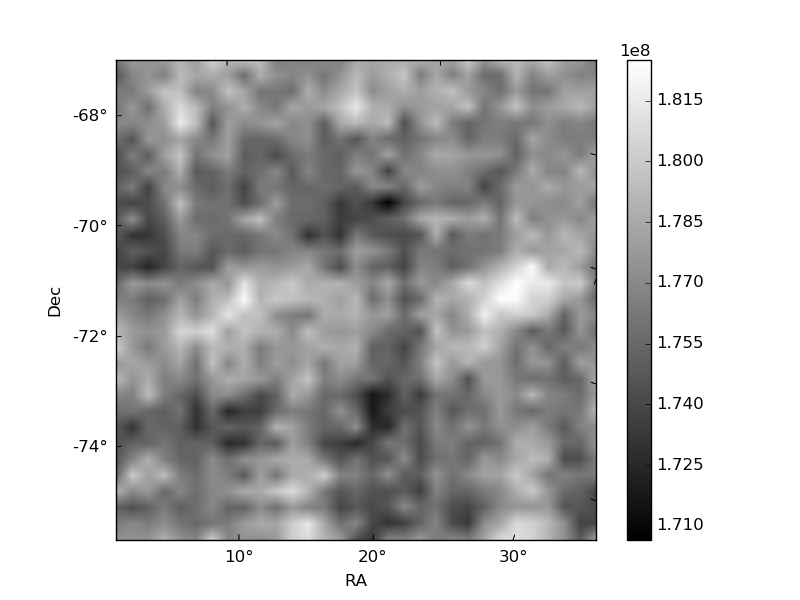
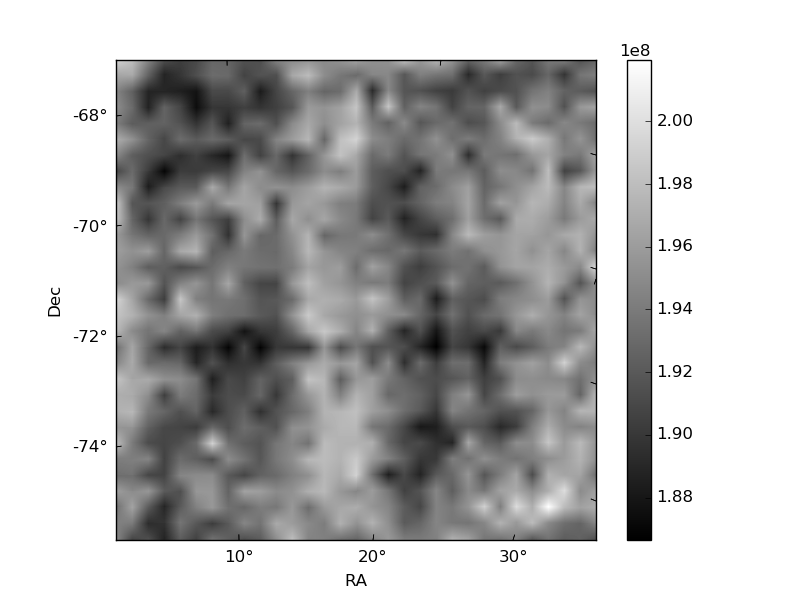
Histogram calculated using DETX and DETY for each event in the final _common_clean file
| Quadrant A | 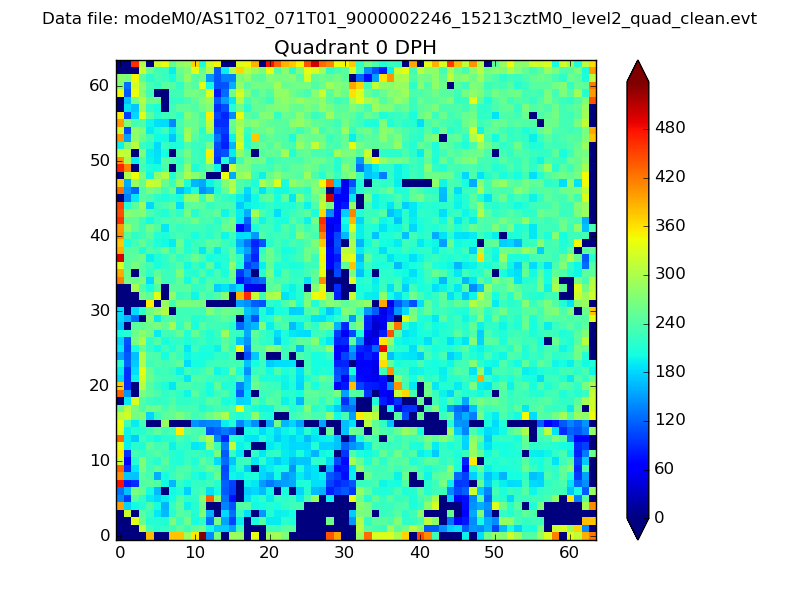 |
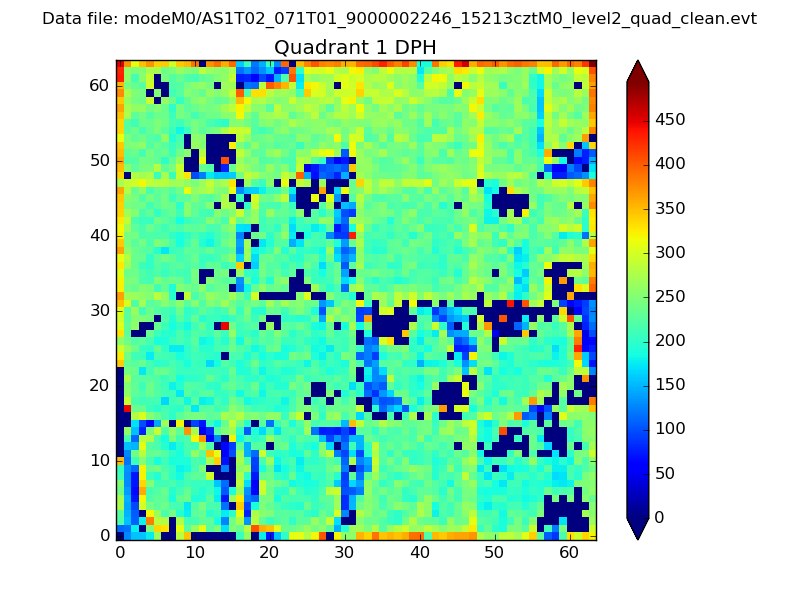 |
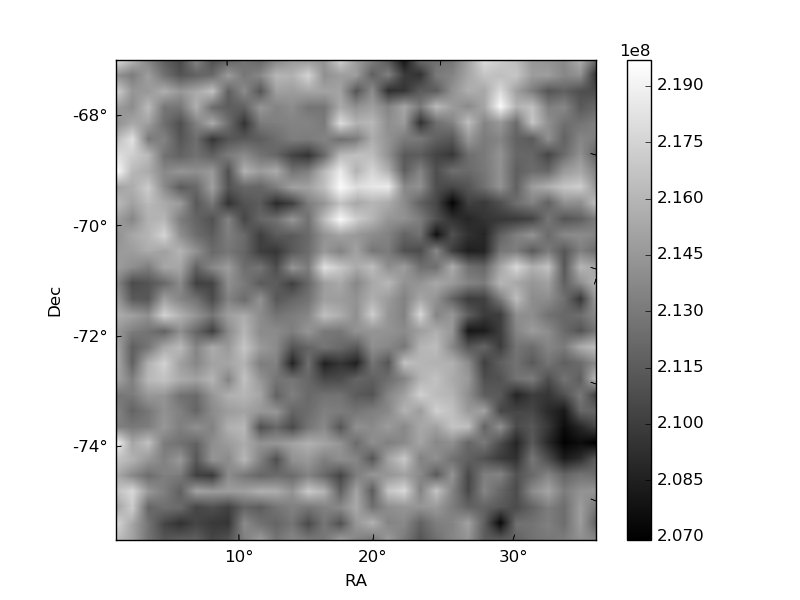
Quadrant B |
|---|---|---|---|
| Quadrant D | 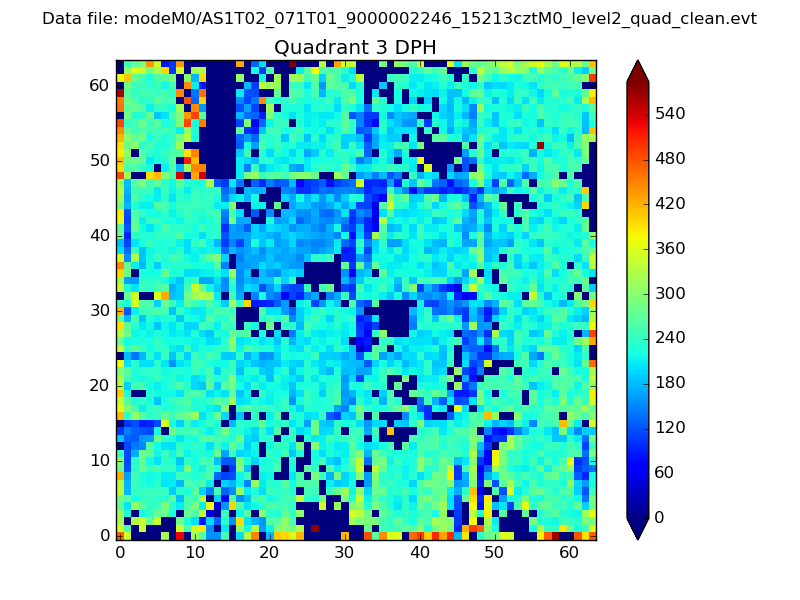 |
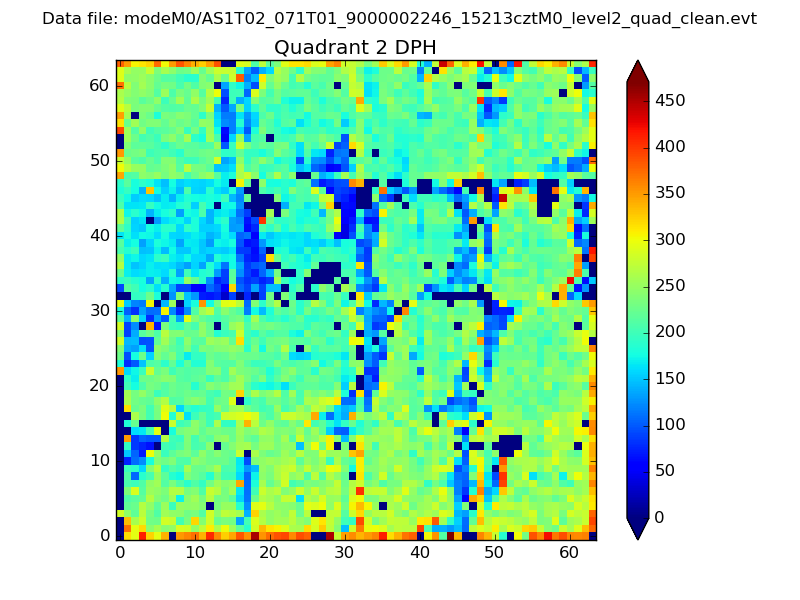 |
Quadrant C |
| Plot type | Count rate plots | Images |
|---|---|---|
| Comparison with Poisson distribution Blue bars denote a histogram of data divided into 1 sec bins. Red curve is a Poisson curve with rate = median count rate of data. |
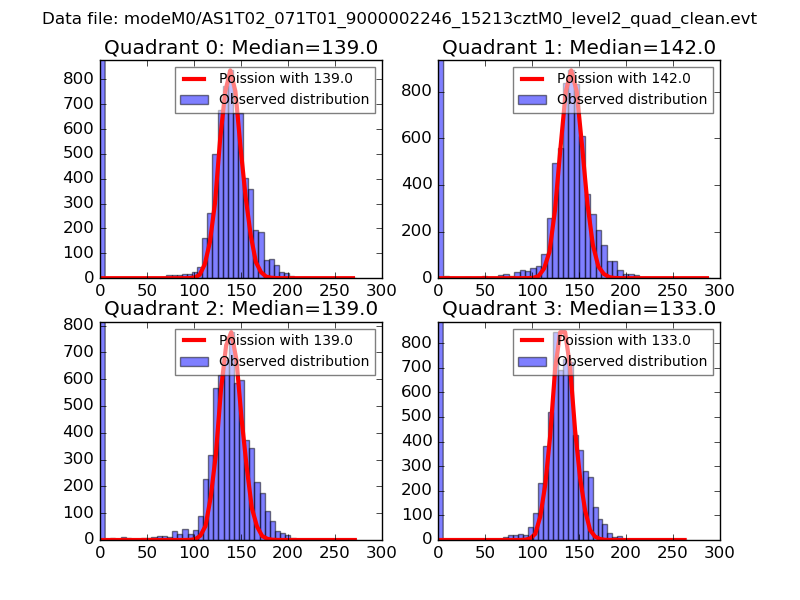 |
 |
| Quadrant-wise count rates Data is divided into 100 sec bins |
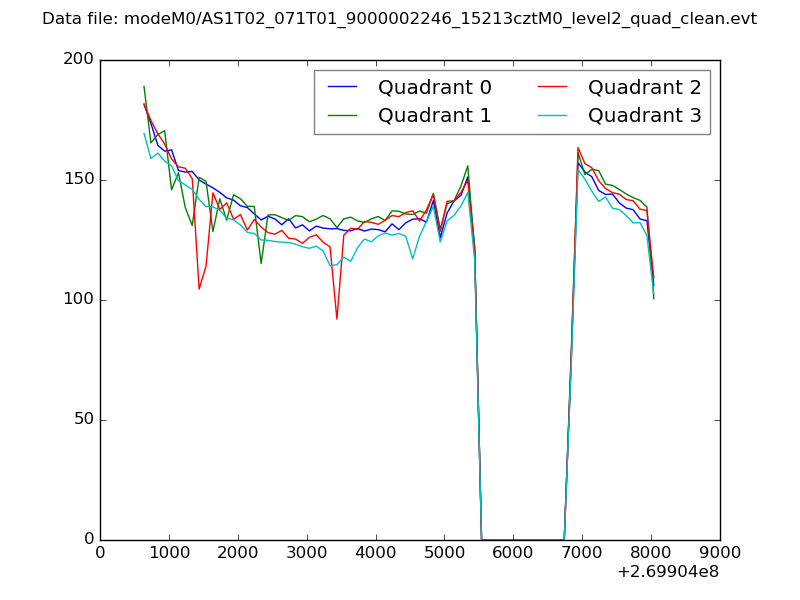 |
|
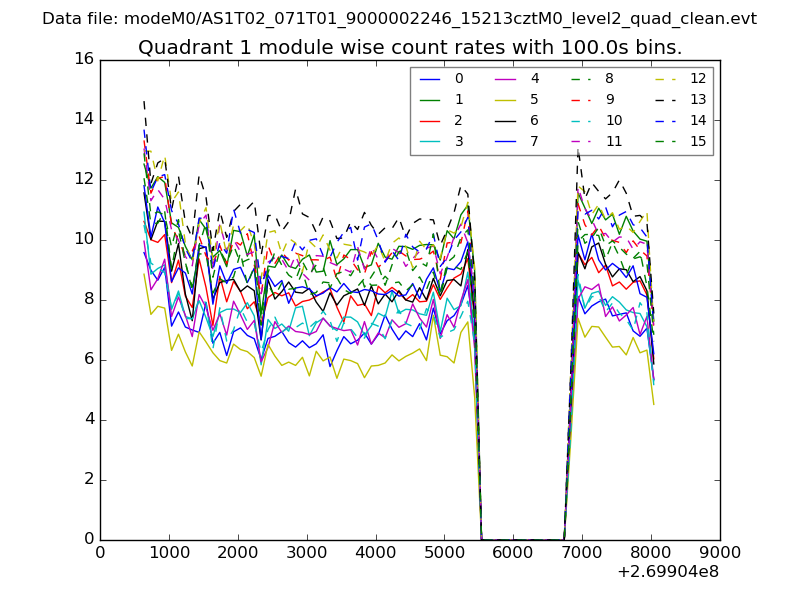
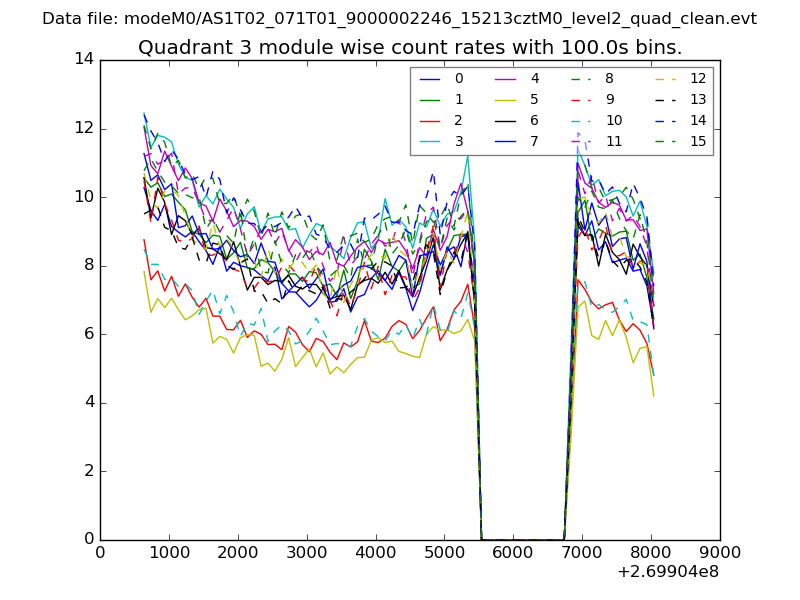
| Module-wise count rates for Quadrant A Data is divided into 100 sec bins |
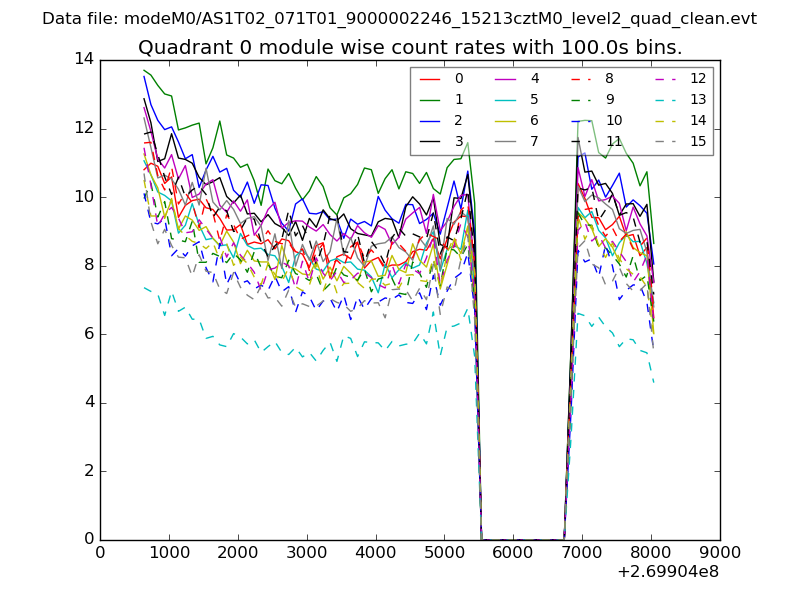 |
 |
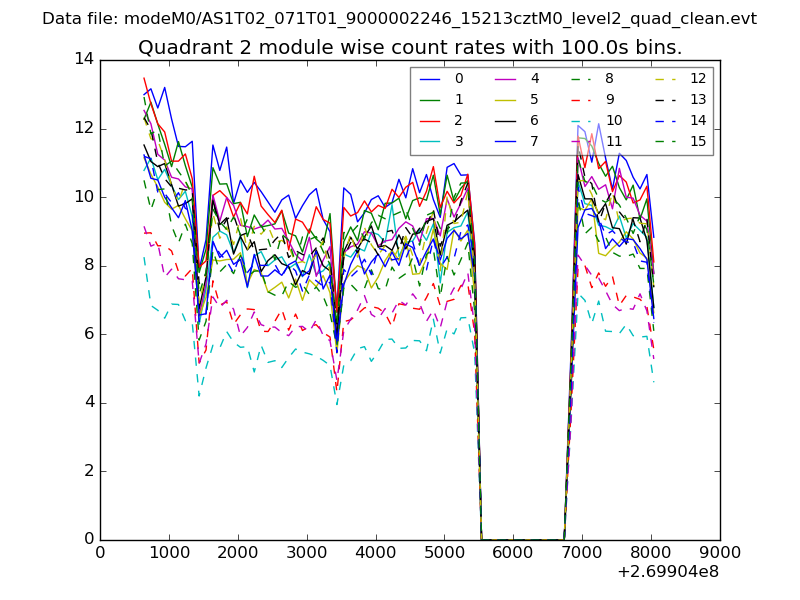
| Module-wise count rates for Quadrant B Data is divided into 100 sec bins |
 |
 |
| Module-wise count rates for Quadrant C Data is divided into 100 sec bins |
 |
 |
| Module-wise count rates for Quadrant D Data is divided into 100 sec bins |
 |
 |
| Parameter | Plot |
|---|---|
| CZT HV Monitor | 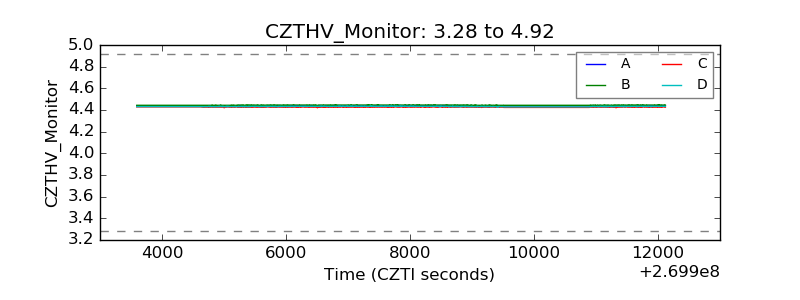 |
| D_VDD | 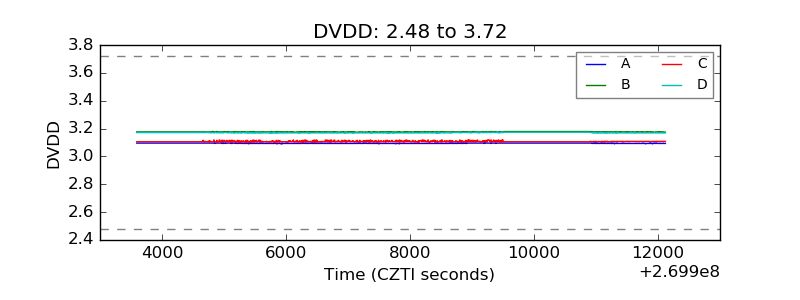 |
| Temperature 1 | 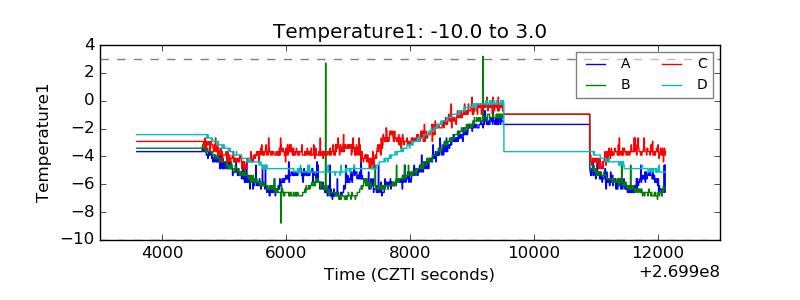 |
| Veto HV Monitor | 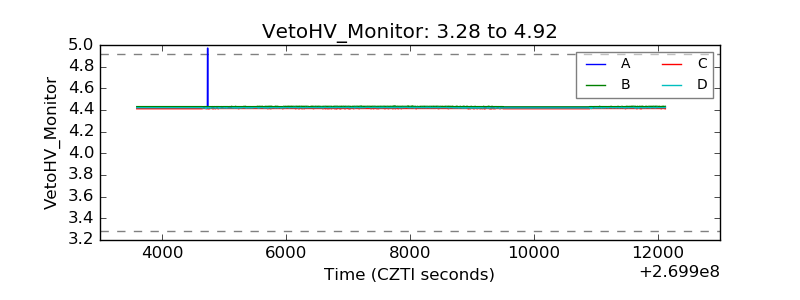 |
| Veto LLD | 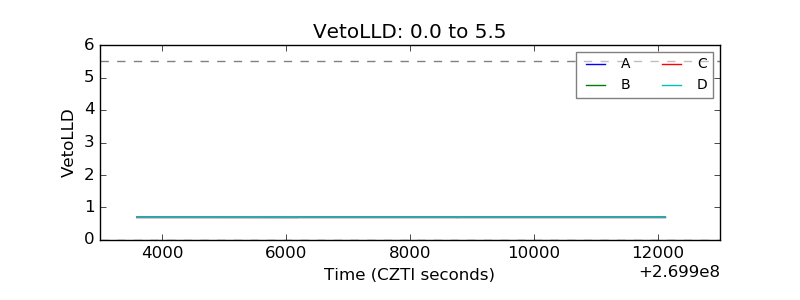 |
| Alpha Counter | 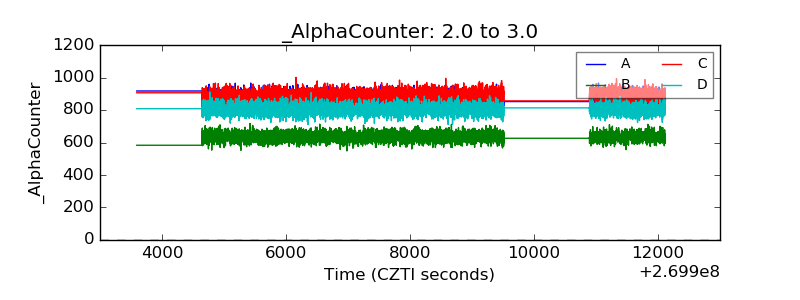 |
| _CPM_Rate | 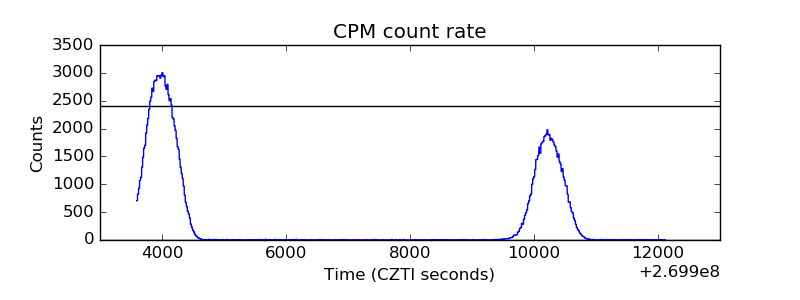 |
| CZT Counter | 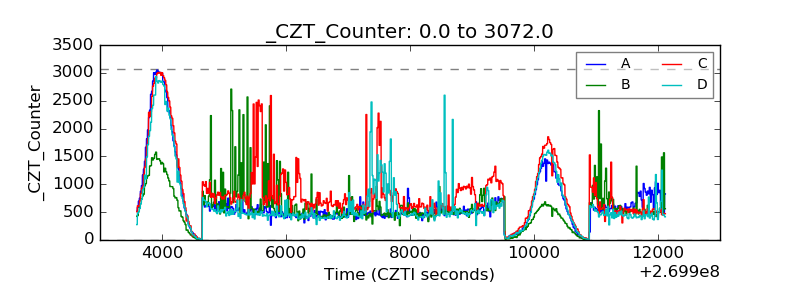 |
| +2.5 Volts monitor |  |
| +5 Volts monitor |  |
| _ROLL_ROT | 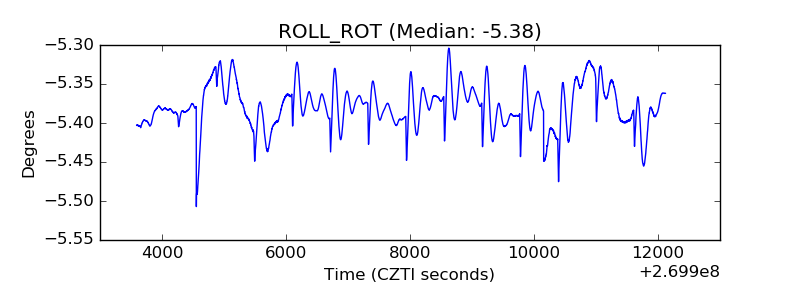 |
| _Roll_DEC | 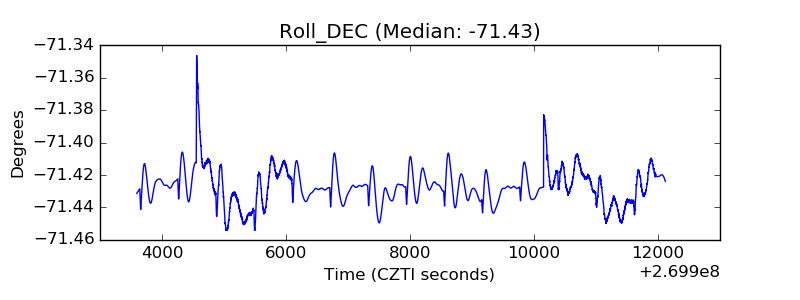 |
| _Roll_RA | 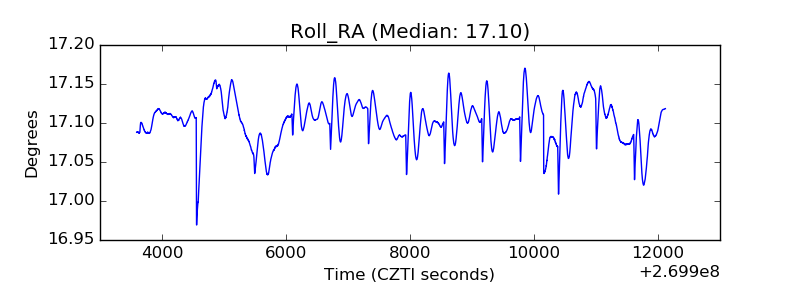 |
| Veto Counter | 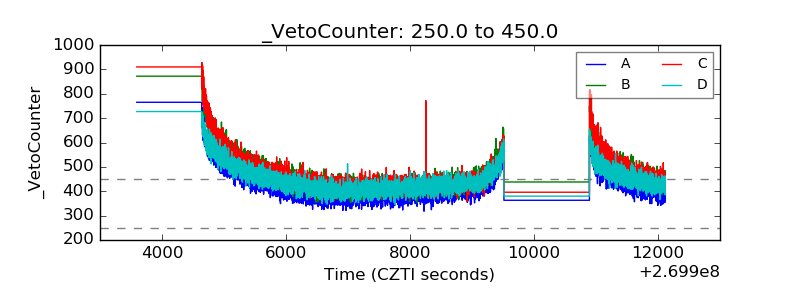 |