| Param | Original file | Final file |
|---|---|---|
| Filename | modeM0/AS1T02_071T01_9000002246_15214cztM0_level2.evt | modeM0/AS1T02_071T01_9000002246_15214cztM0_level2_quad_clean.evt |
| Size (bytes) | 618,966,720 | 129,951,360 |
| Size | 590.3 MB | 123.9 MB |
| Events in quadrant A | 5,789,478 | 861,583 |
| Events in quadrant B | 4,630,684 | 872,975 |
| Events in quadrant C | 4,638,108 | 884,892 |
| Events in quadrant D | 3,238,781 | 853,827 |
| Mode SS | |||
|---|---|---|---|
| Quadrant | BADHDUFLAG | Total packets | Discarded packets |
| A | 0 | 134 | 0 |
| B | 0 | 134 | 0 |
| C | 0 | 134 | 0 |
| D | 0 | 134 | 0 |
| Mode M9 | |||
|---|---|---|---|
| Quadrant | BADHDUFLAG | Total packets | Discarded packets |
| A | 0 | 24 | 0 |
| B | 0 | 24 | 0 |
| C | 0 | 24 | 0 |
| D | 0 | 25 | 0 |
| Mode M0 | |||
|---|---|---|---|
| Quadrant | BADHDUFLAG | Total packets | Discarded packets |
| A | 0 | 21775 | 3 |
| B | 0 | 18096 | 2 |
| C | 0 | 18131 | 2 |
| D | 0 | 14217 | 2 |
| Quadrant | Total seconds | Saturated seconds | Saturation percentage |
|---|---|---|---|
| A | 6636 | 126 | 1.898734% |
| B | 6636 | 463 | 6.977095% |
| C | 6636 | 135 | 2.034358% |
| D | 6636 | 37 | 0.557565% |
Noise dominated data is calculated using 1-second bins in cleaned event files. If a bin has >2000 counts, and if more than 50% of those come from <1% of pixels, then it is considered to be noise-dominated and hence unusable.
| Quadrant | # 1 sec bins | Bins with >0 counts | Bins with >2000 counts | High rate bins dominated by noise | Noise dominated (total time) | Noise dominated (detector-on time) | Marked lightcurve |
|---|---|---|---|---|---|---|---|
| A | 7832 | 6638 | 60 | 60 | 0.77% | 0.90% | 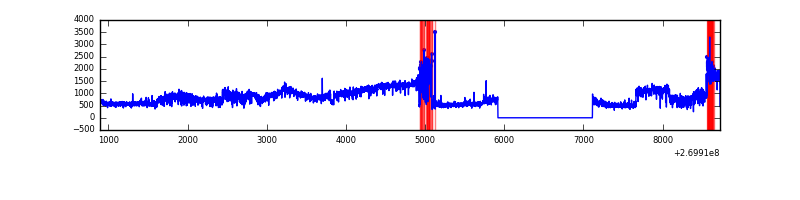 |
| B | 7832 | 6638 | 279 | 279 | 3.56% | 4.20% | 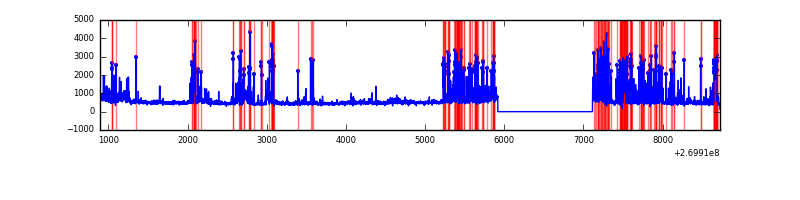 |
| C | 7832 | 6638 | 46 | 46 | 0.59% | 0.69% | 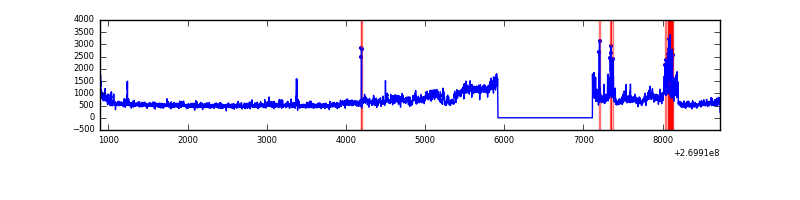 |
| D | 7832 | 6638 | 21 | 21 | 0.27% | 0.32% | 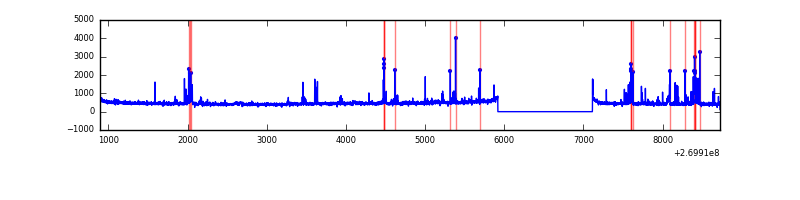 |
Top three noisy pixels from each quadrant. If the there are fewer than three noisy pixels in the level2.evt file, extra rows are filled as -1
| Pixel properties | Quadrant properties | ||||||
|---|---|---|---|---|---|---|---|
| Quadrant | DetID | PixID | Counts | Sigma | Mean | Median | Sigma |
| A | 0 | 253 | 2652297 | 16917.26 | 779 | 763 | 156.7 |
| A | 12 | 189 | 123698 | 784.35 | 779 | 763 | 156.7 |
| A | 9 | 143 | 7849 | 45.21 | 779 | 763 | 156.7 |
| B | 3 | 112 | 1403053 | 9670.64 | 776 | 756 | 145.0 |
| B | 0 | 229 | 102439 | 701.23 | 776 | 756 | 145.0 |
| B | 10 | 245 | 20858 | 138.63 | 776 | 756 | 145.0 |
| C | 3 | 233 | 1556039 | 8766.62 | 776 | 782 | 177.4 |
| C | 10 | 22 | 29780 | 163.45 | 776 | 782 | 177.4 |
| C | 7 | 247 | 13846 | 73.64 | 776 | 782 | 177.4 |
| D | 2 | 33 | 137470 | 737.13 | 771 | 749 | 185.5 |
| D | 13 | 172 | 76994 | 411.07 | 771 | 749 | 185.5 |
| D | 8 | 195 | 36724 | 193.96 | 771 | 749 | 185.5 |
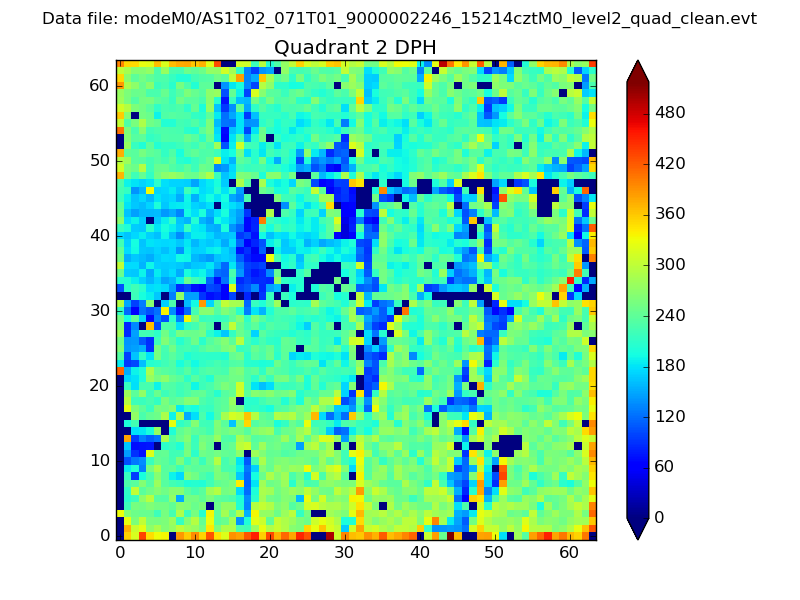
Histogram calculated using DETX and DETY for each event in the final _common_clean file
| Quadrant A |  |
 |
Quadrant B |
|---|---|---|---|
| Quadrant D | 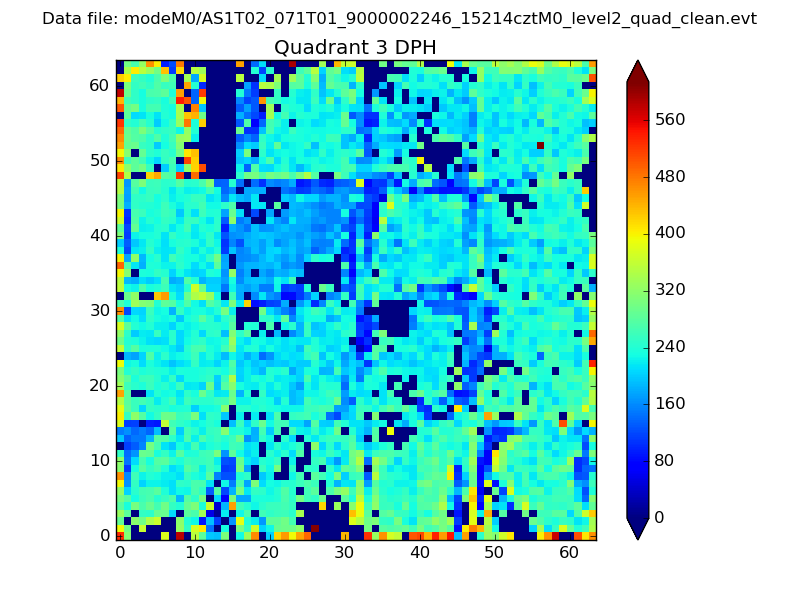 |
 |
Quadrant C |
| Plot type | Count rate plots | Images |
|---|---|---|
| Comparison with Poisson distribution Blue bars denote a histogram of data divided into 1 sec bins. Red curve is a Poisson curve with rate = median count rate of data. |
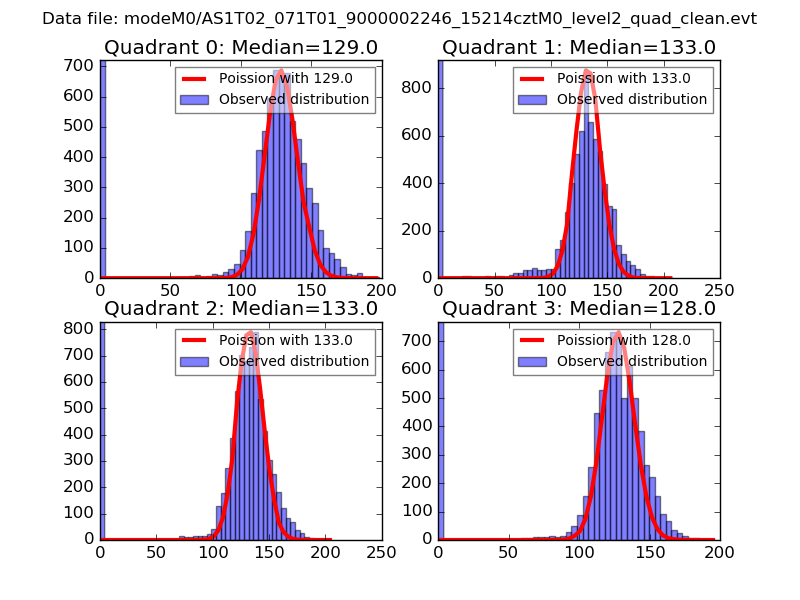 |
 |
| Quadrant-wise count rates Data is divided into 100 sec bins |
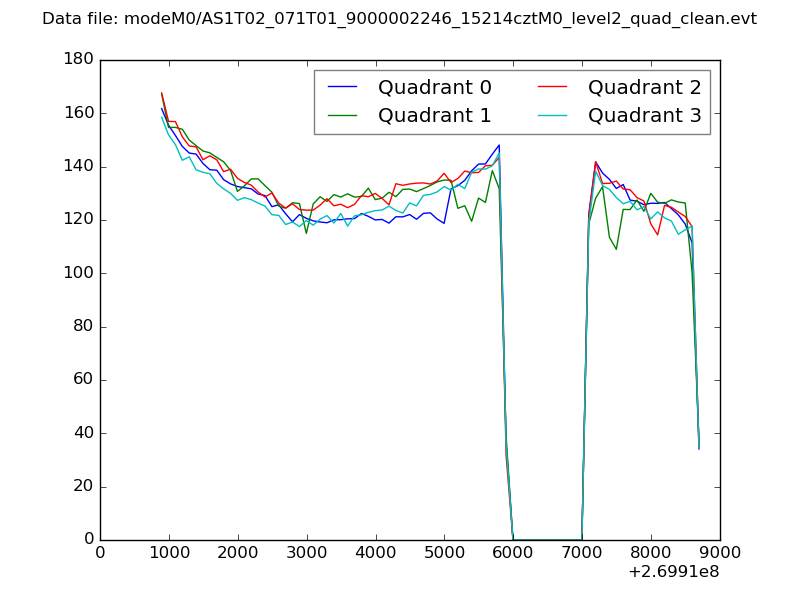 |
|
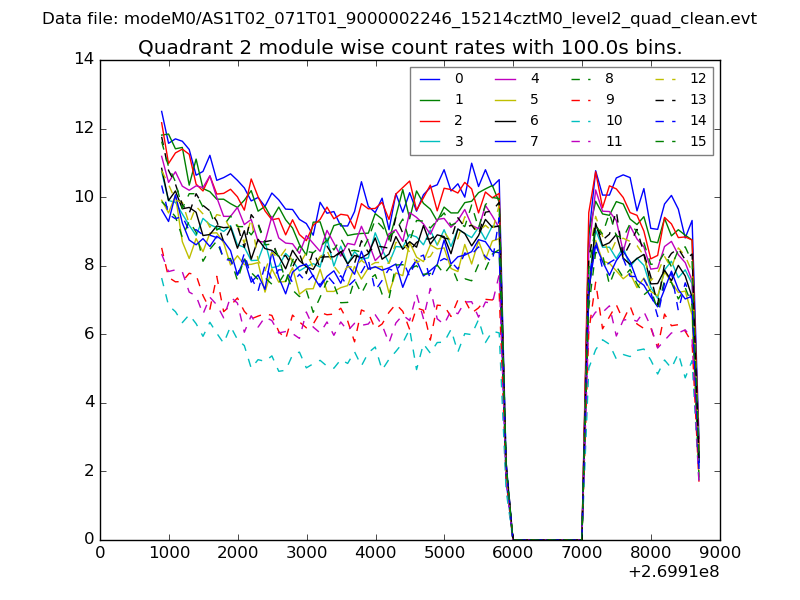
| Module-wise count rates for Quadrant A Data is divided into 100 sec bins |
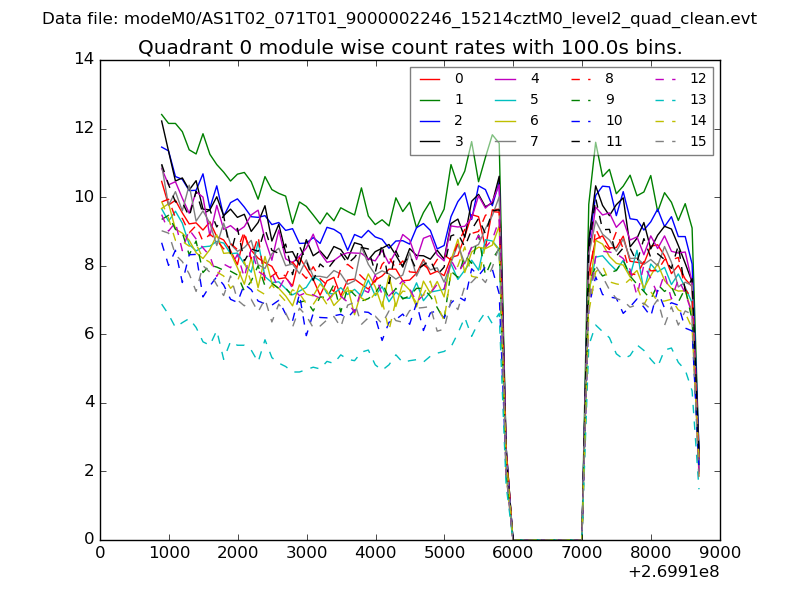 |
 |
| Module-wise count rates for Quadrant B Data is divided into 100 sec bins |
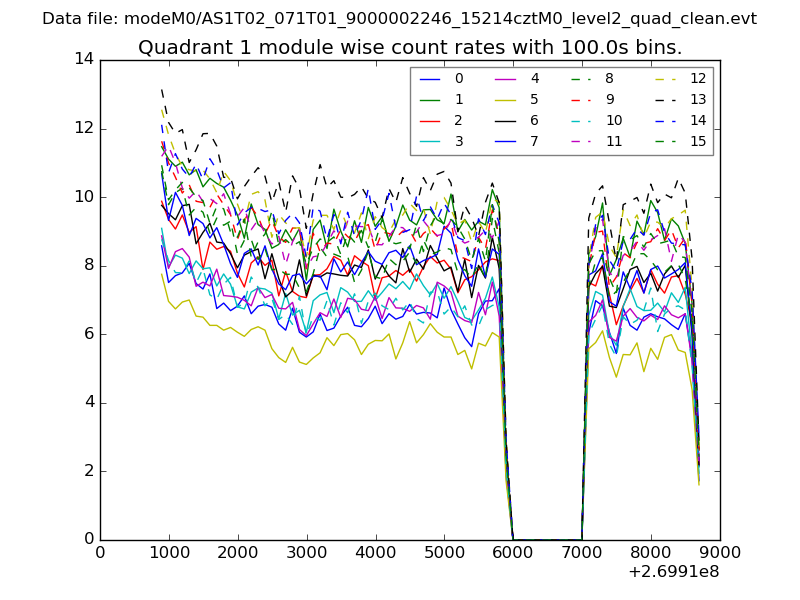 |
 |
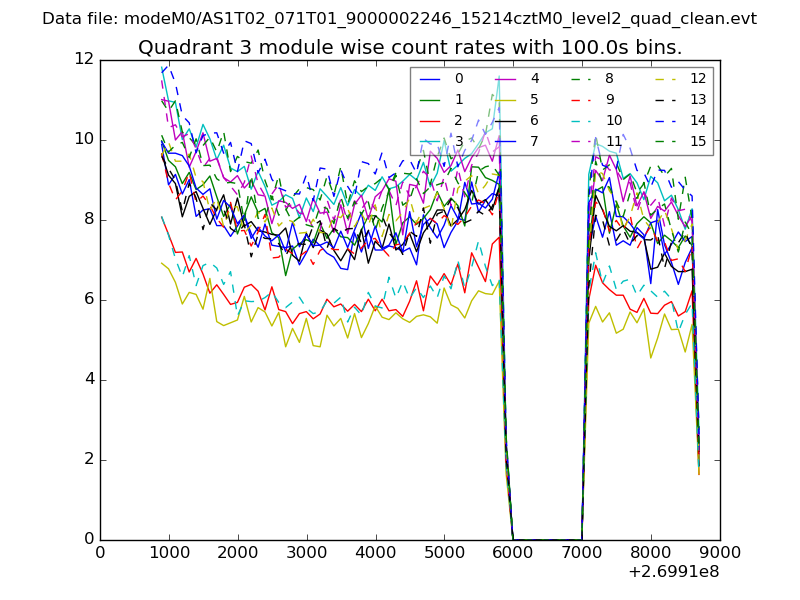
| Module-wise count rates for Quadrant C Data is divided into 100 sec bins |
 |
 |
| Module-wise count rates for Quadrant D Data is divided into 100 sec bins |
 |
 |
| Parameter | Plot |
|---|---|
| CZT HV Monitor | 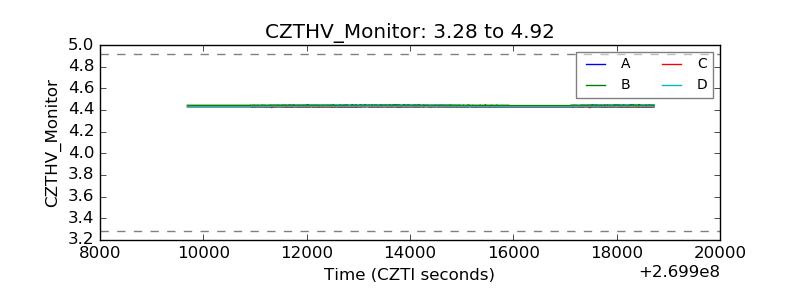 |
| D_VDD | 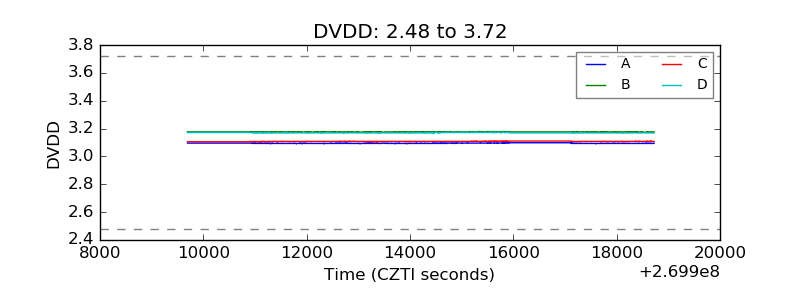 |
| Temperature 1 | 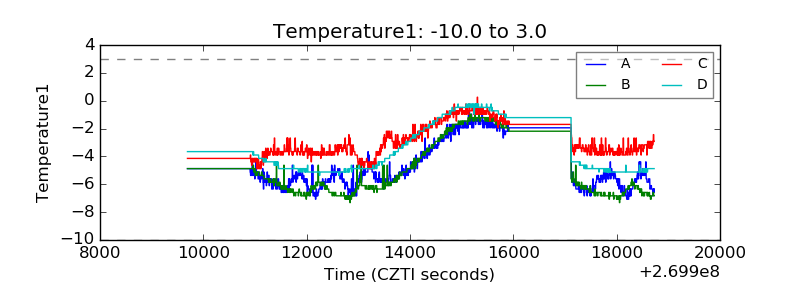 |
| Veto HV Monitor | 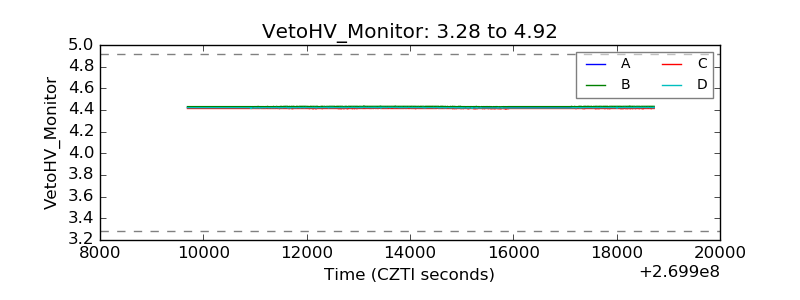 |
| Veto LLD | 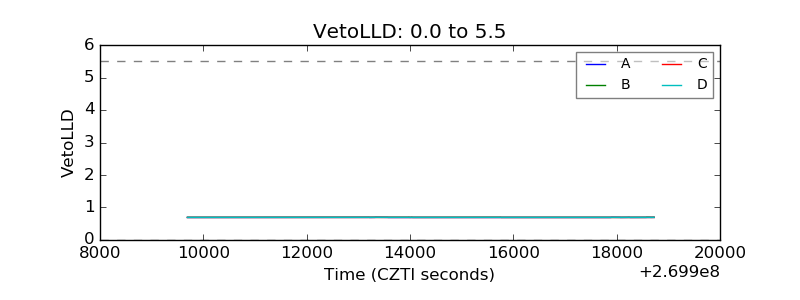 |
| Alpha Counter | 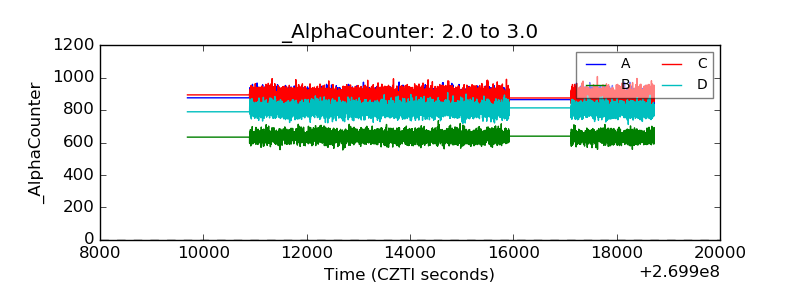 |
| _CPM_Rate | 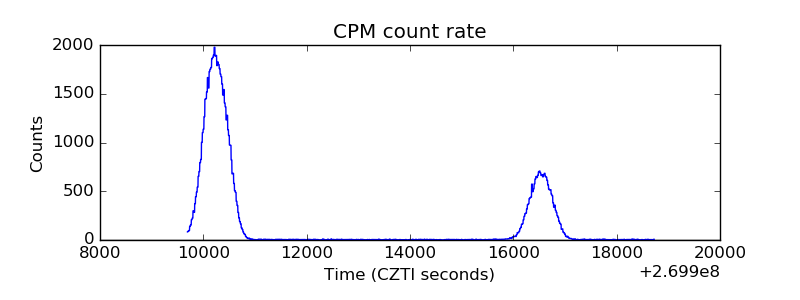 |
| CZT Counter | 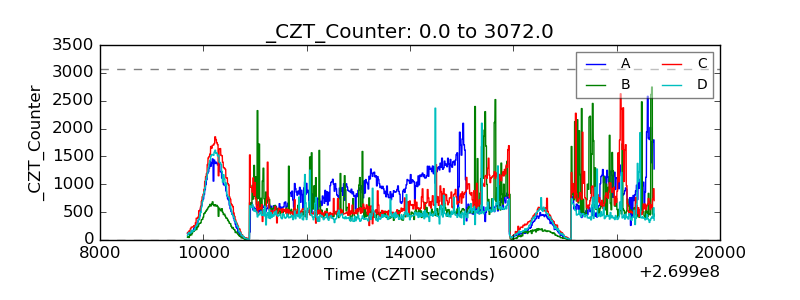 |
| +2.5 Volts monitor |  |
| +5 Volts monitor |  |
| _ROLL_ROT | 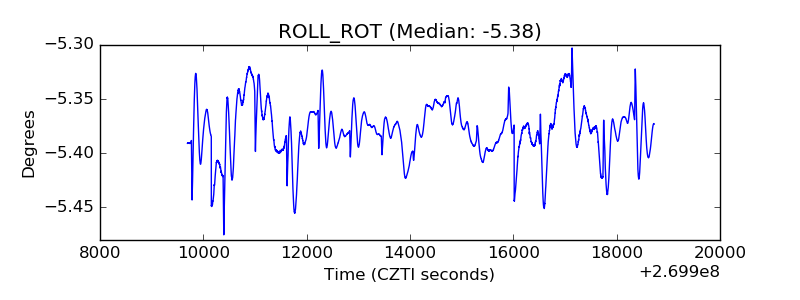 |
| _Roll_DEC | 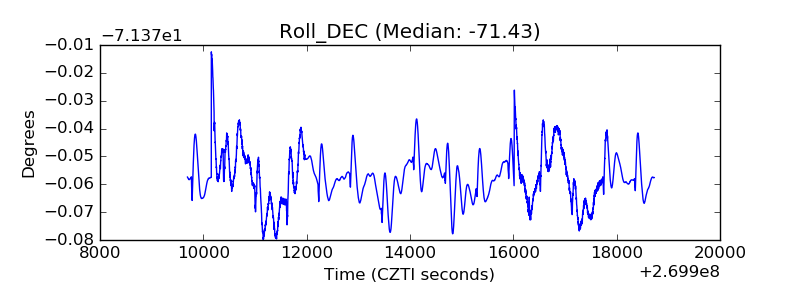 |
| _Roll_RA | 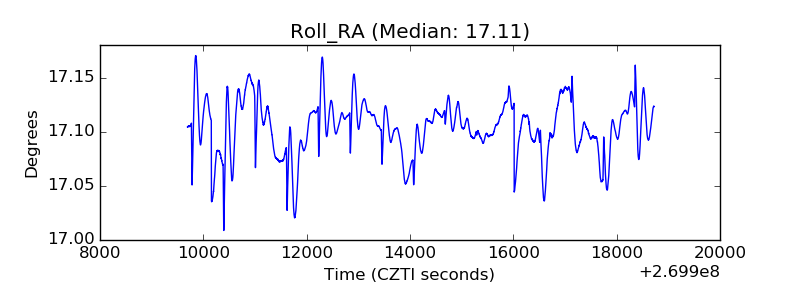 |
| Veto Counter | 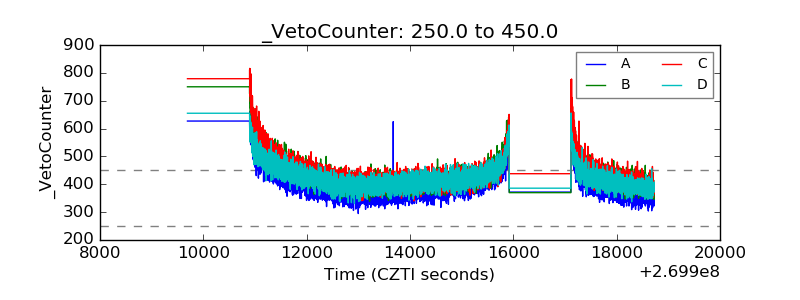 |