| Param | Original file | Final file |
|---|---|---|
| Filename | modeM0/AS1T02_071T01_9000002246_15215cztM0_level2.evt | modeM0/AS1T02_071T01_9000002246_15215cztM0_level2_quad_clean.evt |
| Size (bytes) | 719,513,280 | 121,688,640 |
| Size | 686.2 MB | 116.1 MB |
| Events in quadrant A | 6,813,382 | 804,935 |
| Events in quadrant B | 5,949,833 | 783,829 |
| Events in quadrant C | 5,426,512 | 827,346 |
| Events in quadrant D | 3,155,188 | 808,152 |
| Mode SS | |||
|---|---|---|---|
| Quadrant | BADHDUFLAG | Total packets | Discarded packets |
| A | 0 | 132 | 0 |
| B | 0 | 132 | 0 |
| C | 0 | 132 | 0 |
| D | 0 | 132 | 0 |
| Mode M9 | |||
|---|---|---|---|
| Quadrant | BADHDUFLAG | Total packets | Discarded packets |
| A | 0 | 9 | 0 |
| B | 0 | 9 | 0 |
| C | 0 | 9 | 0 |
| D | 0 | 9 | 0 |
| Mode M0 | |||
|---|---|---|---|
| Quadrant | BADHDUFLAG | Total packets | Discarded packets |
| A | 0 | 24761 | 2 |
| B | 0 | 22189 | 1 |
| C | 0 | 20702 | 1 |
| D | 0 | 14120 | 1 |
| Quadrant | Total seconds | Saturated seconds | Saturation percentage |
|---|---|---|---|
| A | 6613 | 485 | 7.334039% |
| B | 6613 | 984 | 14.879782% |
| C | 6613 | 187 | 2.827763% |
| D | 6613 | 48 | 0.725843% |
Noise dominated data is calculated using 1-second bins in cleaned event files. If a bin has >2000 counts, and if more than 50% of those come from <1% of pixels, then it is considered to be noise-dominated and hence unusable.
| Quadrant | # 1 sec bins | Bins with >0 counts | Bins with >2000 counts | High rate bins dominated by noise | Noise dominated (total time) | Noise dominated (detector-on time) | Marked lightcurve |
|---|---|---|---|---|---|---|---|
| A | 7434 | 6615 | 517 | 517 | 6.95% | 7.82% | 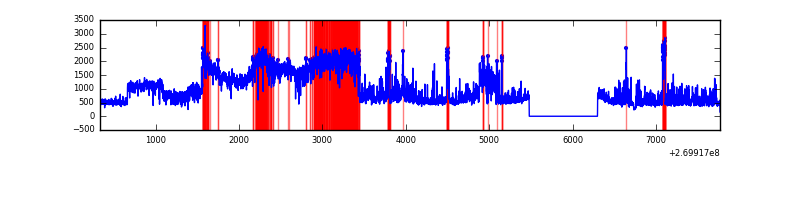 |
| B | 7434 | 6615 | 652 | 652 | 8.77% | 9.86% | 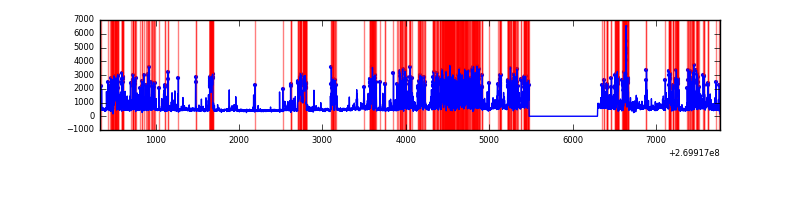 |
| C | 7434 | 6615 | 114 | 114 | 1.53% | 1.72% | 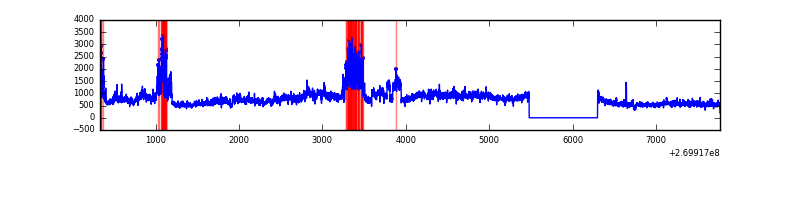 |
| D | 7434 | 6615 | 20 | 20 | 0.27% | 0.30% | 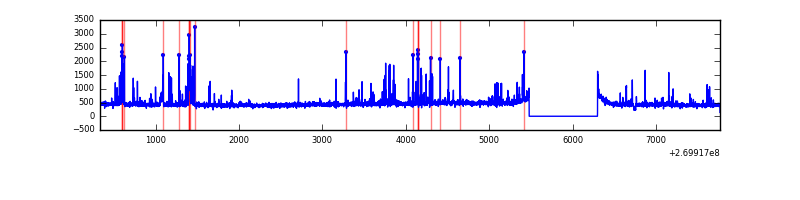 |
Top three noisy pixels from each quadrant. If the there are fewer than three noisy pixels in the level2.evt file, extra rows are filled as -1
| Pixel properties | Quadrant properties | ||||||
|---|---|---|---|---|---|---|---|
| Quadrant | DetID | PixID | Counts | Sigma | Mean | Median | Sigma |
| A | 0 | 253 | 3660179 | 23989.72 | 754 | 738 | 152.5 |
| A | 12 | 189 | 227601 | 1487.22 | 754 | 738 | 152.5 |
| A | 13 | 248 | 24889 | 158.32 | 754 | 738 | 152.5 |
| B | 3 | 112 | 2808149 | 20762.55 | 723 | 705 | 135.2 |
| B | 0 | 245 | 87856 | 644.53 | 723 | 705 | 135.2 |
| B | 0 | 229 | 82443 | 604.5 | 723 | 705 | 135.2 |
| C | 3 | 233 | 2486774 | 14549.97 | 750 | 753 | 170.9 |
| C | 4 | 254 | 7799 | 41.24 | 750 | 753 | 170.9 |
| C | 13 | 61 | 5371 | 27.03 | 750 | 753 | 170.9 |
| D | 2 | 33 | 103139 | 562.29 | 751 | 728 | 182.1 |
| D | 8 | 195 | 81794 | 445.09 | 751 | 728 | 182.1 |
| D | 13 | 172 | 55833 | 302.55 | 751 | 728 | 182.1 |
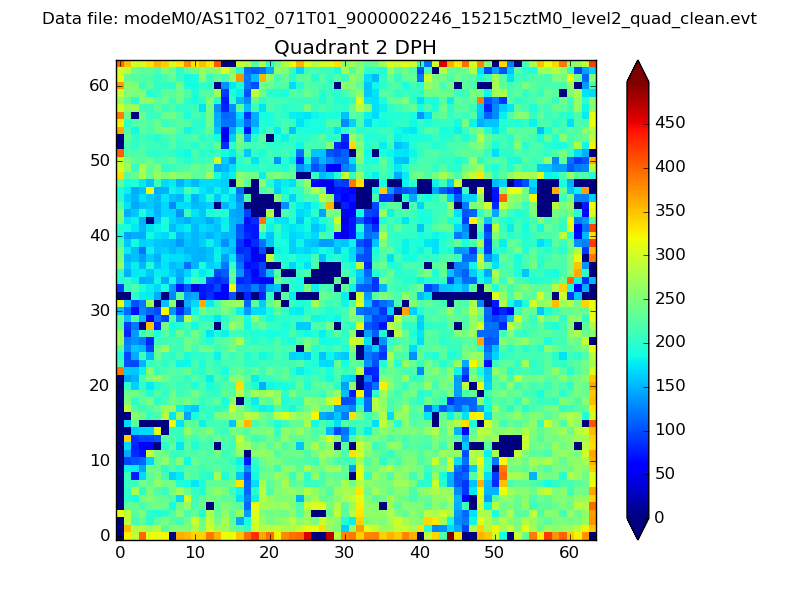
Histogram calculated using DETX and DETY for each event in the final _common_clean file
| Quadrant A | 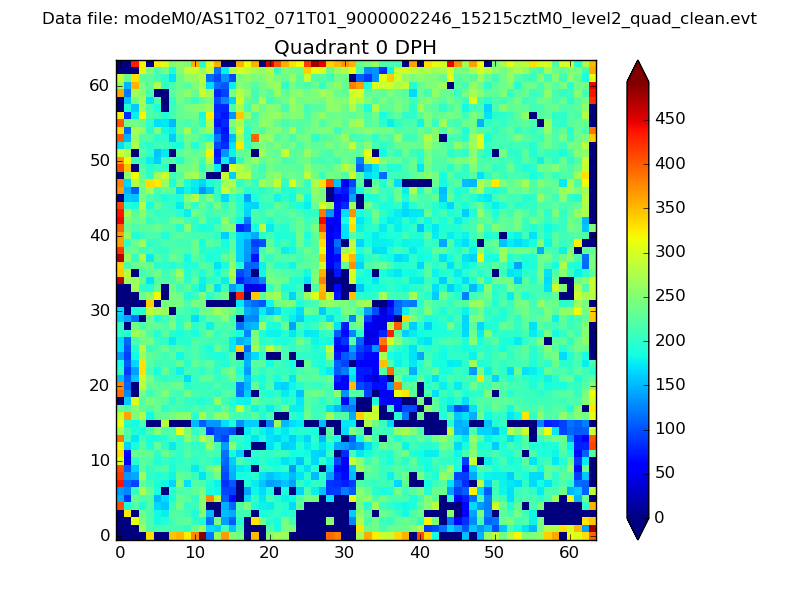 |
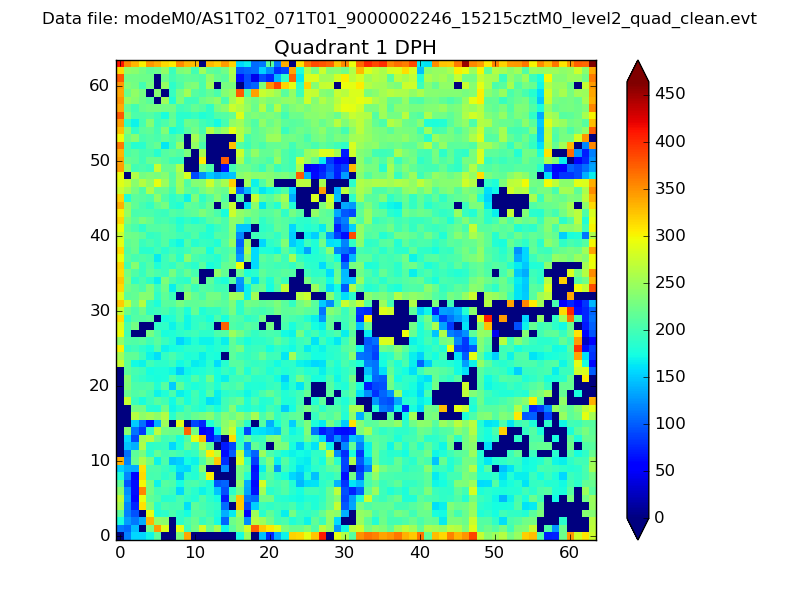 |
Quadrant B |
|---|---|---|---|
| Quadrant D | 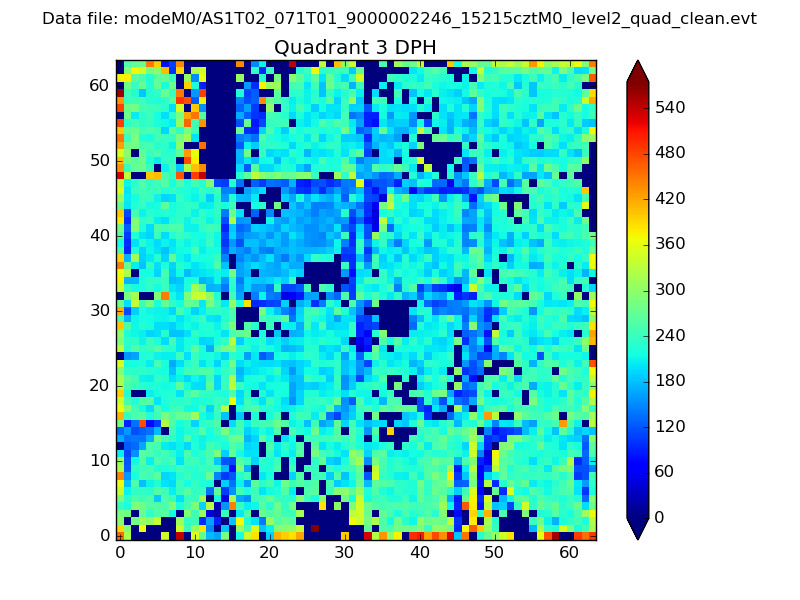 |
 |
Quadrant C |
| Plot type | Count rate plots | Images |
|---|---|---|
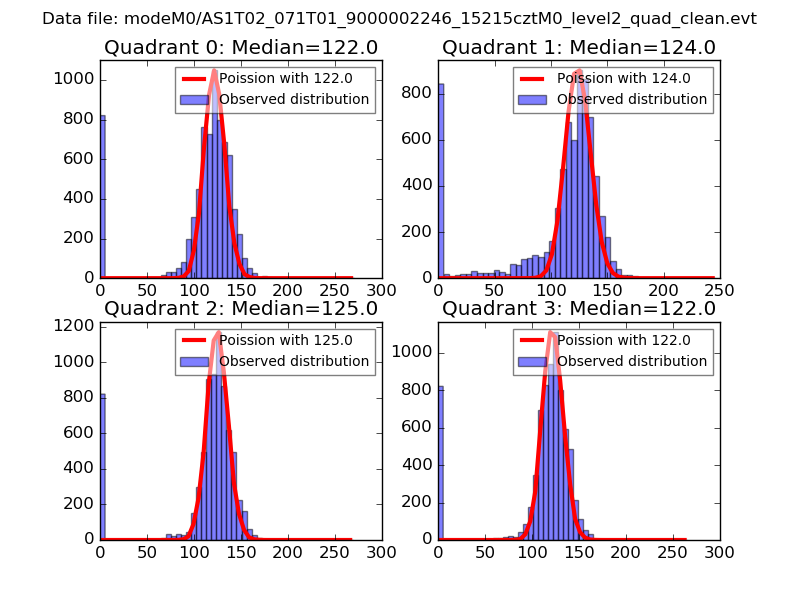
| Comparison with Poisson distribution Blue bars denote a histogram of data divided into 1 sec bins. Red curve is a Poisson curve with rate = median count rate of data. |
 |
 |
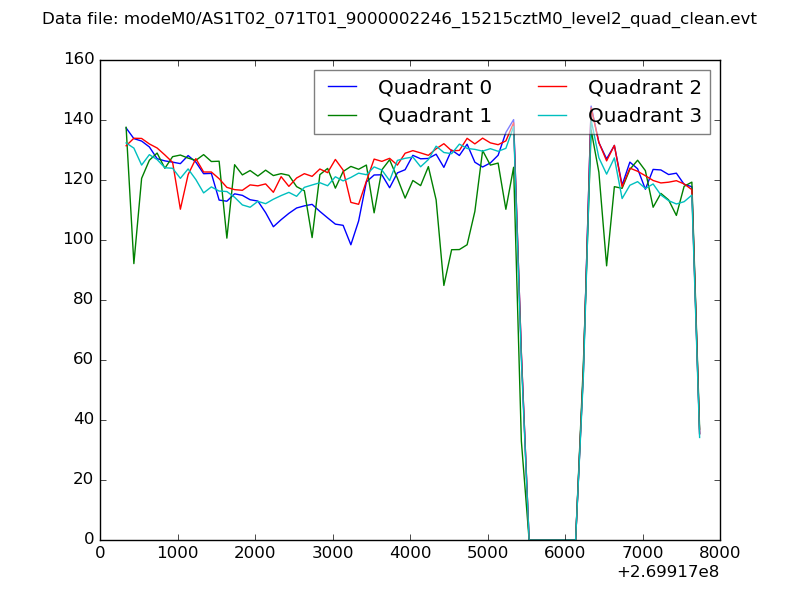
| Quadrant-wise count rates Data is divided into 100 sec bins |
 |
|
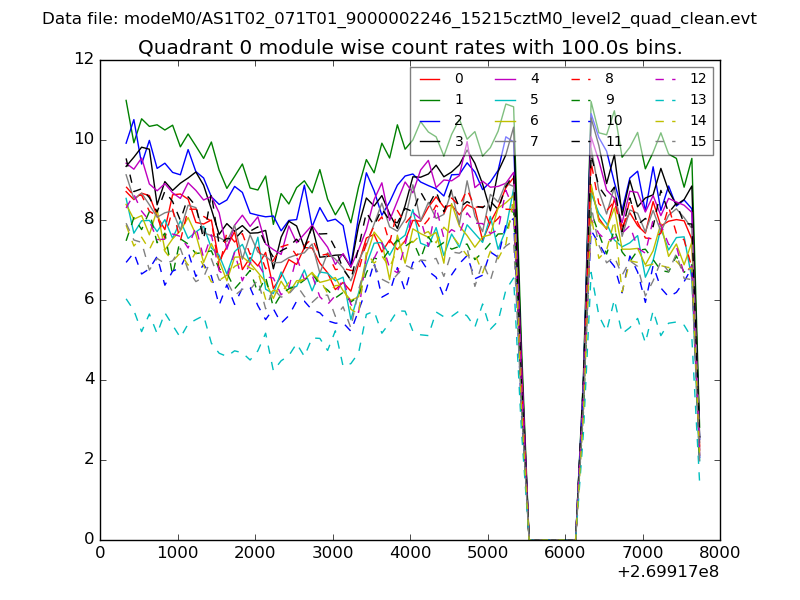
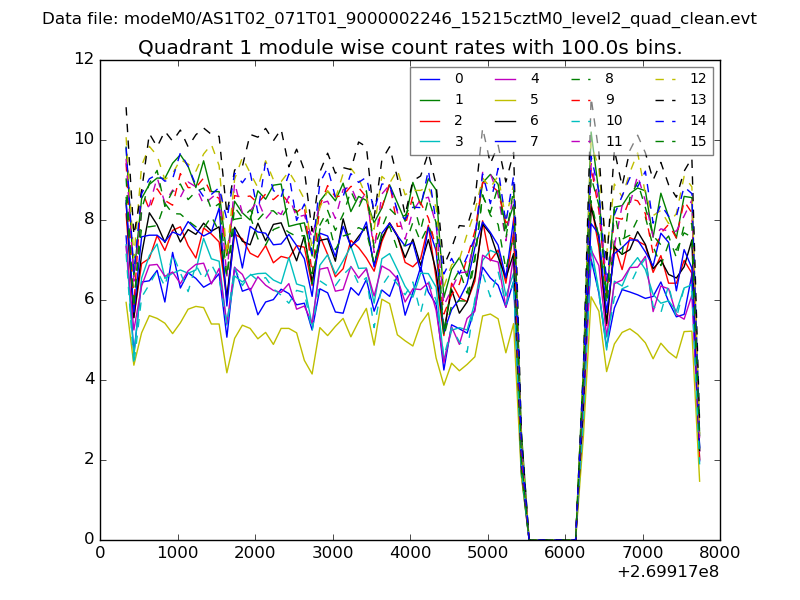
| Module-wise count rates for Quadrant A Data is divided into 100 sec bins |
 |
 |
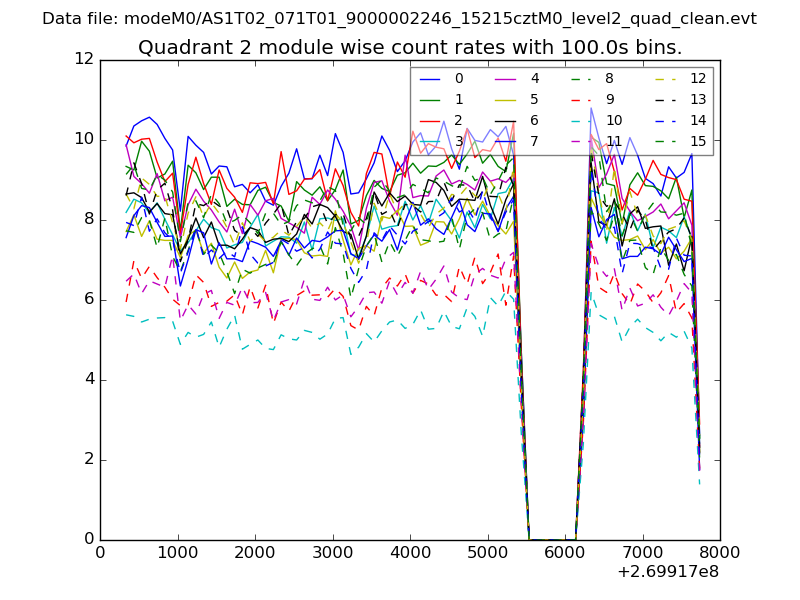
| Module-wise count rates for Quadrant B Data is divided into 100 sec bins |
 |
 |
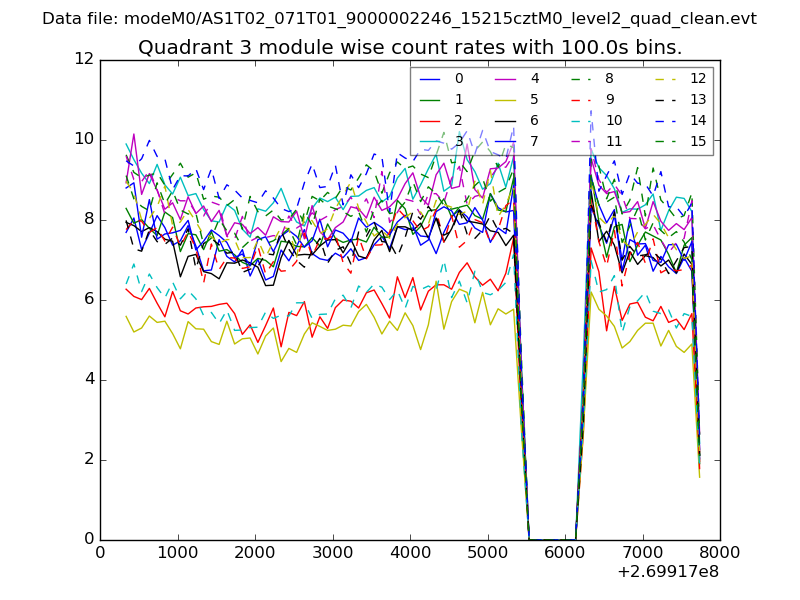
| Module-wise count rates for Quadrant C Data is divided into 100 sec bins |
 |
 |
| Module-wise count rates for Quadrant D Data is divided into 100 sec bins |
 |
 |
| Parameter | Plot |
|---|---|
| CZT HV Monitor | 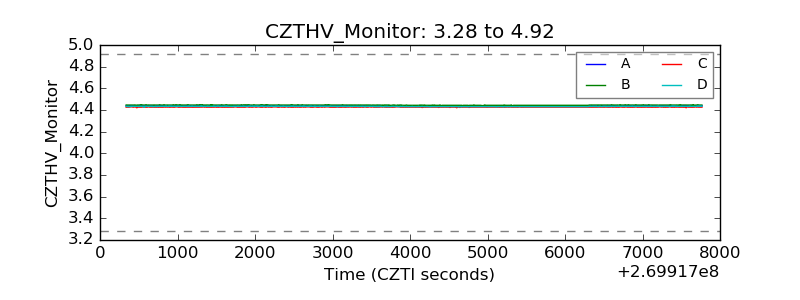 |
| D_VDD | 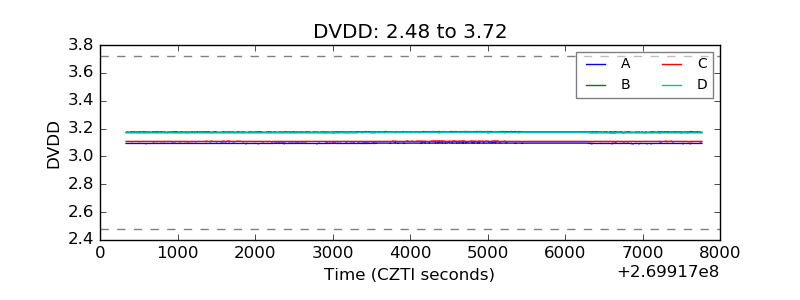 |
| Temperature 1 | 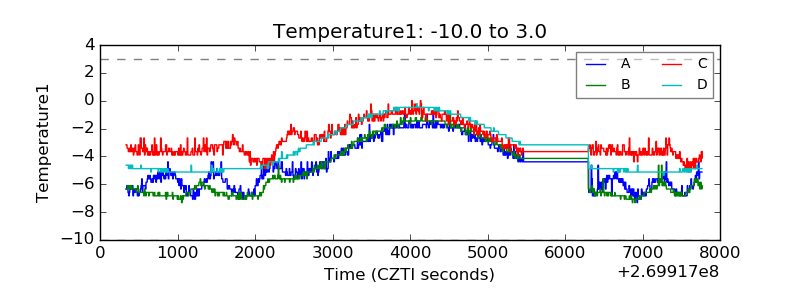 |
| Veto HV Monitor | 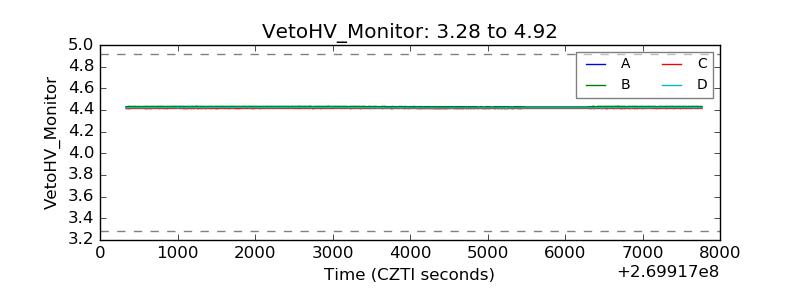 |
| Veto LLD | 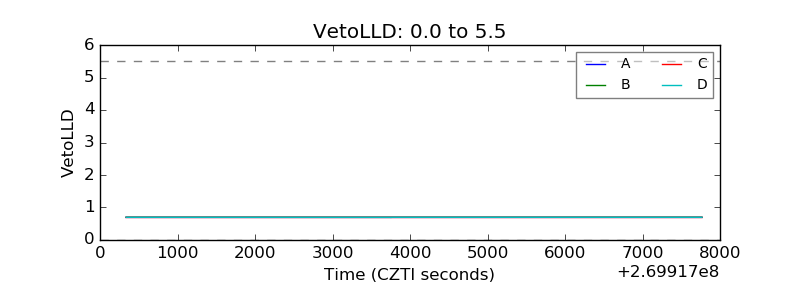 |
| Alpha Counter | 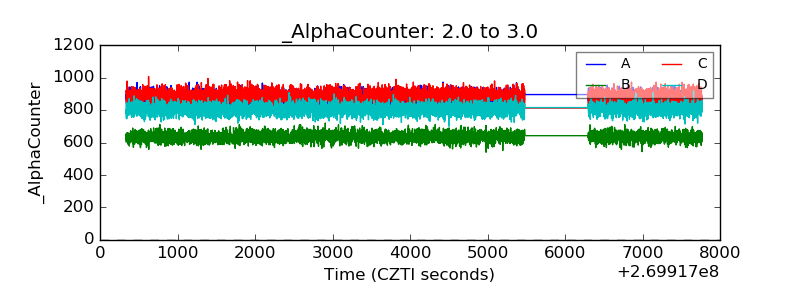 |
| _CPM_Rate | 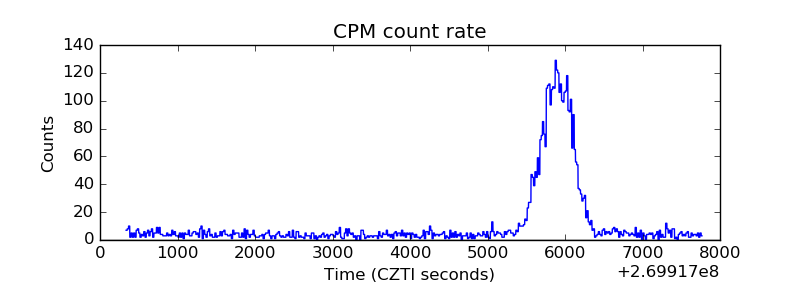 |
| CZT Counter | 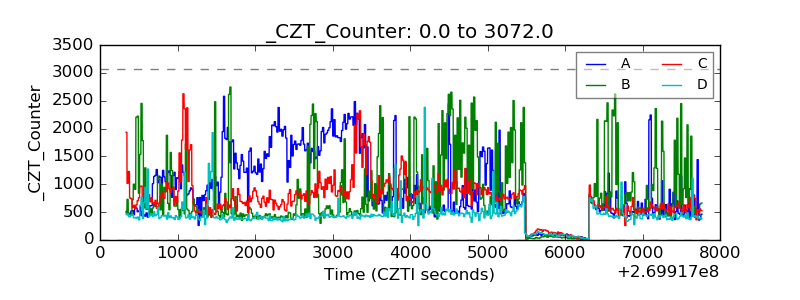 |
| +2.5 Volts monitor |  |
| +5 Volts monitor |  |
| _ROLL_ROT | 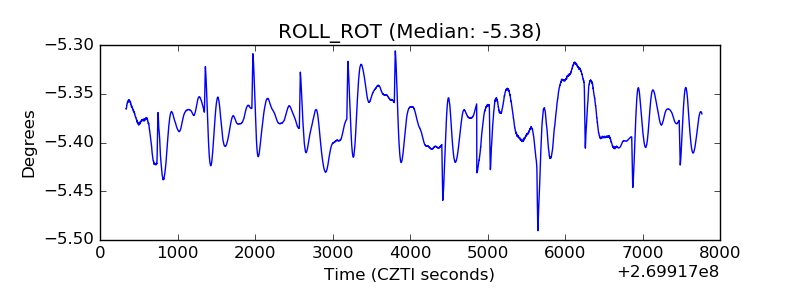 |
| _Roll_DEC | 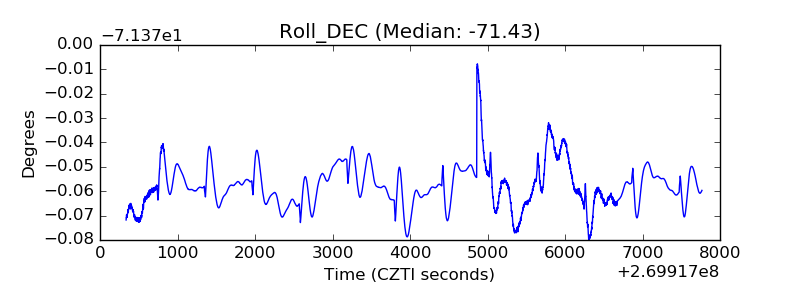 |
| _Roll_RA | 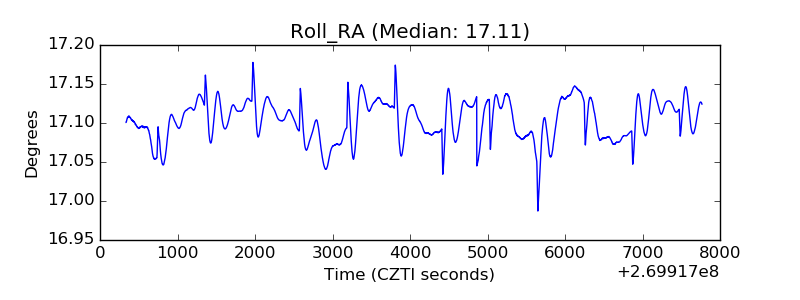 |
| Veto Counter | 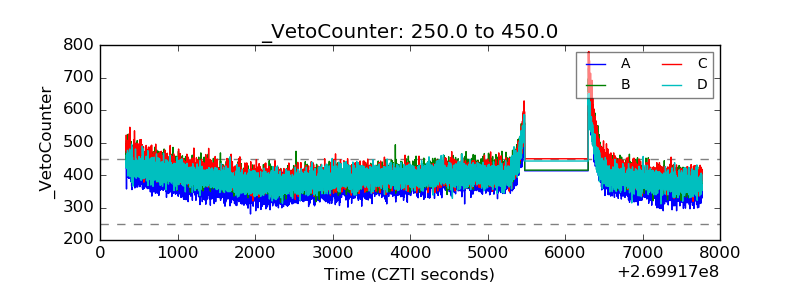 |