| Param | Original file | Final file |
|---|---|---|
| Filename | modeM0/AS1T02_071T01_9000002246_15216cztM0_level2.evt | modeM0/AS1T02_071T01_9000002246_15216cztM0_level2_quad_clean.evt |
| Size (bytes) | 636,243,840 | 135,806,400 |
| Size | 606.8 MB | 129.5 MB |
| Events in quadrant A | 5,298,968 | 904,139 |
| Events in quadrant B | 5,619,428 | 886,608 |
| Events in quadrant C | 4,482,992 | 918,151 |
| Events in quadrant D | 3,362,599 | 885,327 |
| Mode SS | |||
|---|---|---|---|
| Quadrant | BADHDUFLAG | Total packets | Discarded packets |
| A | 0 | 152 | 0 |
| B | 0 | 152 | 0 |
| C | 0 | 152 | 0 |
| D | 0 | 152 | 0 |
| Mode M9 | |||
|---|---|---|---|
| Quadrant | BADHDUFLAG | Total packets | Discarded packets |
| A | 0 | 13 | 0 |
| B | 0 | 13 | 0 |
| C | 0 | 13 | 0 |
| D | 0 | 13 | 0 |
| Mode M0 | |||
|---|---|---|---|
| Quadrant | BADHDUFLAG | Total packets | Discarded packets |
| A | 0 | 20784 | 3 |
| B | 0 | 21746 | 2 |
| C | 0 | 18169 | 2 |
| D | 0 | 15496 | 2 |
| Quadrant | Total seconds | Saturated seconds | Saturation percentage |
|---|---|---|---|
| A | 7458 | 240 | 3.218021% |
| B | 7458 | 664 | 8.903191% |
| C | 7458 | 133 | 1.783320% |
| D | 7458 | 66 | 0.884956% |
Noise dominated data is calculated using 1-second bins in cleaned event files. If a bin has >2000 counts, and if more than 50% of those come from <1% of pixels, then it is considered to be noise-dominated and hence unusable.
| Quadrant | # 1 sec bins | Bins with >0 counts | Bins with >2000 counts | High rate bins dominated by noise | Noise dominated (total time) | Noise dominated (detector-on time) | Marked lightcurve |
|---|---|---|---|---|---|---|---|
| A | 8649 | 7461 | 157 | 157 | 1.82% | 2.10% | 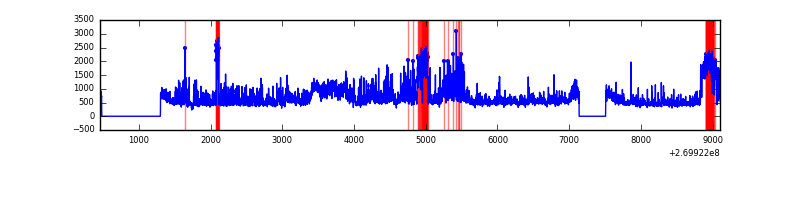 |
| B | 8649 | 7461 | 376 | 376 | 4.35% | 5.04% | 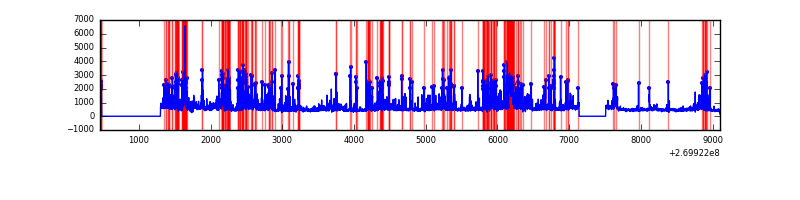 |
| C | 8649 | 7461 | 13 | 13 | 0.15% | 0.17% | 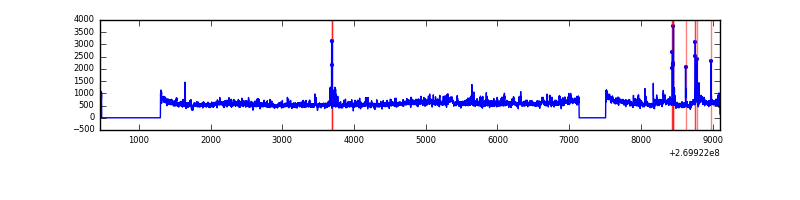 |
| D | 8649 | 7461 | 8 | 8 | 0.09% | 0.11% | 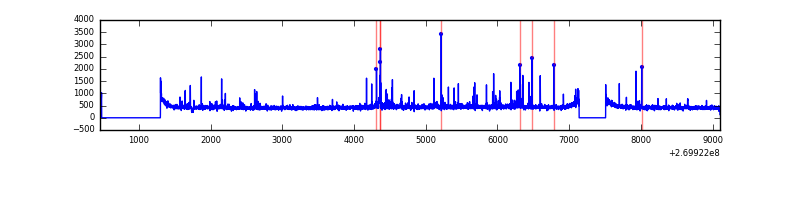 |
Top three noisy pixels from each quadrant. If the there are fewer than three noisy pixels in the level2.evt file, extra rows are filled as -1
| Pixel properties | Quadrant properties | ||||||
|---|---|---|---|---|---|---|---|
| Quadrant | DetID | PixID | Counts | Sigma | Mean | Median | Sigma |
| A | 0 | 253 | 1792841 | 10304.63 | 858 | 838 | 173.9 |
| A | 12 | 189 | 170127 | 973.47 | 858 | 838 | 173.9 |
| A | 13 | 248 | 35220 | 197.71 | 858 | 838 | 173.9 |
| B | 3 | 112 | 1836046 | 11592.98 | 838 | 814 | 158.3 |
| B | 0 | 229 | 282606 | 1780.05 | 838 | 814 | 158.3 |
| B | 0 | 245 | 79776 | 498.79 | 838 | 814 | 158.3 |
| C | 3 | 233 | 1089658 | 5615.32 | 847 | 851 | 193.9 |
| C | 4 | 254 | 72246 | 368.21 | 847 | 851 | 193.9 |
| C | 0 | 207 | 6995 | 31.69 | 847 | 851 | 193.9 |
| D | 8 | 195 | 60904 | 291.76 | 844 | 816 | 205.9 |
| D | 2 | 234 | 26486 | 124.64 | 844 | 816 | 205.9 |
| D | 2 | 33 | 24100 | 113.06 | 844 | 816 | 205.9 |
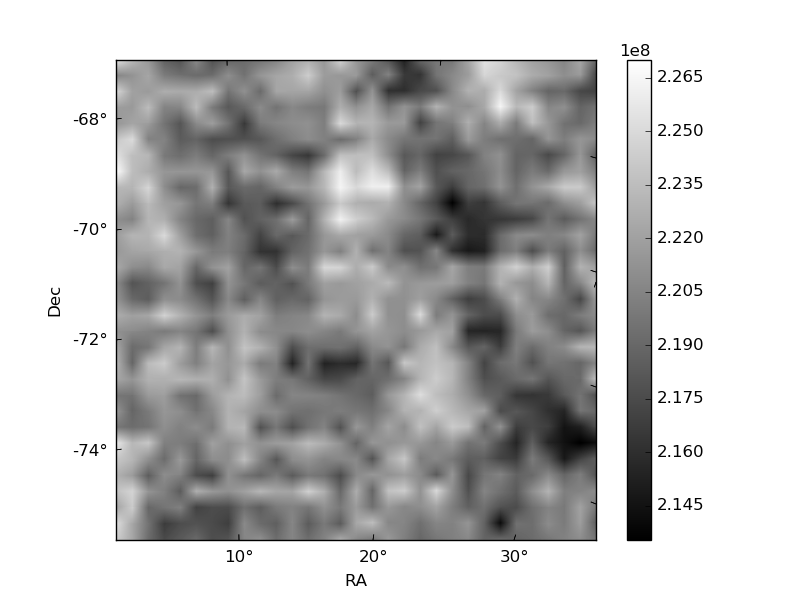
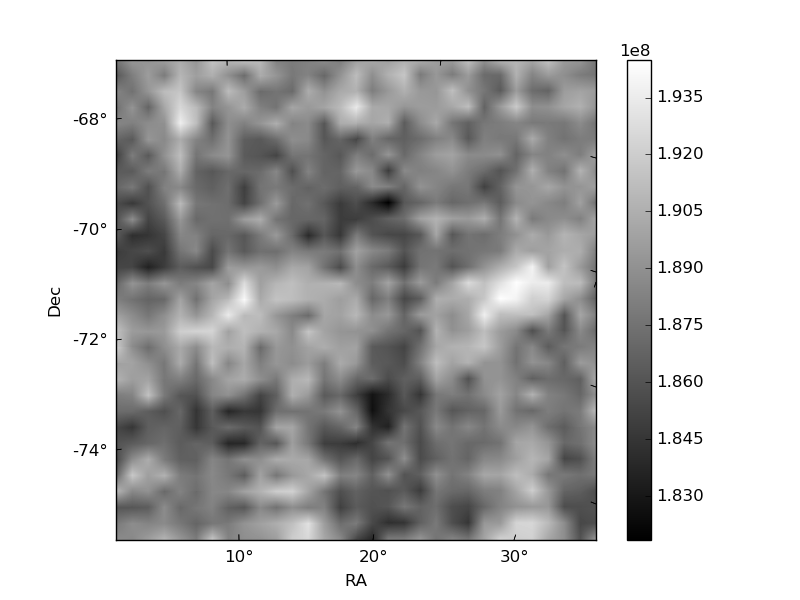
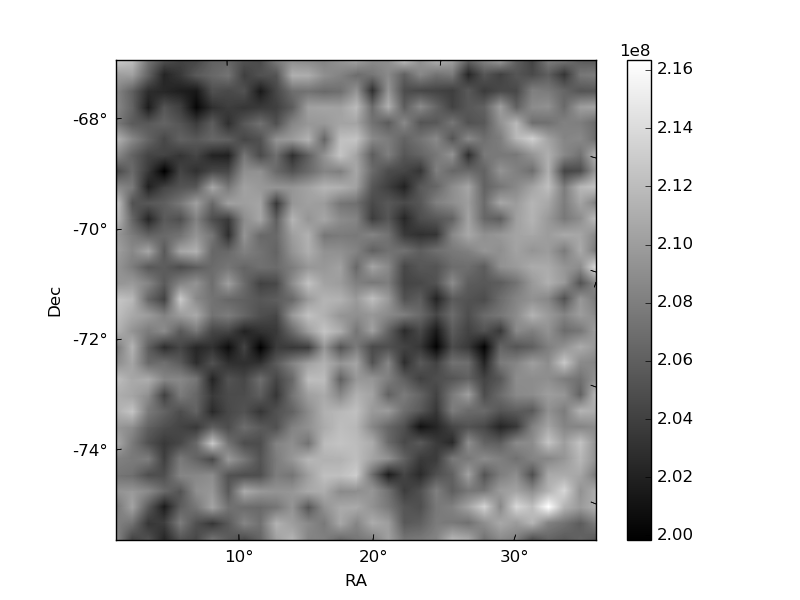
Histogram calculated using DETX and DETY for each event in the final _common_clean file
| Quadrant A | 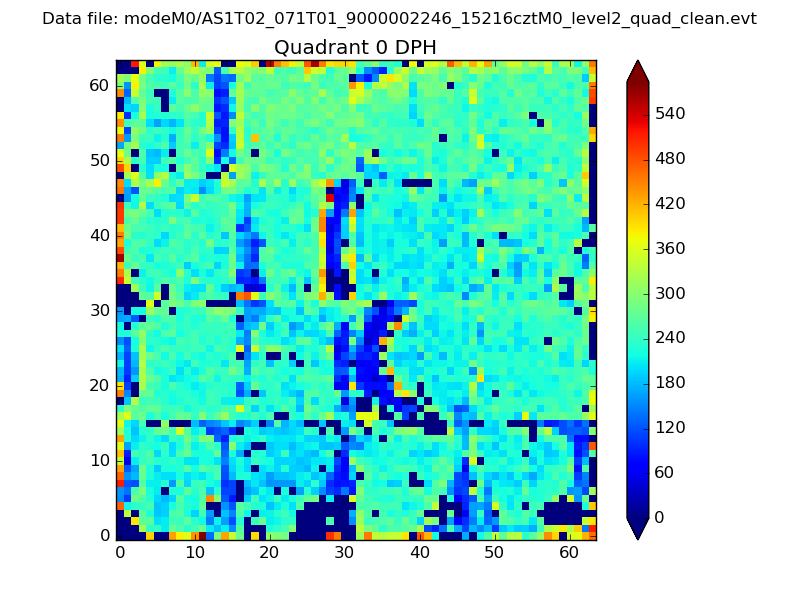 |
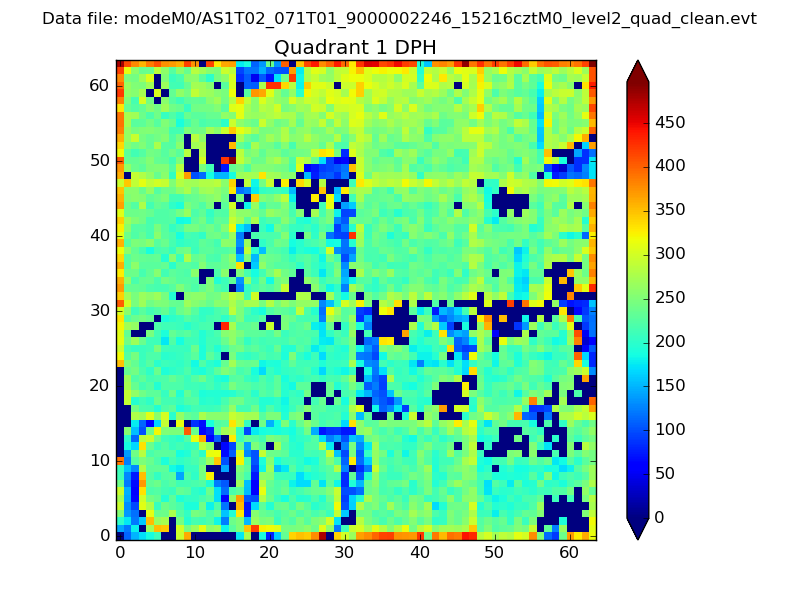 |
Quadrant B |
|---|---|---|---|
| Quadrant D | 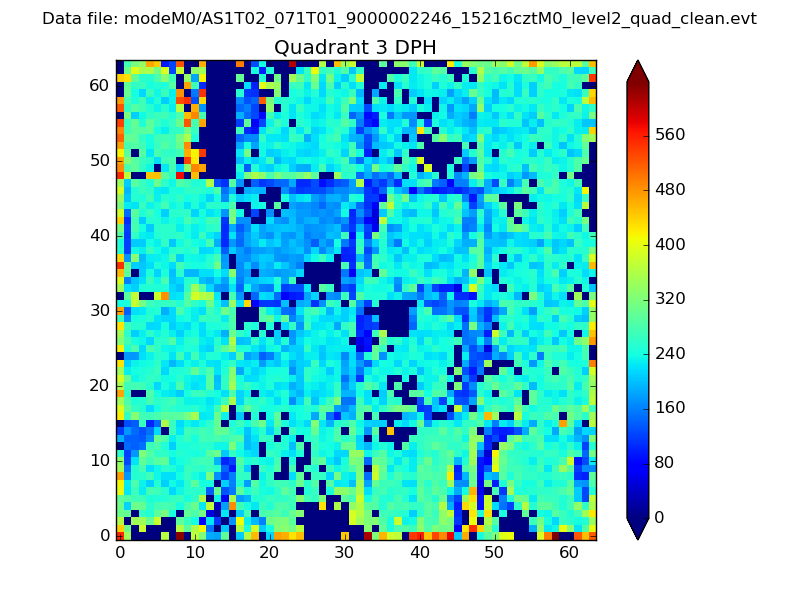 |
 |
Quadrant C |
| Plot type | Count rate plots | Images |
|---|---|---|
| Comparison with Poisson distribution Blue bars denote a histogram of data divided into 1 sec bins. Red curve is a Poisson curve with rate = median count rate of data. |
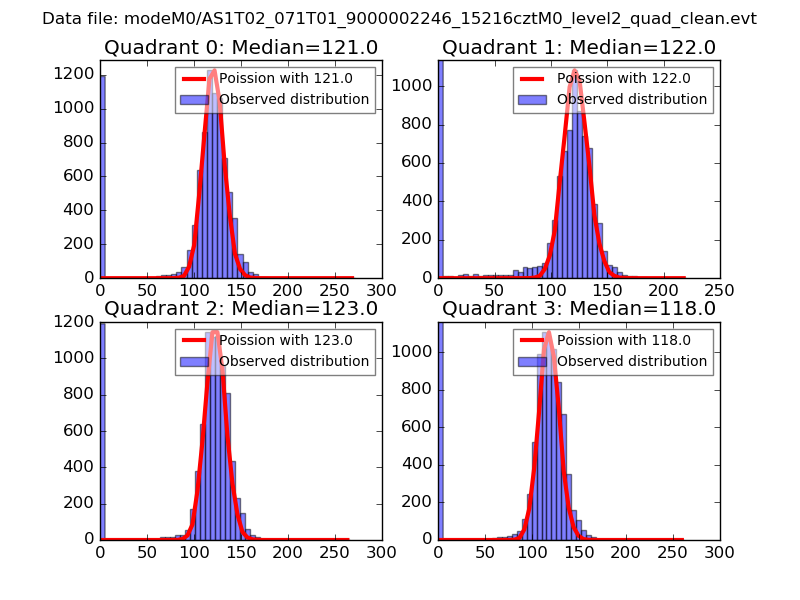 |
 |
| Quadrant-wise count rates Data is divided into 100 sec bins |
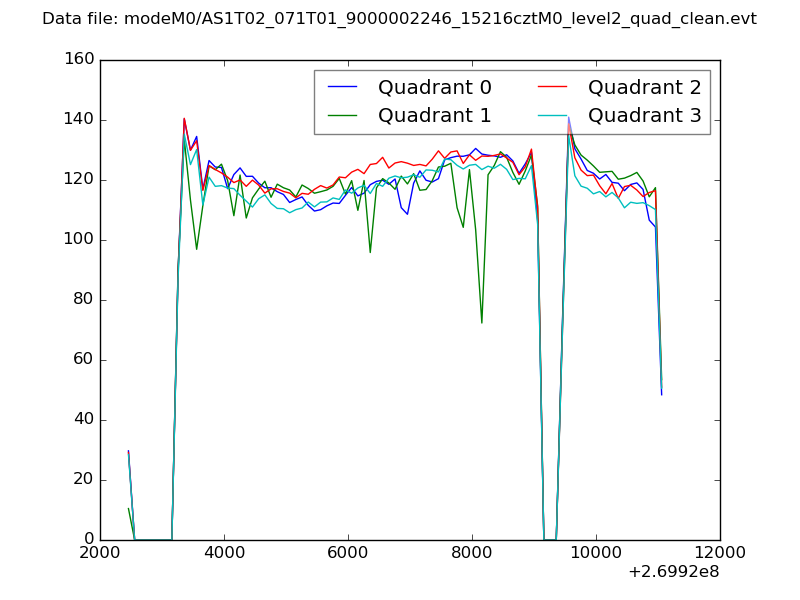 |
|
| Module-wise count rates for Quadrant A Data is divided into 100 sec bins |
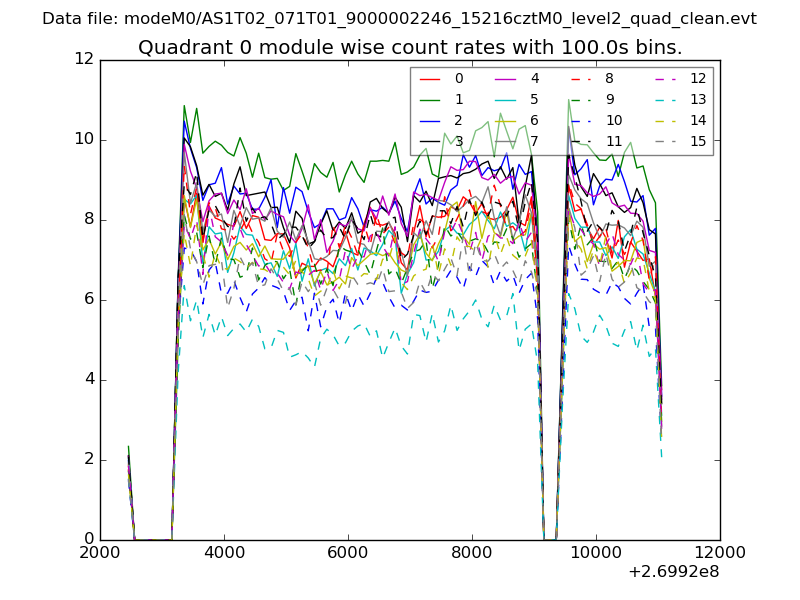 |
 |
| Module-wise count rates for Quadrant B Data is divided into 100 sec bins |
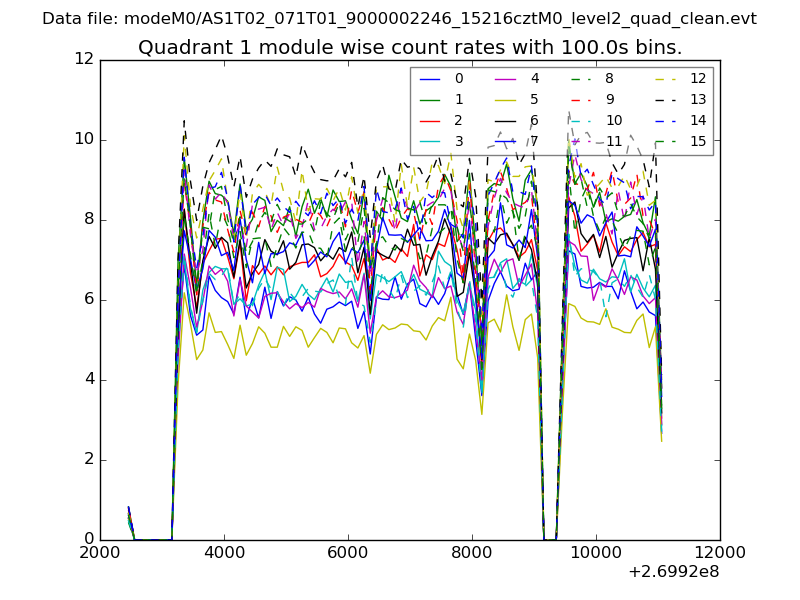 |
 |
| Module-wise count rates for Quadrant C Data is divided into 100 sec bins |
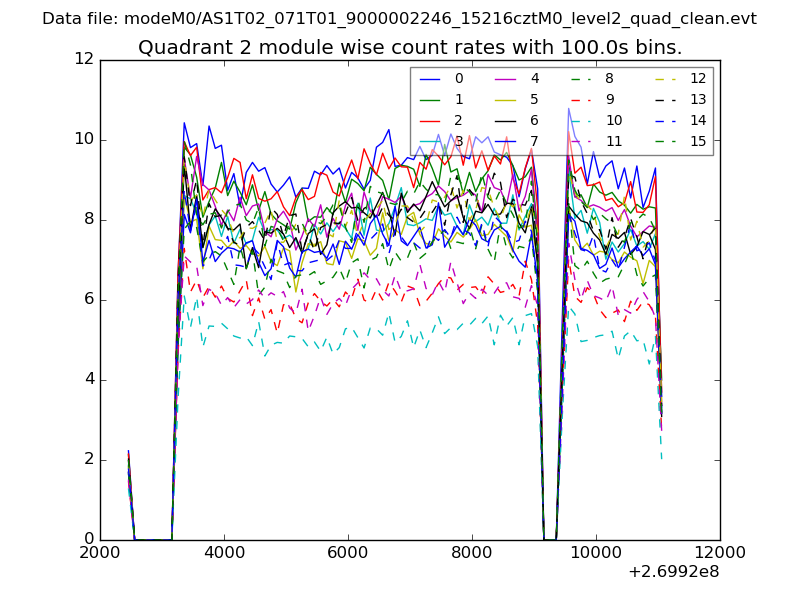 |
 |
| Module-wise count rates for Quadrant D Data is divided into 100 sec bins |
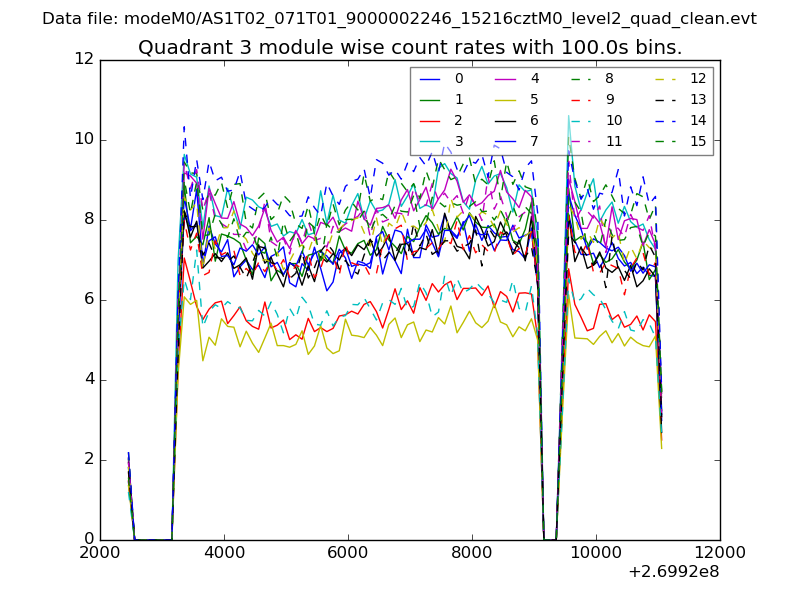 |
 |
| Parameter | Plot |
|---|---|
| CZT HV Monitor | 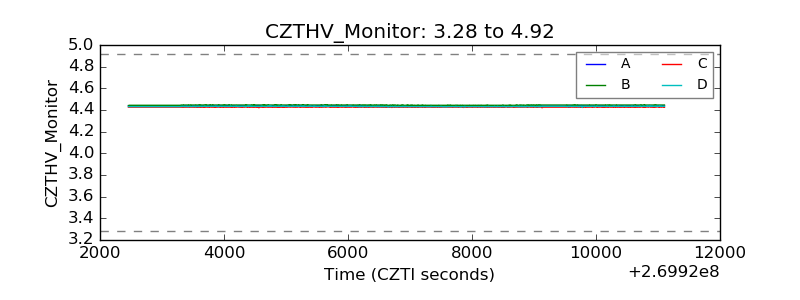 |
| D_VDD | 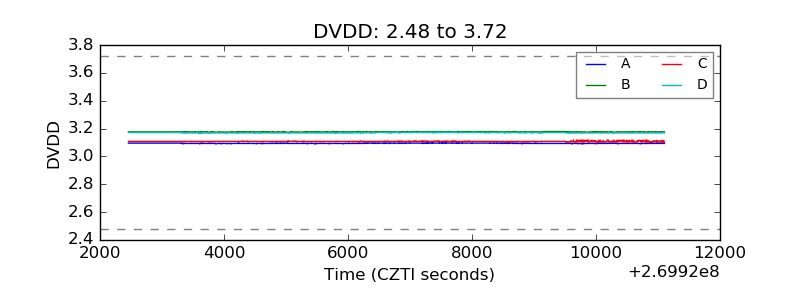 |
| Temperature 1 | 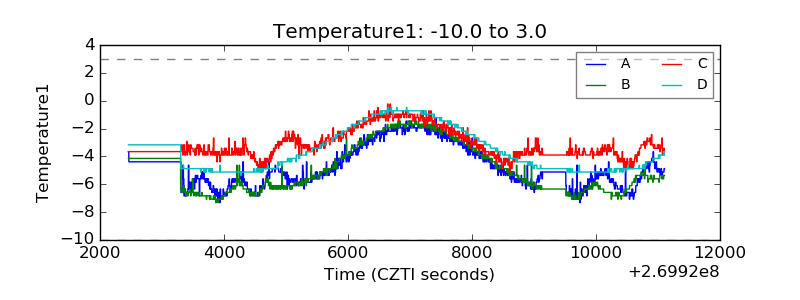 |
| Veto HV Monitor | 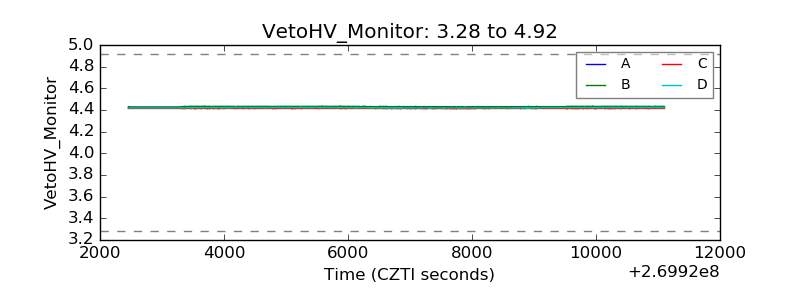 |
| Veto LLD | 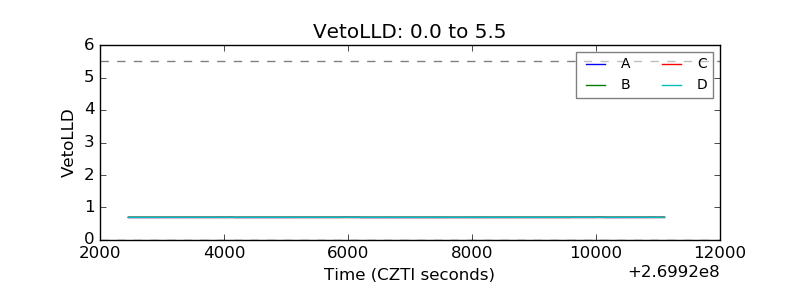 |
| Alpha Counter | 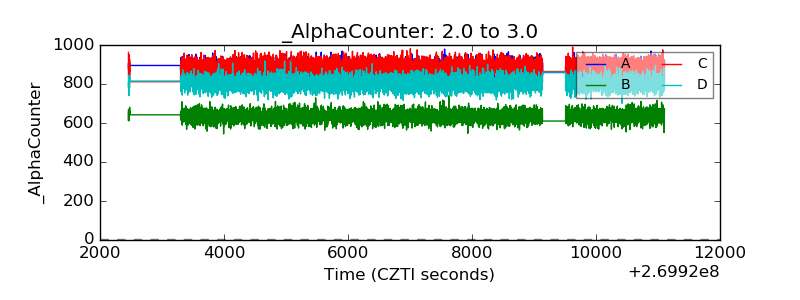 |
| _CPM_Rate | 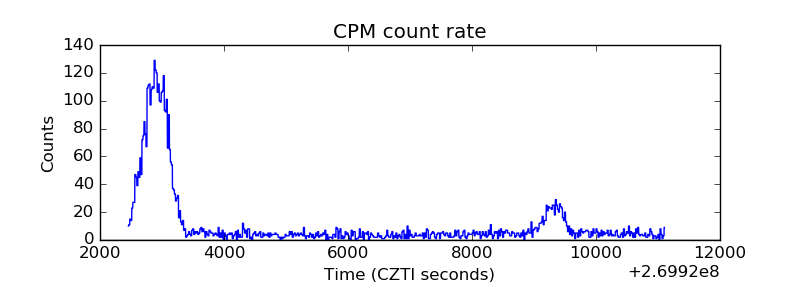 |
| CZT Counter |  |
| +2.5 Volts monitor |  |
| +5 Volts monitor |  |
| _ROLL_ROT | 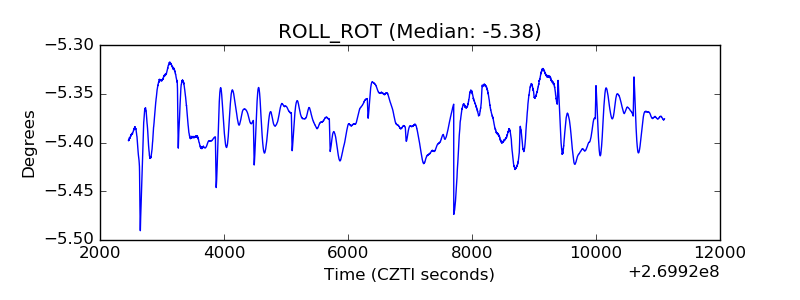 |
| _Roll_DEC | 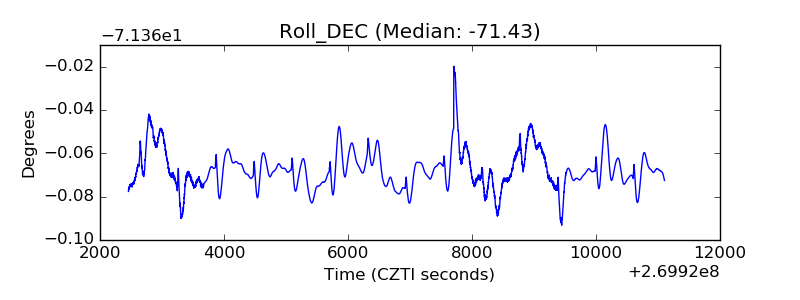 |
| _Roll_RA |  |
| Veto Counter | 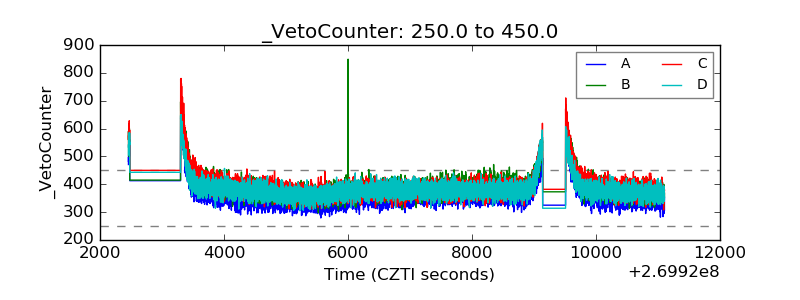 |