| Param | Original file | Final file |
|---|---|---|
| Filename | modeM0/AS1T02_071T01_9000002246_15220cztM0_level2.evt | modeM0/AS1T02_071T01_9000002246_15220cztM0_level2_quad_clean.evt |
| Size (bytes) | 1,126,126,080 | 165,666,240 |
| Size | 1.0 GB | 158.0 MB |
| Events in quadrant A | 12,927,814 | 1,054,693 |
| Events in quadrant B | 9,366,543 | 1,046,490 |
| Events in quadrant C | 6,689,783 | 1,142,225 |
| Events in quadrant D | 4,476,801 | 1,108,649 |
| Mode SS | |||
|---|---|---|---|
| Quadrant | BADHDUFLAG | Total packets | Discarded packets |
| A | 0 | 194 | 0 |
| B | 0 | 194 | 0 |
| C | 0 | 194 | 0 |
| D | 0 | 194 | 0 |
| Mode M9 | |||
|---|---|---|---|
| Quadrant | BADHDUFLAG | Total packets | Discarded packets |
| A | 0 | 3 | 0 |
| B | 0 | 3 | 0 |
| C | 0 | 3 | 0 |
| D | 0 | 3 | 0 |
| Mode M0 | |||
|---|---|---|---|
| Quadrant | BADHDUFLAG | Total packets | Discarded packets |
| A | 0 | 45126 | 1 |
| B | 0 | 34352 | 1 |
| C | 0 | 26568 | 1 |
| D | 0 | 20355 | 1 |
| Quadrant | Total seconds | Saturated seconds | Saturation percentage |
|---|---|---|---|
| A | 9578 | 1498 | 15.640008% |
| B | 9578 | 1735 | 18.114429% |
| C | 9578 | 182 | 1.900188% |
| D | 9578 | 154 | 1.607851% |
Noise dominated data is calculated using 1-second bins in cleaned event files. If a bin has >2000 counts, and if more than 50% of those come from <1% of pixels, then it is considered to be noise-dominated and hence unusable.
| Quadrant | # 1 sec bins | Bins with >0 counts | Bins with >2000 counts | High rate bins dominated by noise | Noise dominated (total time) | Noise dominated (detector-on time) | Marked lightcurve |
|---|---|---|---|---|---|---|---|
| A | 9864 | 9579 | 986 | 986 | 10.00% | 10.29% | 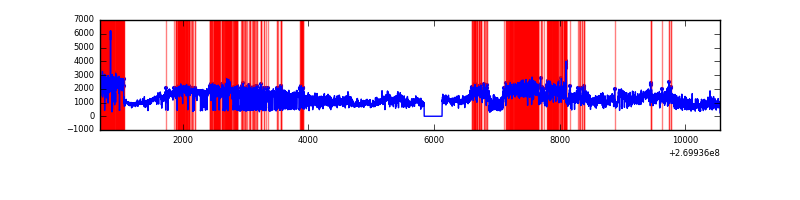 |
| B | 9864 | 9579 | 1222 | 1222 | 12.39% | 12.76% | 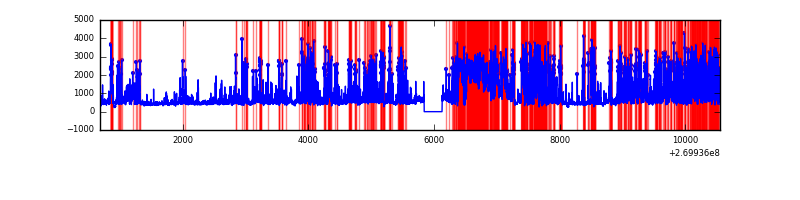 |
| C | 9864 | 9580 | 41 | 41 | 0.42% | 0.43% | 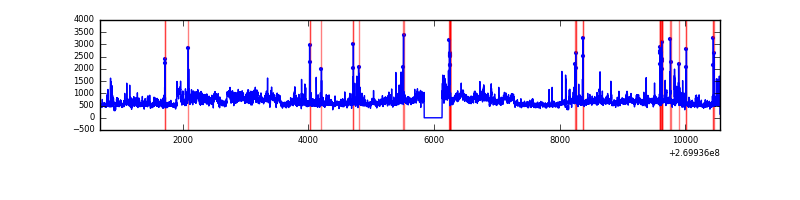 |
| D | 9864 | 9579 | 61 | 61 | 0.62% | 0.64% | 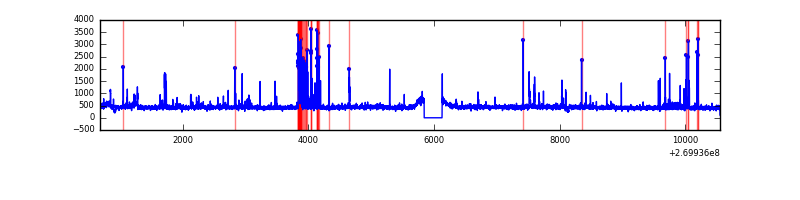 |
Top three noisy pixels from each quadrant. If the there are fewer than three noisy pixels in the level2.evt file, extra rows are filled as -1
| Pixel properties | Quadrant properties | ||||||
|---|---|---|---|---|---|---|---|
| Quadrant | DetID | PixID | Counts | Sigma | Mean | Median | Sigma |
| A | 0 | 253 | 8409967 | 39208.78 | 1053 | 1028 | 214.5 |
| A | 12 | 189 | 426518 | 1983.95 | 1053 | 1028 | 214.5 |
| A | 13 | 248 | 20680 | 91.63 | 1053 | 1028 | 214.5 |
| B | 3 | 112 | 4353233 | 22818.13 | 1009 | 982 | 190.7 |
| B | 3 | 64 | 344250 | 1799.69 | 1009 | 982 | 190.7 |
| B | 0 | 245 | 321306 | 1679.4 | 1009 | 982 | 190.7 |
| C | 3 | 233 | 2135723 | 8813.36 | 1056 | 1061 | 242.2 |
| C | 4 | 254 | 389107 | 1602.12 | 1056 | 1061 | 242.2 |
| C | 7 | 247 | 21802 | 85.63 | 1056 | 1061 | 242.2 |
| D | 7 | 38 | 245997 | 952.4 | 1061 | 1030 | 257.2 |
| D | 2 | 33 | 90098 | 346.29 | 1061 | 1030 | 257.2 |
| D | 2 | 234 | 39363 | 149.03 | 1061 | 1030 | 257.2 |
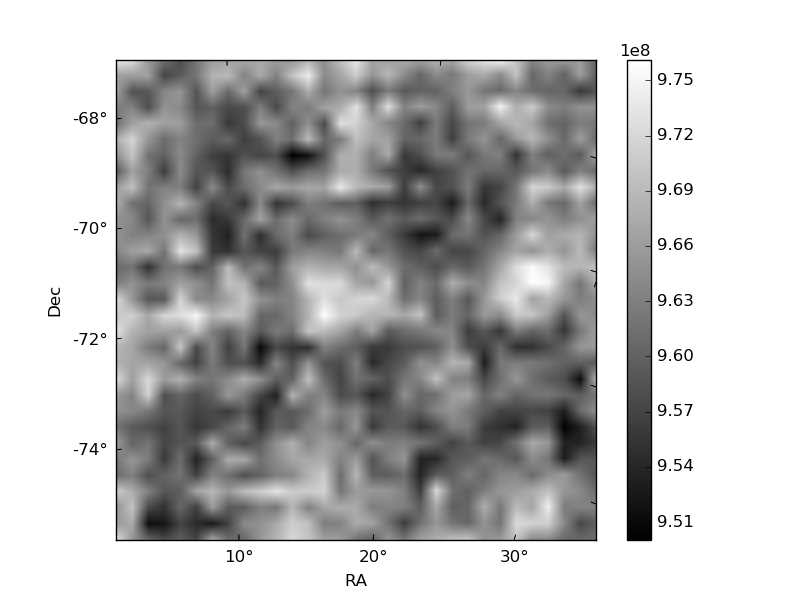
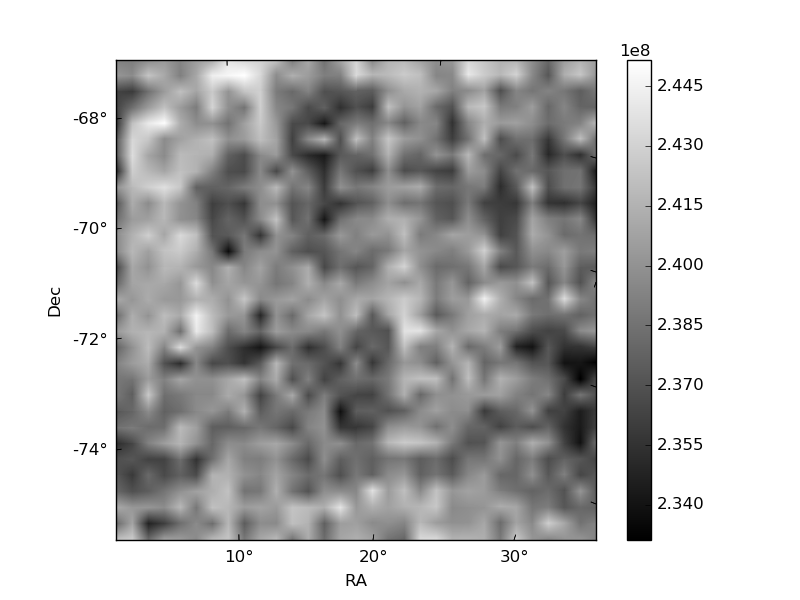
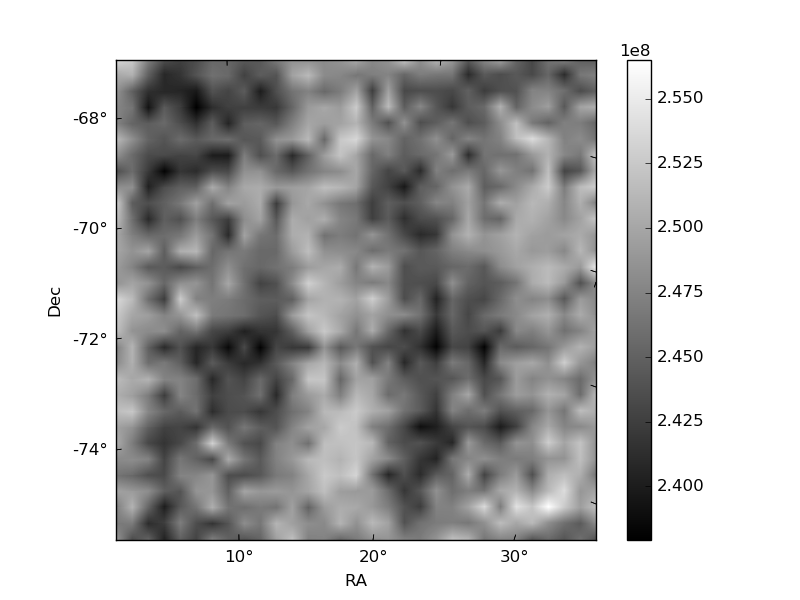
Histogram calculated using DETX and DETY for each event in the final _common_clean file
| Quadrant A | 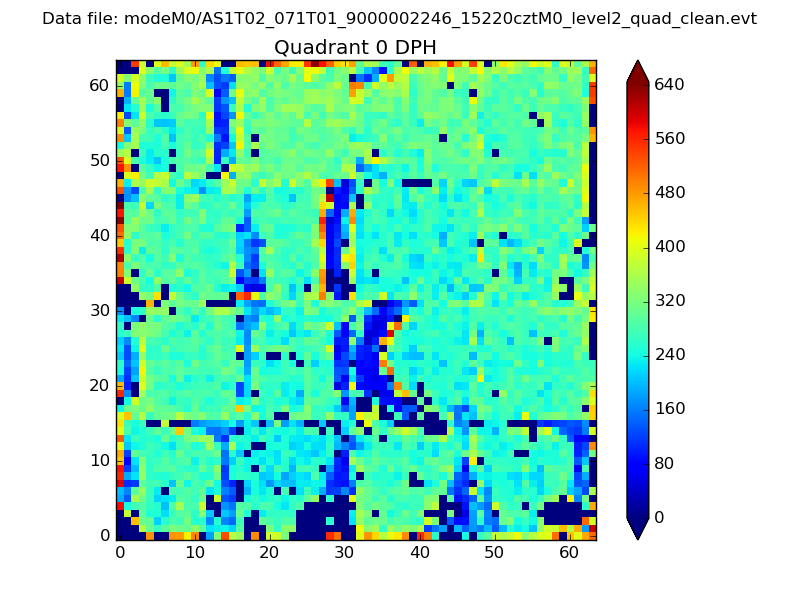 |
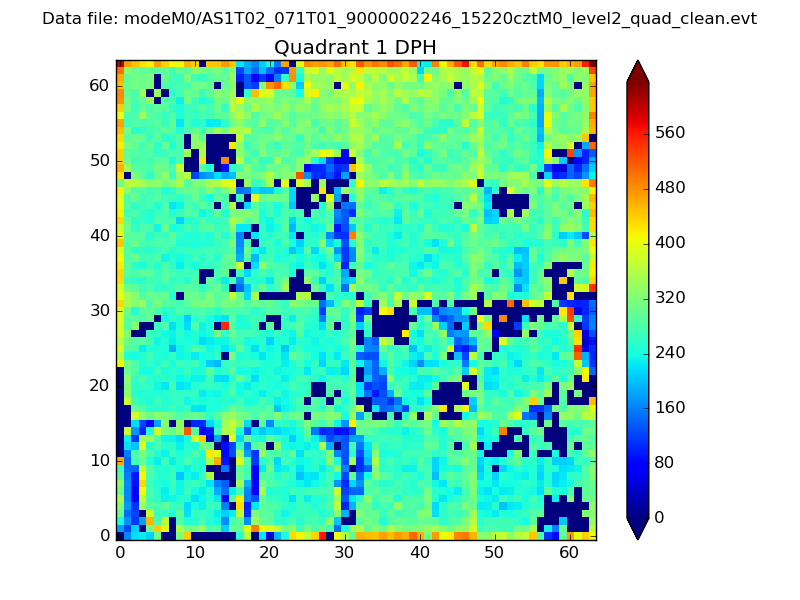 |
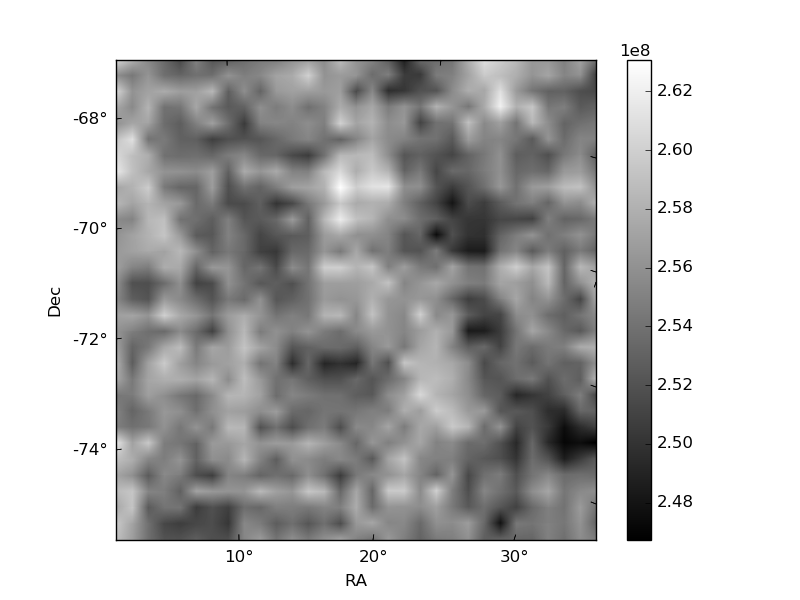
Quadrant B |
|---|---|---|---|
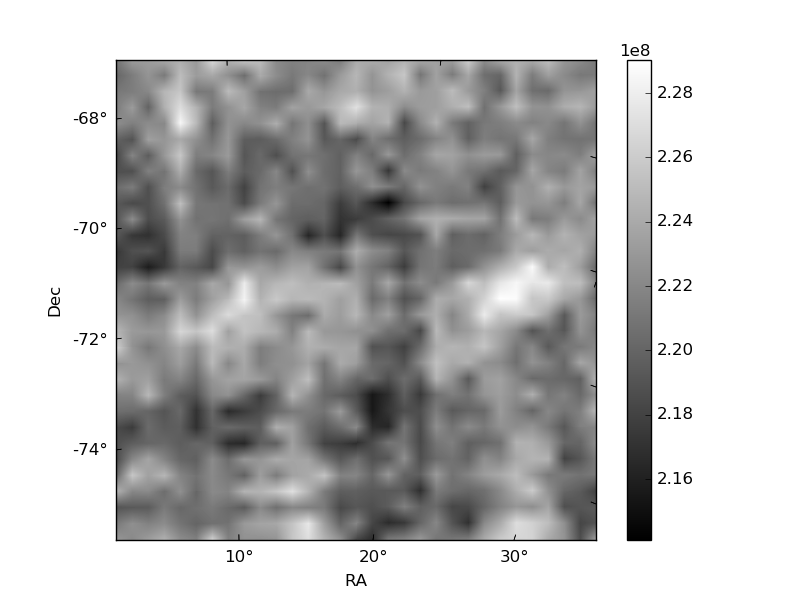
| Quadrant D | 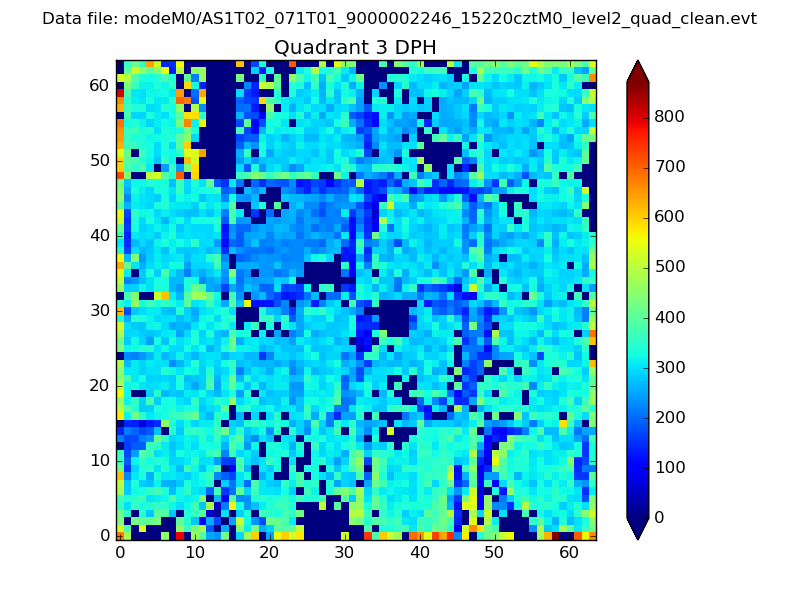 |
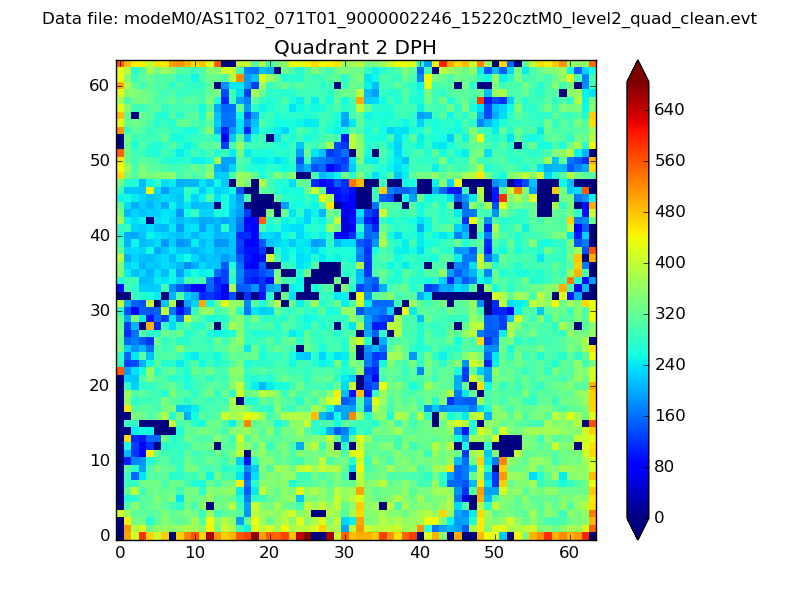 |
Quadrant C |
| Plot type | Count rate plots | Images |
|---|---|---|
| Comparison with Poisson distribution Blue bars denote a histogram of data divided into 1 sec bins. Red curve is a Poisson curve with rate = median count rate of data. |
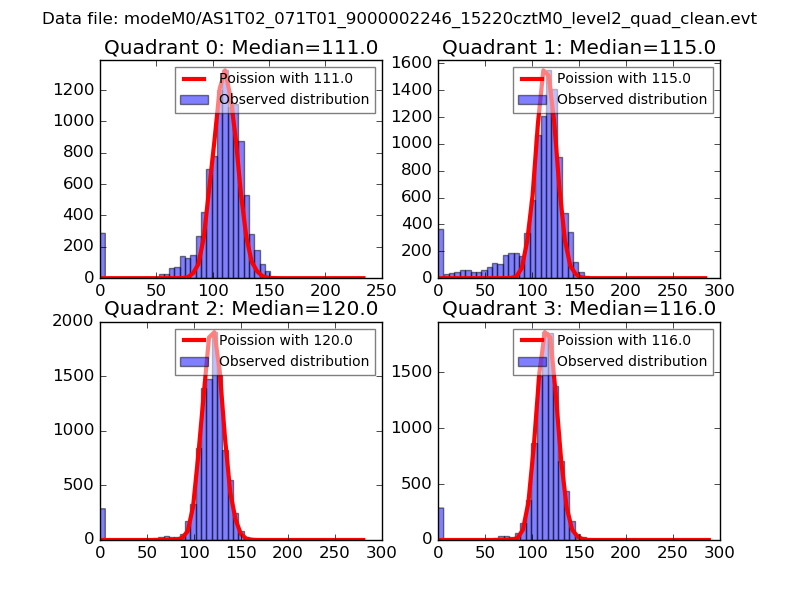 |
 |
| Quadrant-wise count rates Data is divided into 100 sec bins |
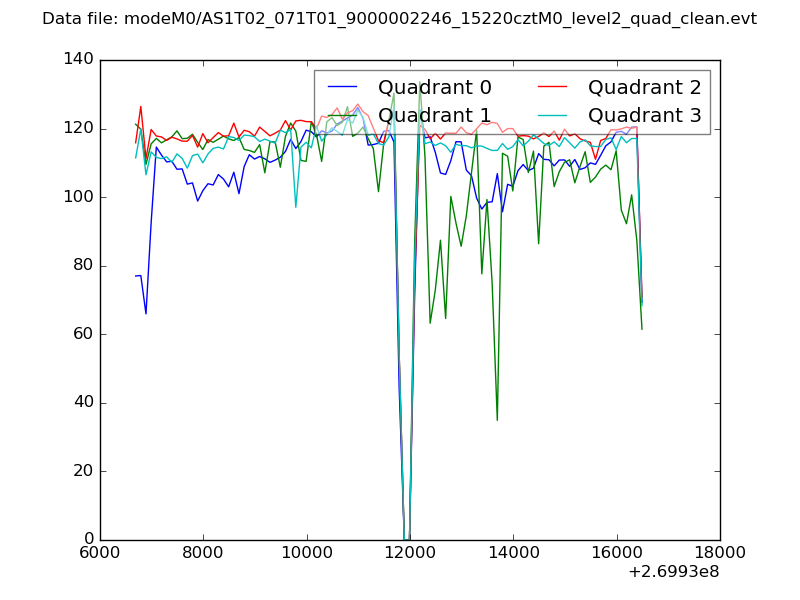 |
|
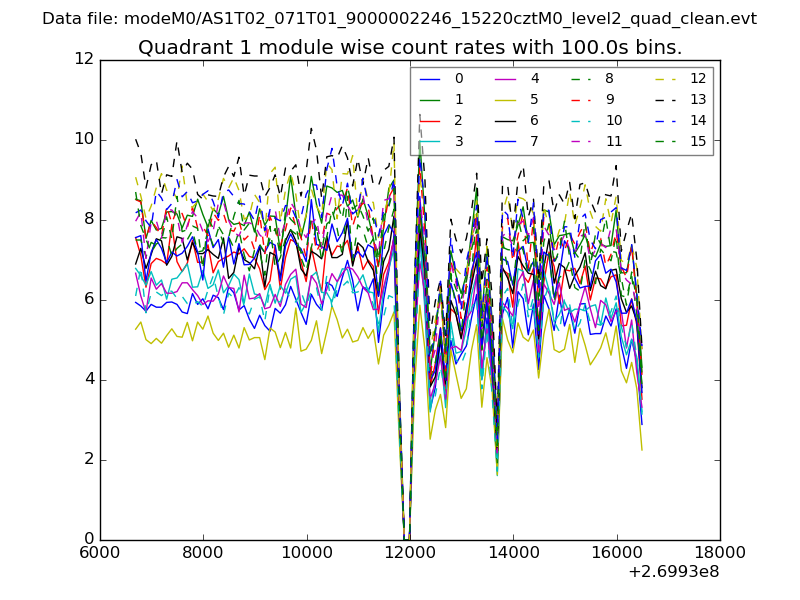
| Module-wise count rates for Quadrant A Data is divided into 100 sec bins |
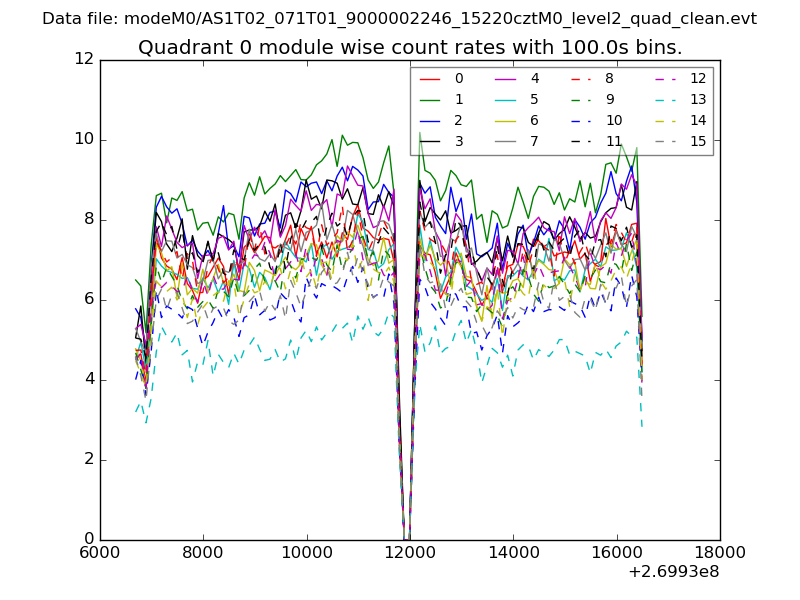 |
 |
| Module-wise count rates for Quadrant B Data is divided into 100 sec bins |
 |
 |
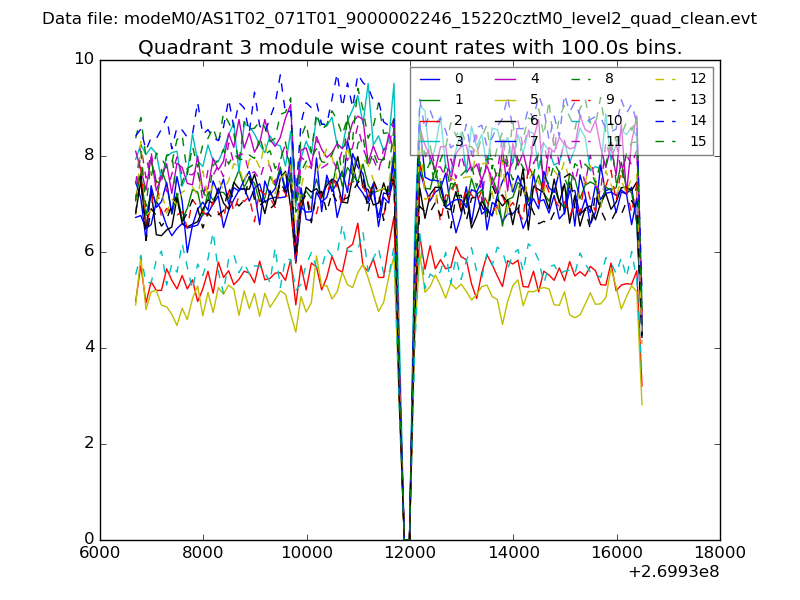
| Module-wise count rates for Quadrant C Data is divided into 100 sec bins |
 |
 |
| Module-wise count rates for Quadrant D Data is divided into 100 sec bins |
 |
 |
| Parameter | Plot |
|---|---|
| CZT HV Monitor |  |
| D_VDD | 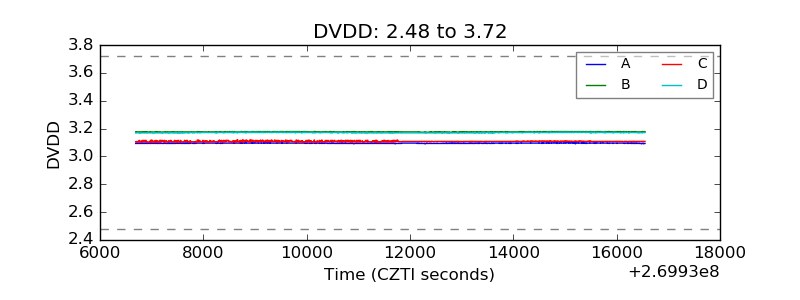 |
| Temperature 1 | 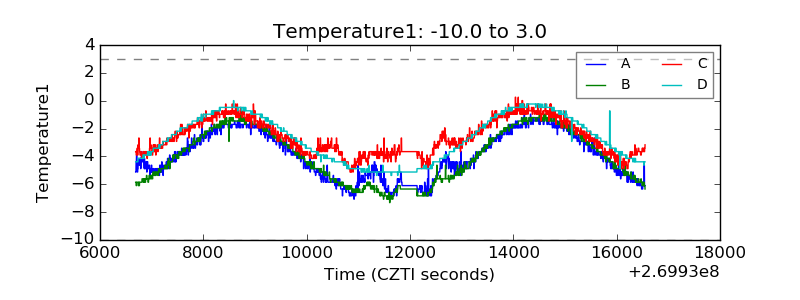 |
| Veto HV Monitor | 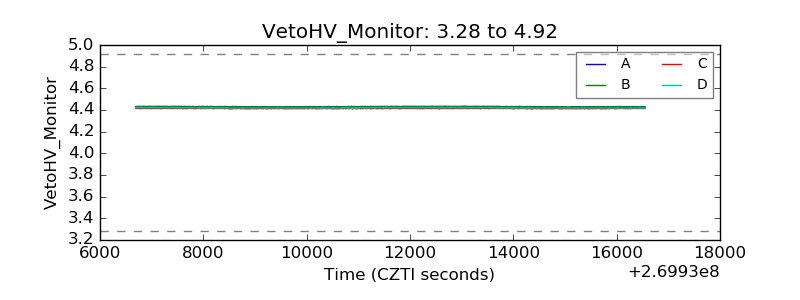 |
| Veto LLD | 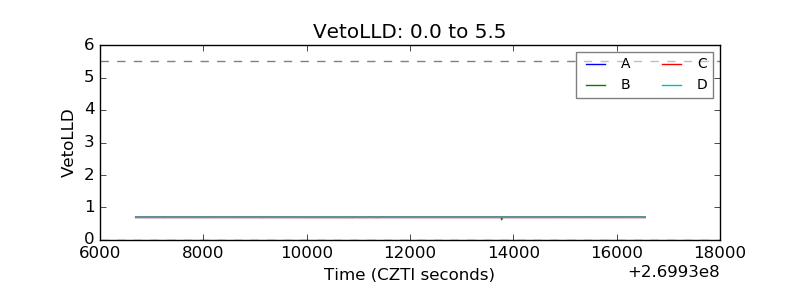 |
| Alpha Counter | 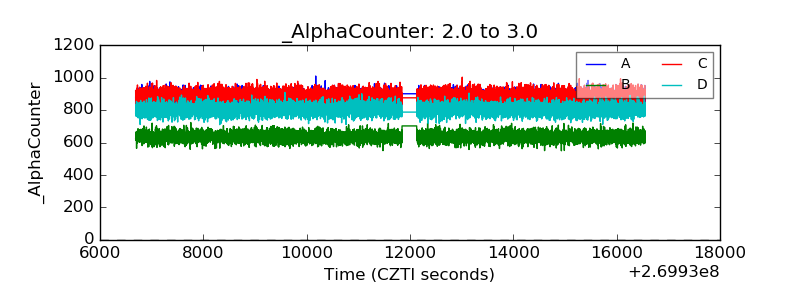 |
| _CPM_Rate | 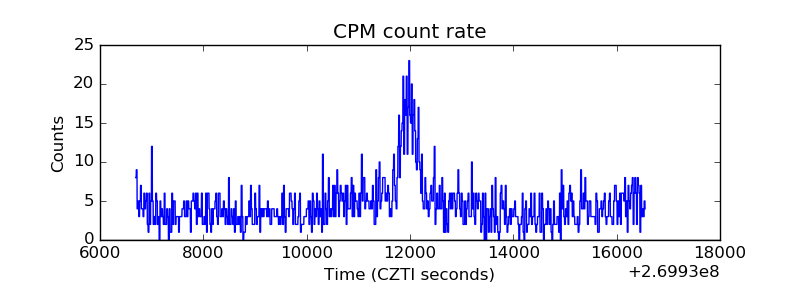 |
| CZT Counter | 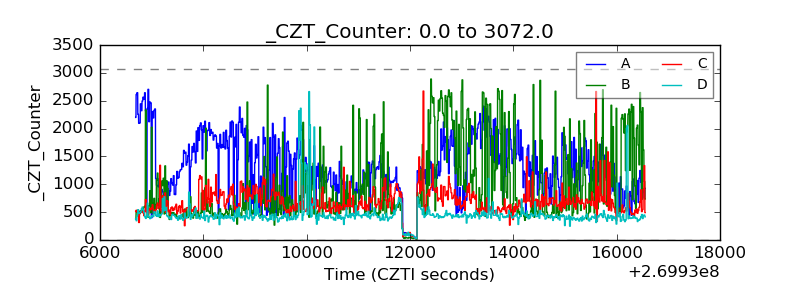 |
| +2.5 Volts monitor |  |
| +5 Volts monitor |  |
| _ROLL_ROT | 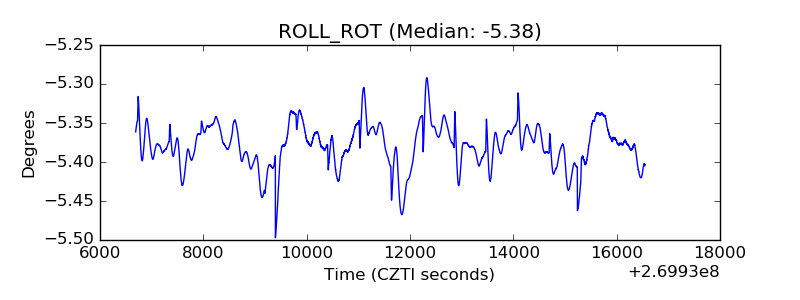 |
| _Roll_DEC | 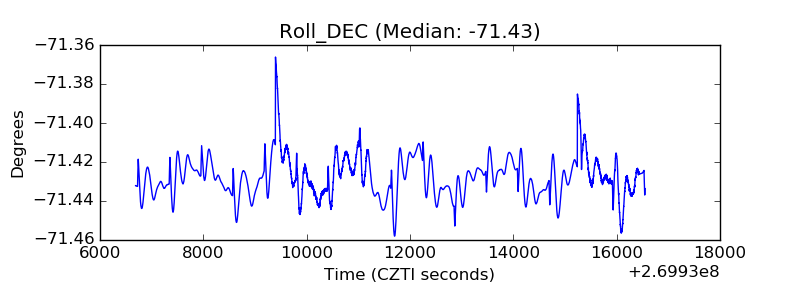 |
| _Roll_RA | 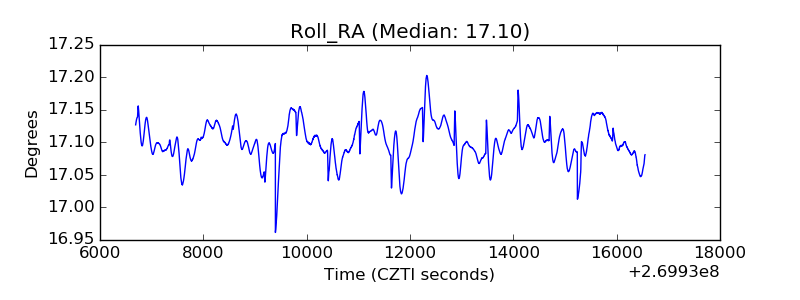 |
| Veto Counter | 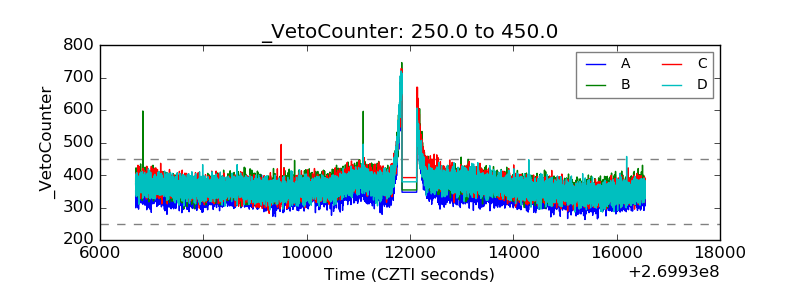 |