| Param | Original file | Final file |
|---|---|---|
| Filename | modeM0/AS1A04_105T01_9000002248_15221cztM0_level2.evt | modeM0/AS1A04_105T01_9000002248_15221cztM0_level2_quad_clean.evt |
| Size (bytes) | 1,433,352,960 | 147,113,280 |
| Size | 1.3 GB | 140.3 MB |
| Events in quadrant A | 17,364,548 | 892,869 |
| Events in quadrant B | 12,230,189 | 872,046 |
| Events in quadrant C | 7,850,042 | 973,240 |
| Events in quadrant D | 5,231,979 | 959,779 |
| Mode M9 | |||
|---|---|---|---|
| Quadrant | BADHDUFLAG | Total packets | Discarded packets |
| A | 0 | 14 | 0 |
| B | 0 | 14 | 0 |
| C | 0 | 14 | 0 |
| D | 0 | 14 | 0 |
| Mode SS | |||
|---|---|---|---|
| Quadrant | BADHDUFLAG | Total packets | Discarded packets |
| A | 0 | 226 | 0 |
| B | 0 | 226 | 0 |
| C | 0 | 226 | 0 |
| D | 0 | 226 | 0 |
| Mode M0 | |||
|---|---|---|---|
| Quadrant | BADHDUFLAG | Total packets | Discarded packets |
| A | 0 | 59199 | 3 |
| B | 0 | 43684 | 2 |
| C | 0 | 30543 | 2 |
| D | 0 | 22951 | 2 |
| Quadrant | Total seconds | Saturated seconds | Saturation percentage |
|---|---|---|---|
| A | 10901 | 3476 | 31.886983% |
| B | 10901 | 2524 | 23.153839% |
| C | 10901 | 533 | 4.889460% |
| D | 10901 | 132 | 1.210898% |
Noise dominated data is calculated using 1-second bins in cleaned event files. If a bin has >2000 counts, and if more than 50% of those come from <1% of pixels, then it is considered to be noise-dominated and hence unusable.
| Quadrant | # 1 sec bins | Bins with >0 counts | Bins with >2000 counts | High rate bins dominated by noise | Noise dominated (total time) | Noise dominated (detector-on time) | Marked lightcurve |
|---|---|---|---|---|---|---|---|
| A | 12437 | 10902 | 2523 | 2523 | 20.29% | 23.14% | 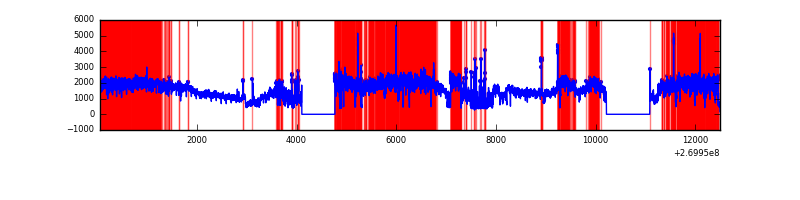 |
| B | 12436 | 10901 | 1906 | 1906 | 15.33% | 17.48% | 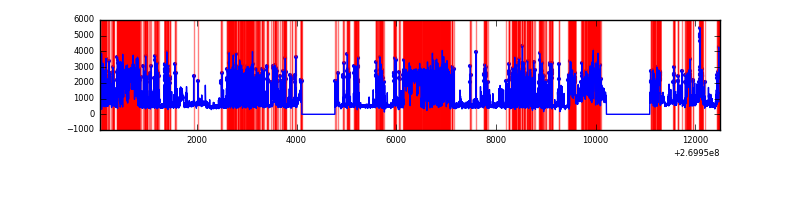 |
| C | 12437 | 10902 | 366 | 366 | 2.94% | 3.36% | 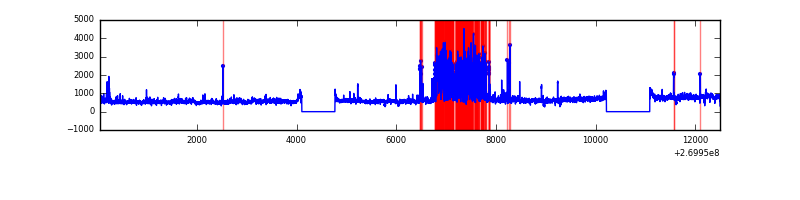 |
| D | 12437 | 10903 | 49 | 49 | 0.39% | 0.45% | 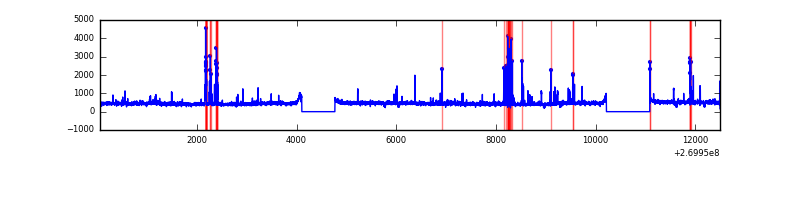 |
Top three noisy pixels from each quadrant. If the there are fewer than three noisy pixels in the level2.evt file, extra rows are filled as -1
| Pixel properties | Quadrant properties | ||||||
|---|---|---|---|---|---|---|---|
| Quadrant | DetID | PixID | Counts | Sigma | Mean | Median | Sigma |
| A | 0 | 253 | 12352734 | 49726.86 | 1233 | 1205 | 248.4 |
| A | 12 | 189 | 162365 | 648.82 | 1233 | 1205 | 248.4 |
| A | 15 | 239 | 72666 | 287.7 | 1233 | 1205 | 248.4 |
| B | 3 | 112 | 6984292 | 31357.87 | 1165 | 1136 | 222.7 |
| B | 3 | 64 | 342270 | 1531.86 | 1165 | 1136 | 222.7 |
| B | 0 | 245 | 98967 | 439.31 | 1165 | 1136 | 222.7 |
| C | 3 | 233 | 1761355 | 6125.37 | 1243 | 1248 | 287.3 |
| C | 4 | 254 | 1198094 | 4165.16 | 1243 | 1248 | 287.3 |
| C | 7 | 247 | 20118 | 65.67 | 1243 | 1248 | 287.3 |
| D | 7 | 38 | 210434 | 678.55 | 1265 | 1228 | 308.3 |
| D | 2 | 16 | 78413 | 250.35 | 1265 | 1228 | 308.3 |
| D | 2 | 234 | 40357 | 126.91 | 1265 | 1228 | 308.3 |
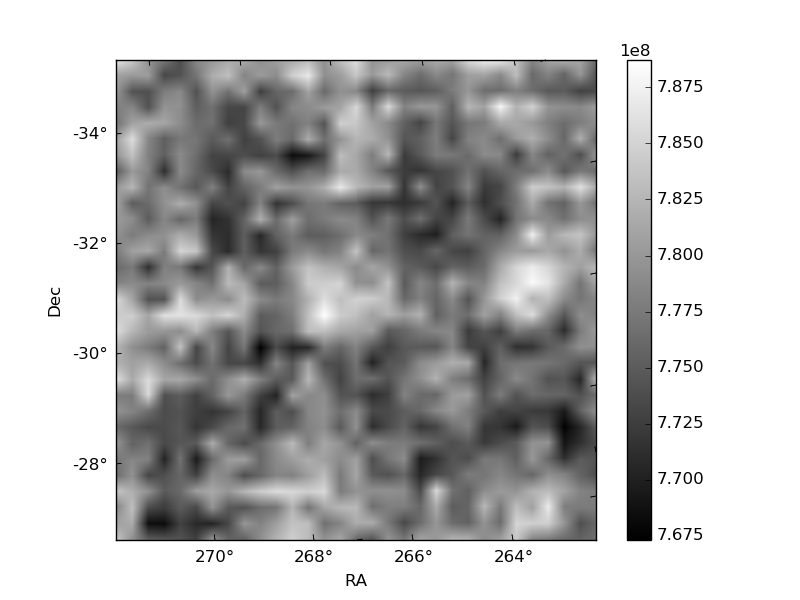
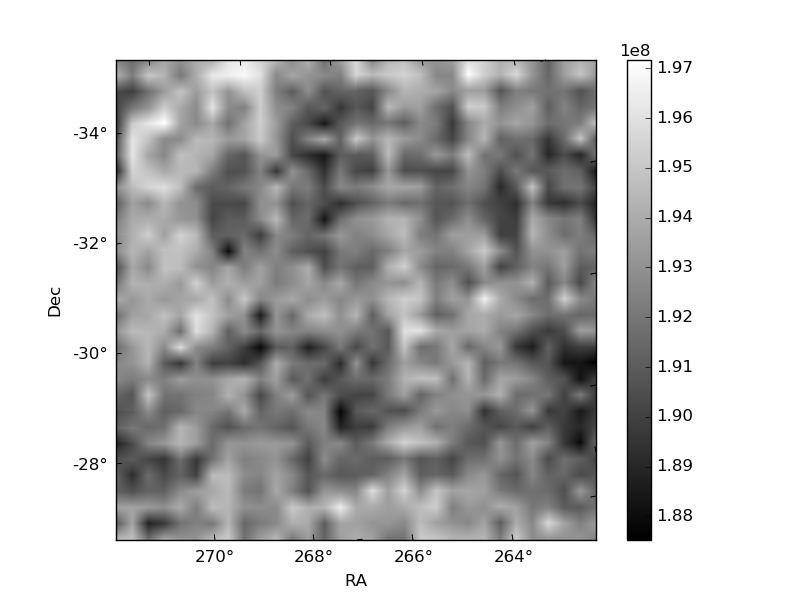
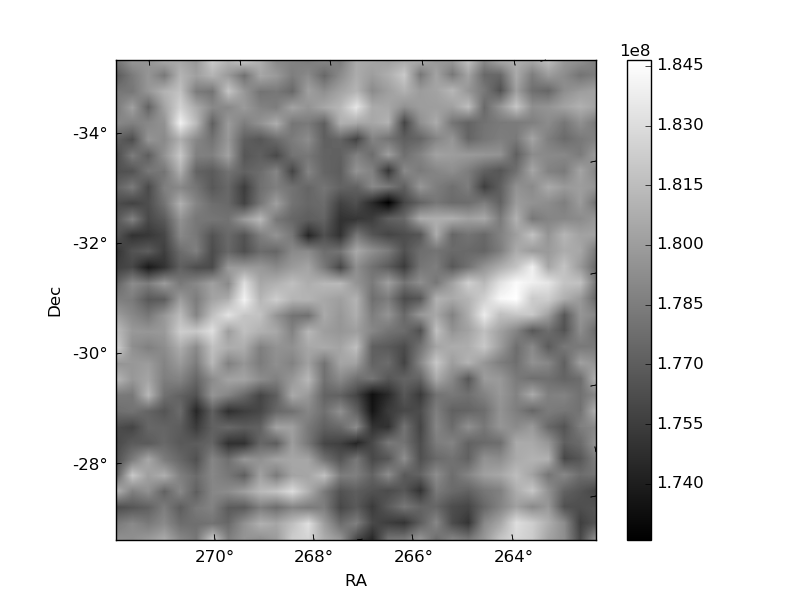
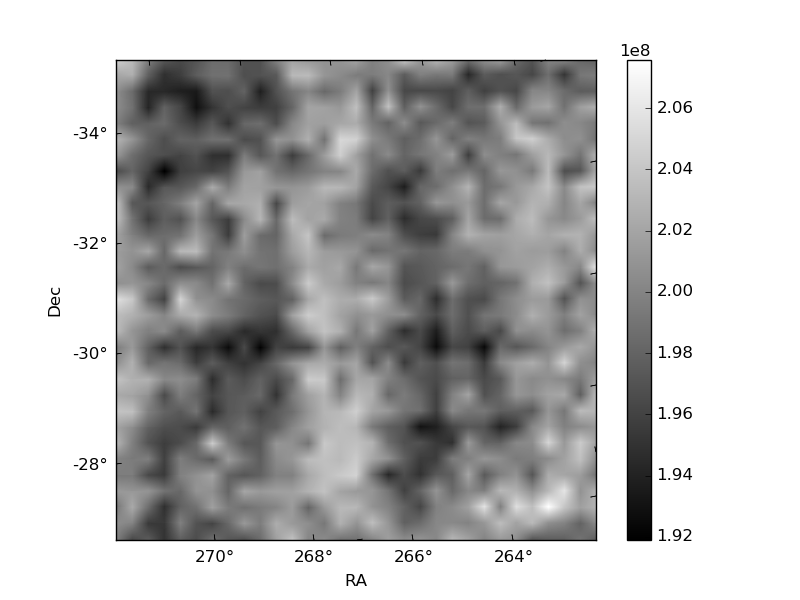
Histogram calculated using DETX and DETY for each event in the final _common_clean file
| Quadrant A | 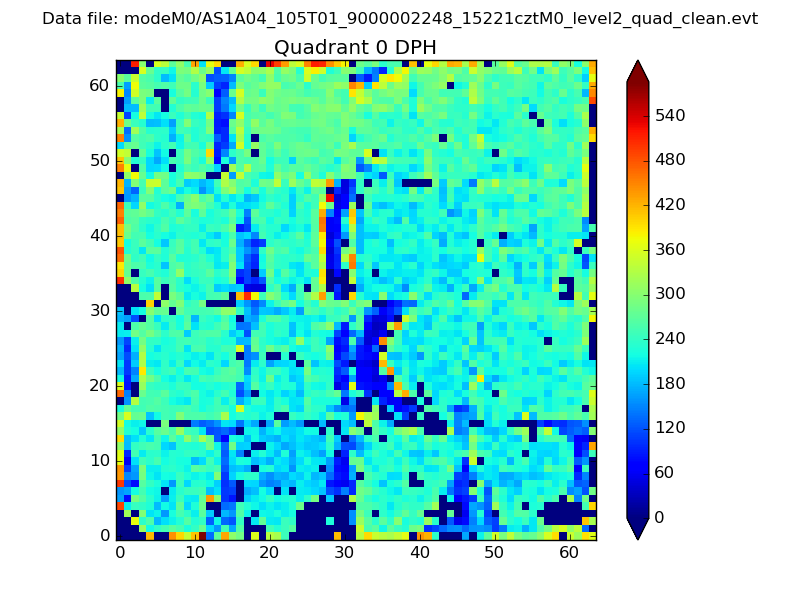 |
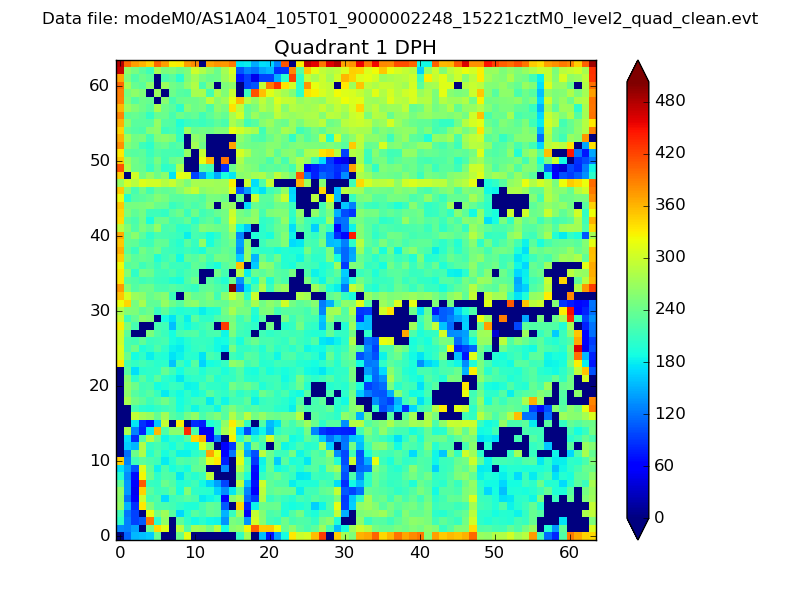 |
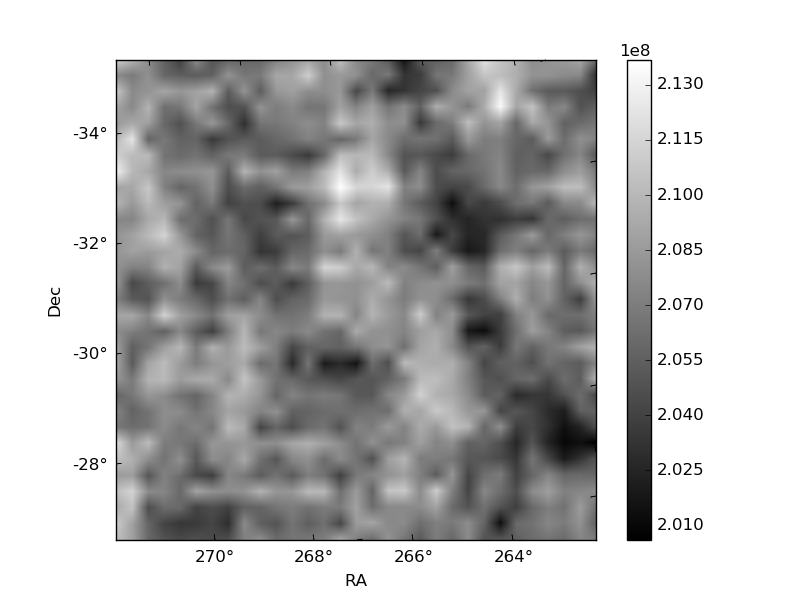
Quadrant B |
|---|---|---|---|
| Quadrant D | 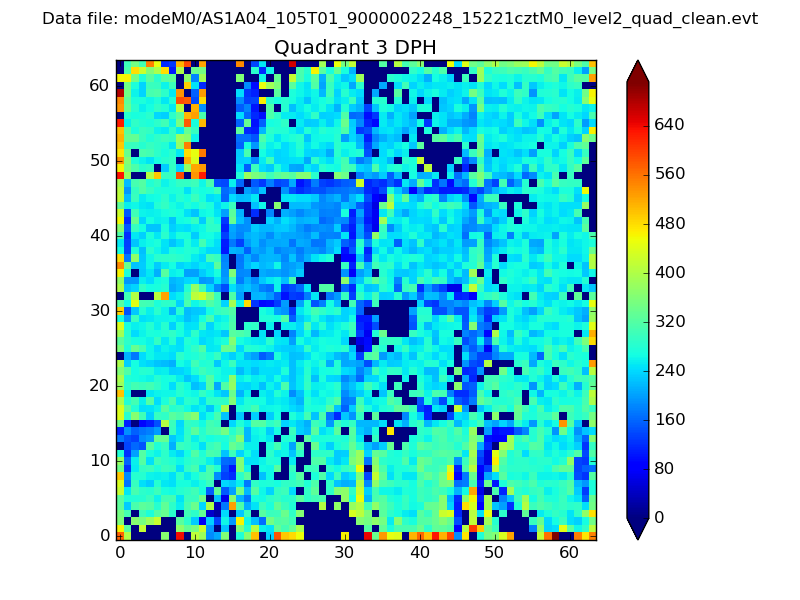 |
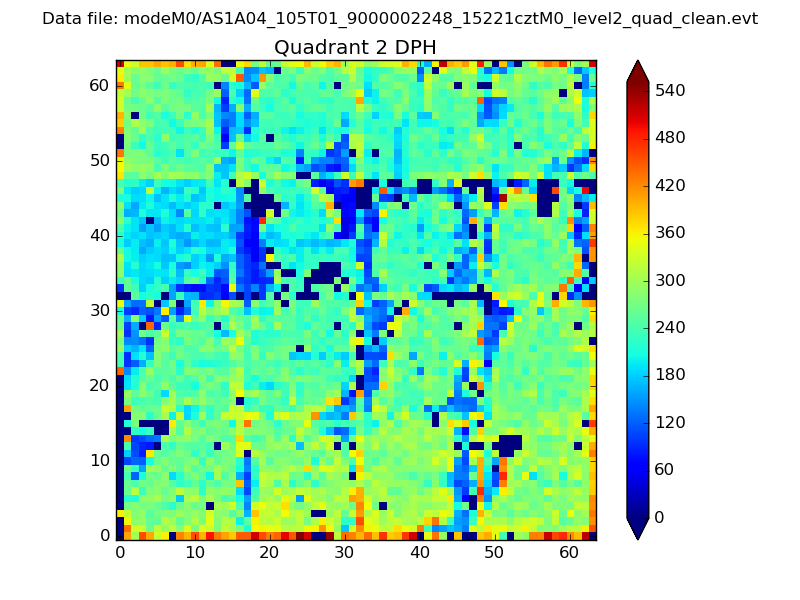 |
Quadrant C |
| Plot type | Count rate plots | Images |
|---|---|---|
| Comparison with Poisson distribution Blue bars denote a histogram of data divided into 1 sec bins. Red curve is a Poisson curve with rate = median count rate of data. |
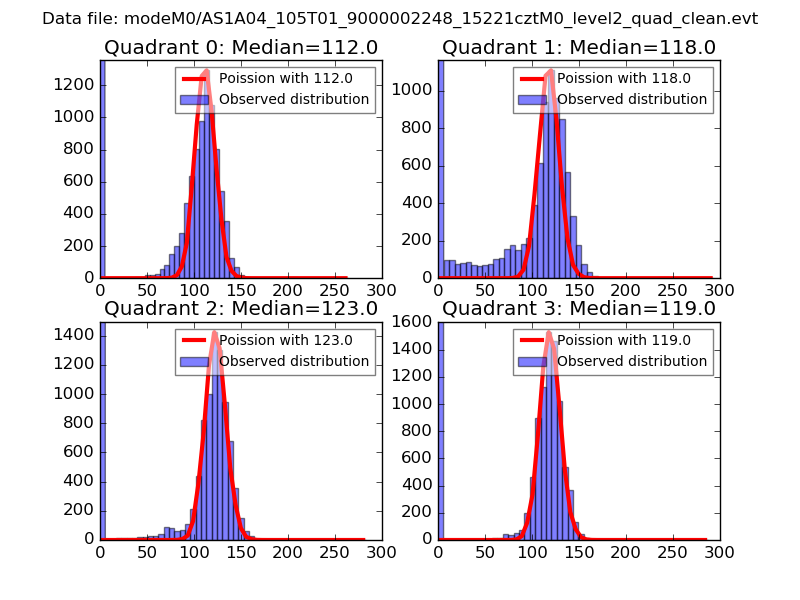 |
 |
| Quadrant-wise count rates Data is divided into 100 sec bins |
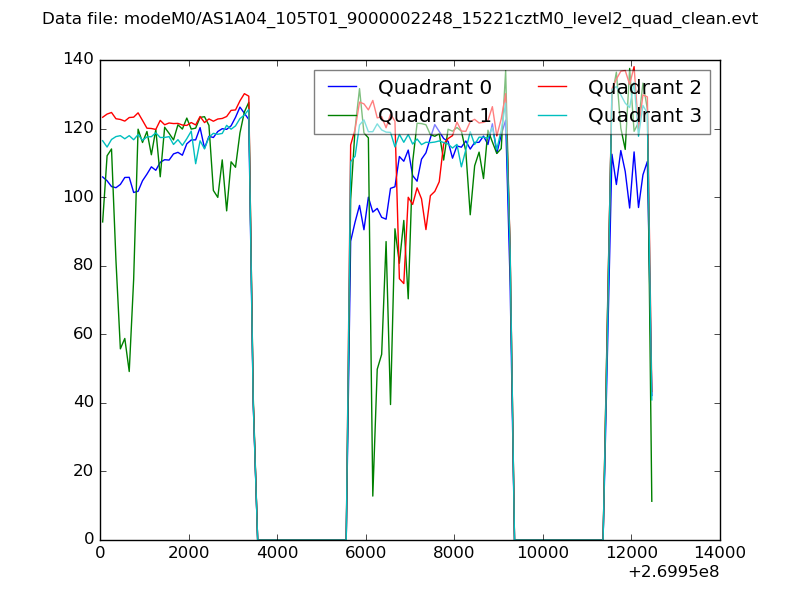 |
|
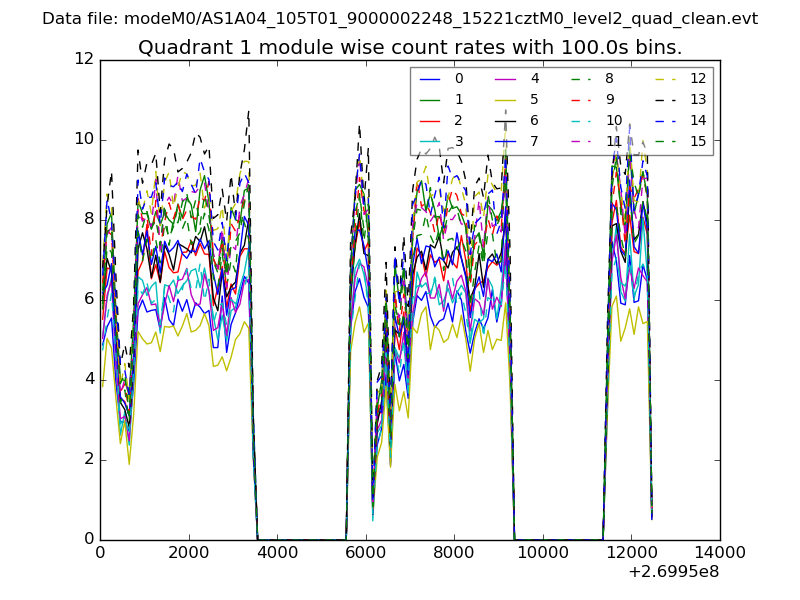
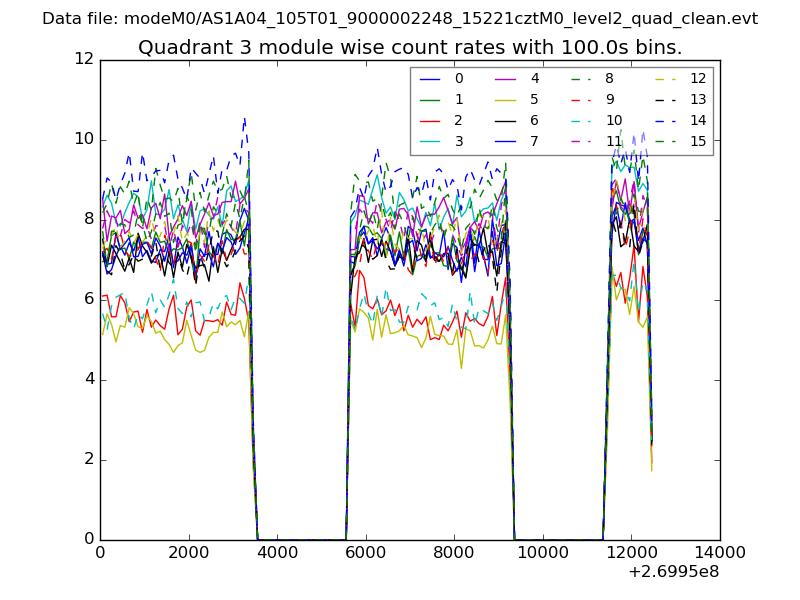
| Module-wise count rates for Quadrant A Data is divided into 100 sec bins |
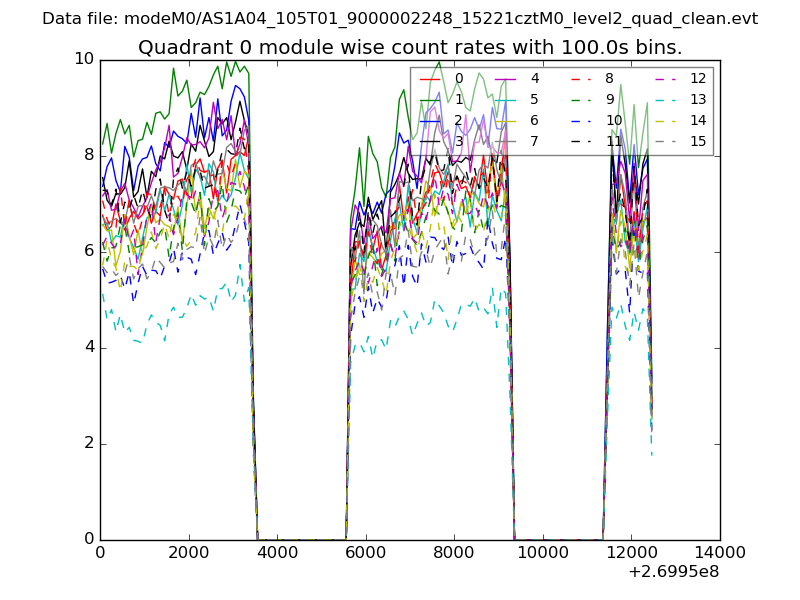 |
 |
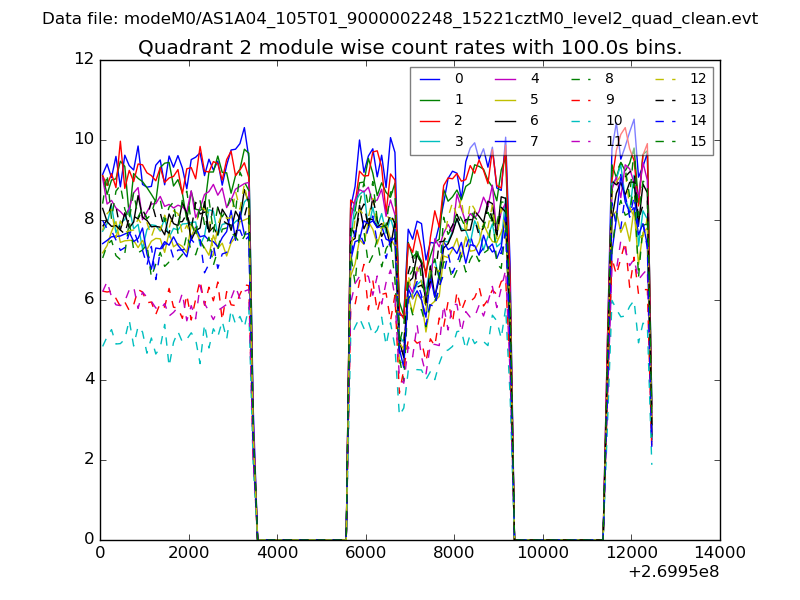
| Module-wise count rates for Quadrant B Data is divided into 100 sec bins |
 |
 |
| Module-wise count rates for Quadrant C Data is divided into 100 sec bins |
 |
 |
| Module-wise count rates for Quadrant D Data is divided into 100 sec bins |
 |
 |
| Parameter | Plot |
|---|---|
| CZT HV Monitor | 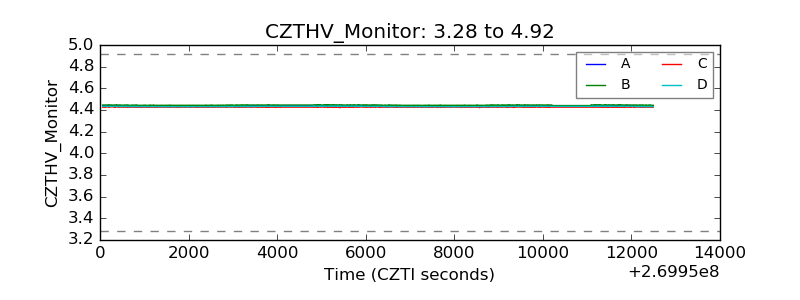 |
| D_VDD | 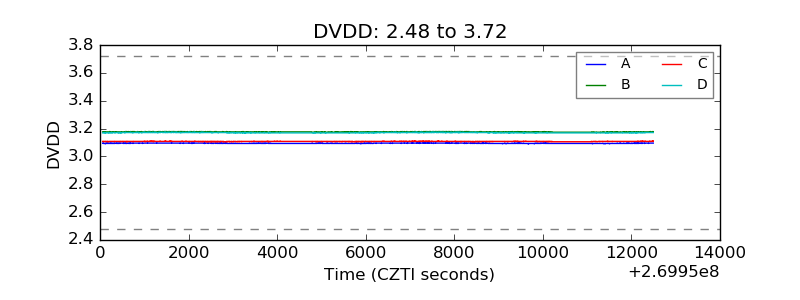 |
| Temperature 1 | 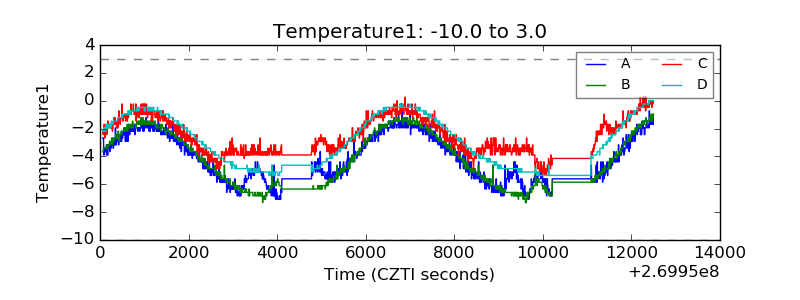 |
| Veto HV Monitor | 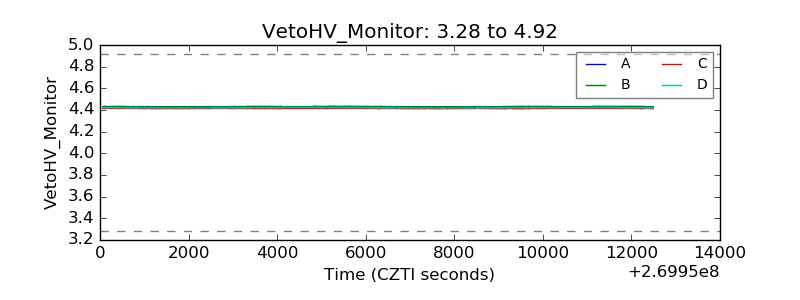 |
| Veto LLD | 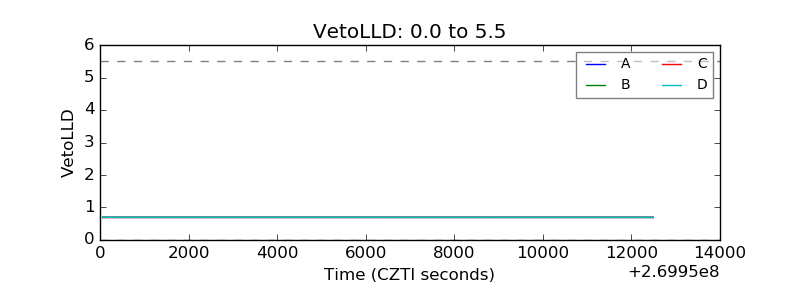 |
| Alpha Counter | 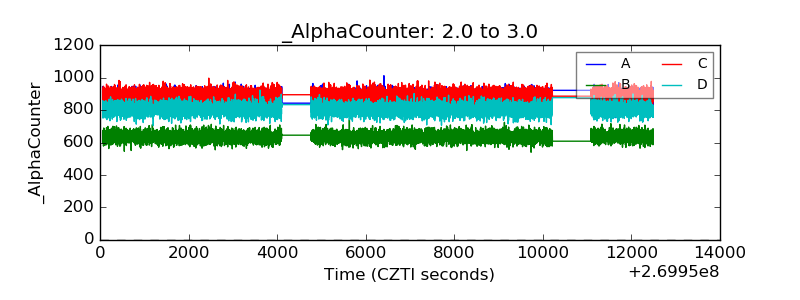 |
| _CPM_Rate | 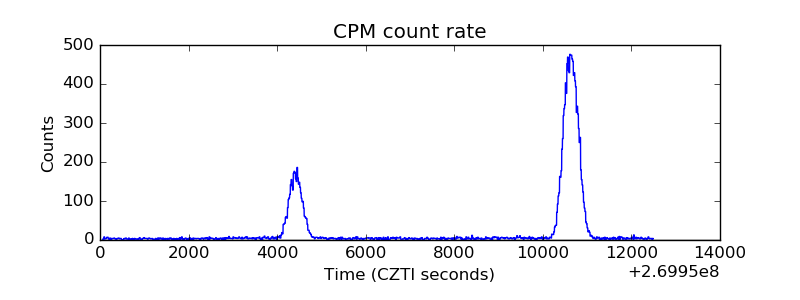 |
| CZT Counter | 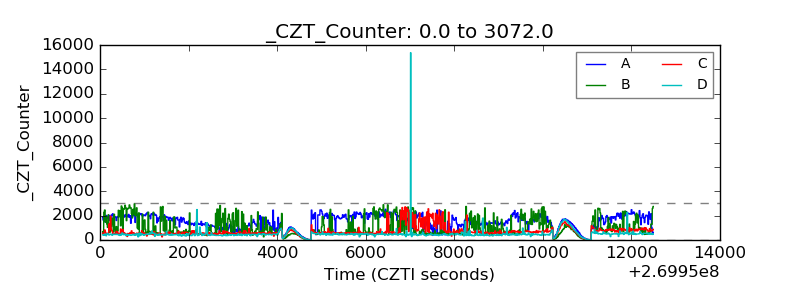 |
| +2.5 Volts monitor | 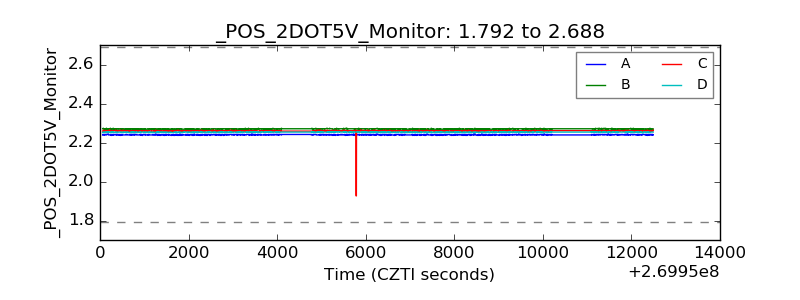 |
| +5 Volts monitor |  |
| _ROLL_ROT | 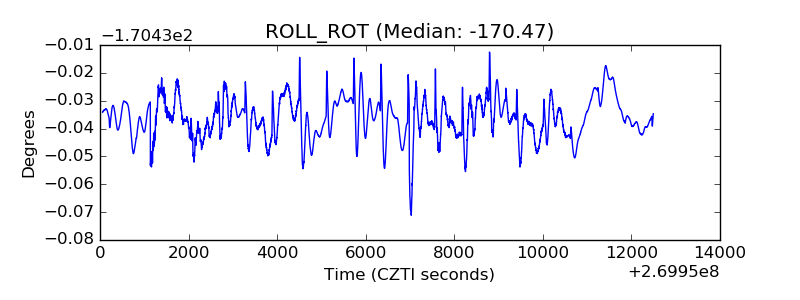 |
| _Roll_DEC | 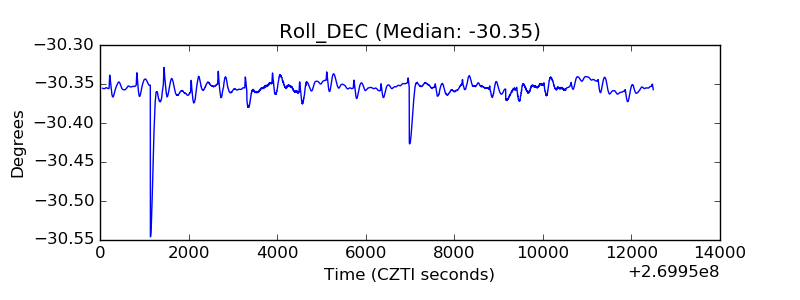 |
| _Roll_RA | 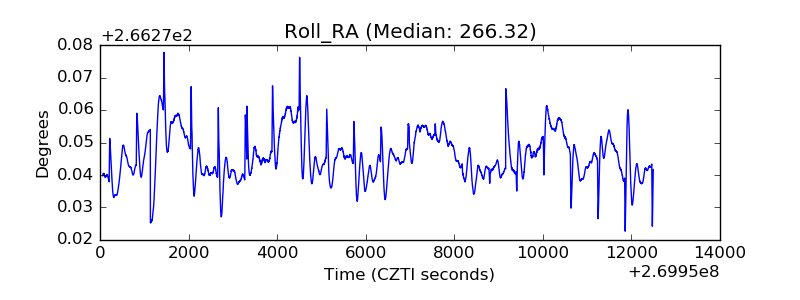 |
| Veto Counter | 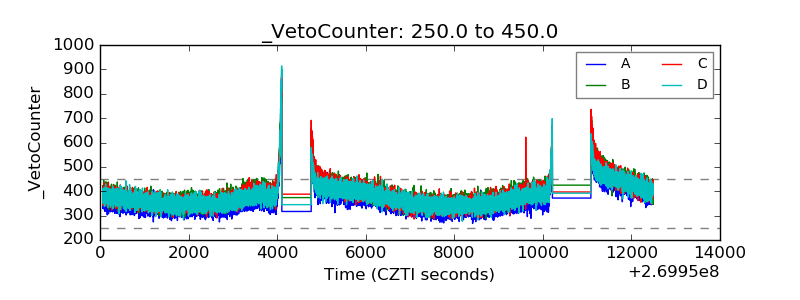 |