| Param | Original file | Final file |
|---|---|---|
| Filename | modeM0/AS1A04_105T01_9000002248_15222cztM0_level2.evt | modeM0/AS1A04_105T01_9000002248_15222cztM0_level2_quad_clean.evt |
| Size (bytes) | 705,378,240 | 93,395,520 |
| Size | 672.7 MB | 89.1 MB |
| Events in quadrant A | 4,703,855 | 615,694 |
| Events in quadrant B | 8,431,584 | 555,382 |
| Events in quadrant C | 4,763,837 | 626,545 |
| Events in quadrant D | 3,055,158 | 608,127 |
| Mode M9 | |||
|---|---|---|---|
| Quadrant | BADHDUFLAG | Total packets | Discarded packets |
| A | 0 | 10 | 0 |
| B | 0 | 10 | 0 |
| C | 0 | 10 | 0 |
| D | 0 | 10 | 0 |
| Mode SS | |||
|---|---|---|---|
| Quadrant | BADHDUFLAG | Total packets | Discarded packets |
| A | 0 | 122 | 0 |
| B | 0 | 122 | 0 |
| C | 0 | 122 | 0 |
| D | 0 | 122 | 0 |
| Mode M0 | |||
|---|---|---|---|
| Quadrant | BADHDUFLAG | Total packets | Discarded packets |
| A | 0 | 18069 | 2 |
| B | 0 | 29226 | 1 |
| C | 0 | 18631 | 1 |
| D | 0 | 13156 | 1 |
| Quadrant | Total seconds | Saturated seconds | Saturation percentage |
|---|---|---|---|
| A | 6043 | 663 | 10.971372% |
| B | 6043 | 2090 | 34.585471% |
| C | 6043 | 66 | 1.092173% |
| D | 6043 | 121 | 2.002317% |
Noise dominated data is calculated using 1-second bins in cleaned event files. If a bin has >2000 counts, and if more than 50% of those come from <1% of pixels, then it is considered to be noise-dominated and hence unusable.
| Quadrant | # 1 sec bins | Bins with >0 counts | Bins with >2000 counts | High rate bins dominated by noise | Noise dominated (total time) | Noise dominated (detector-on time) | Marked lightcurve |
|---|---|---|---|---|---|---|---|
| A | 7034 | 6044 | 391 | 391 | 5.56% | 6.47% | 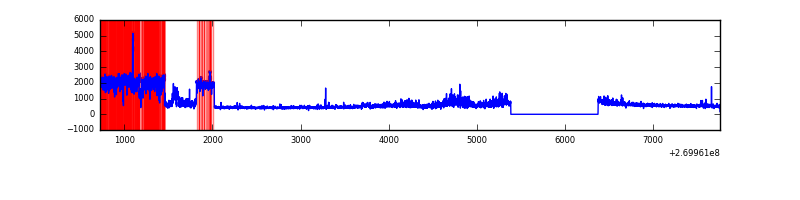 |
| B | 7034 | 6044 | 1552 | 1552 | 22.06% | 25.68% | 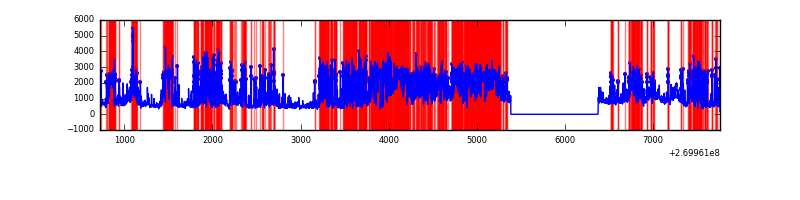 |
| C | 7034 | 6044 | 1 | 1 | 0.01% | 0.02% | 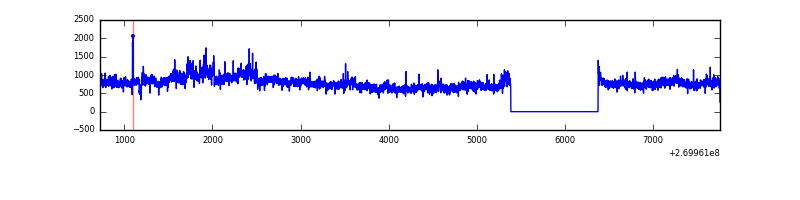 |
| D | 7034 | 6044 | 50 | 50 | 0.71% | 0.83% | 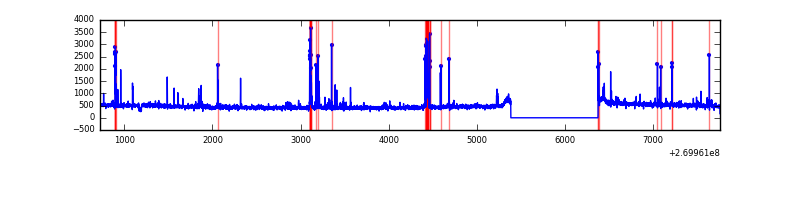 |
Top three noisy pixels from each quadrant. If the there are fewer than three noisy pixels in the level2.evt file, extra rows are filled as -1
| Pixel properties | Quadrant properties | ||||||
|---|---|---|---|---|---|---|---|
| Quadrant | DetID | PixID | Counts | Sigma | Mean | Median | Sigma |
| A | 0 | 253 | 1788723 | 11906.46 | 733 | 717 | 150.2 |
| A | 12 | 189 | 86888 | 573.82 | 733 | 717 | 150.2 |
| A | 9 | 143 | 7955 | 48.2 | 733 | 717 | 150.2 |
| B | 3 | 112 | 5480567 | 44685.33 | 640 | 623 | 122.6 |
| B | 3 | 64 | 179872 | 1461.66 | 640 | 623 | 122.6 |
| B | 0 | 245 | 102287 | 829.0 | 640 | 623 | 122.6 |
| C | 3 | 233 | 1967563 | 11927.22 | 713 | 720 | 164.9 |
| C | 7 | 247 | 13393 | 76.85 | 713 | 720 | 164.9 |
| C | 13 | 61 | 5315 | 27.86 | 713 | 720 | 164.9 |
| D | 13 | 172 | 79531 | 457.64 | 717 | 699 | 172.3 |
| D | 7 | 38 | 70351 | 404.34 | 717 | 699 | 172.3 |
| D | 2 | 33 | 58818 | 337.39 | 717 | 699 | 172.3 |
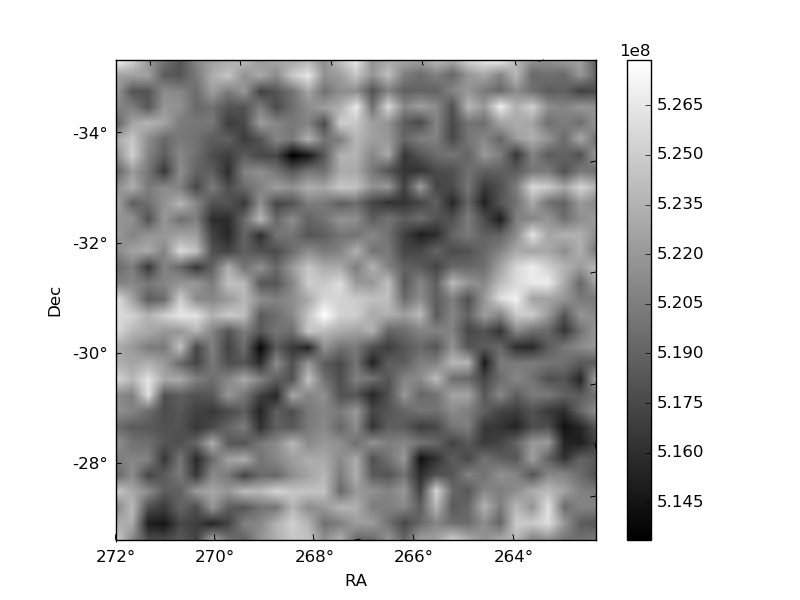
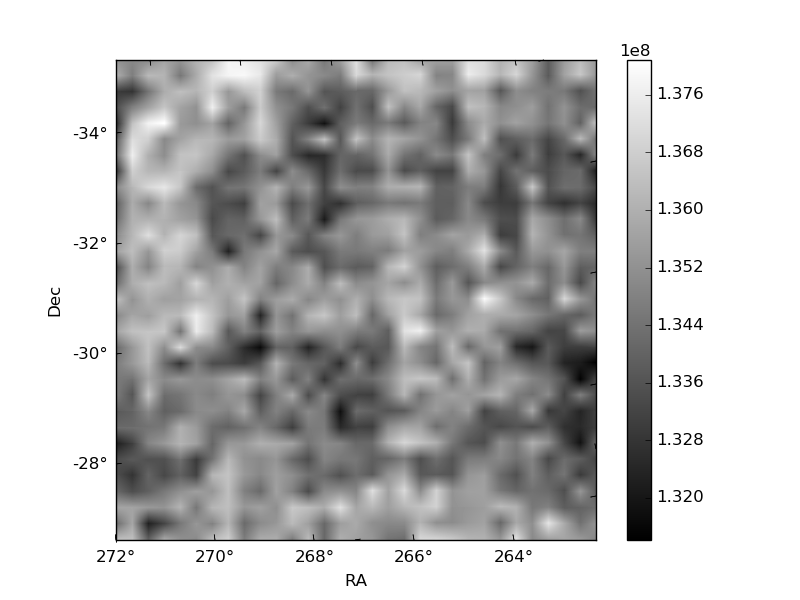
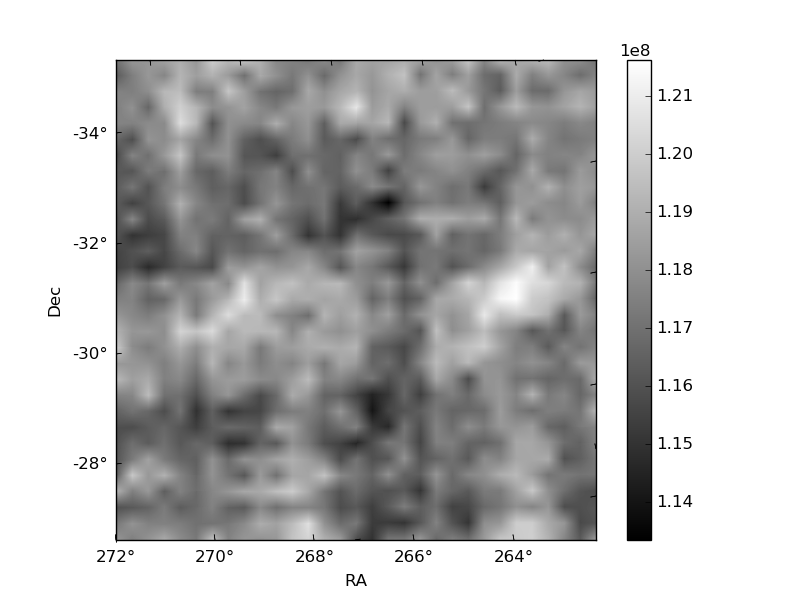
Histogram calculated using DETX and DETY for each event in the final _common_clean file
| Quadrant A | 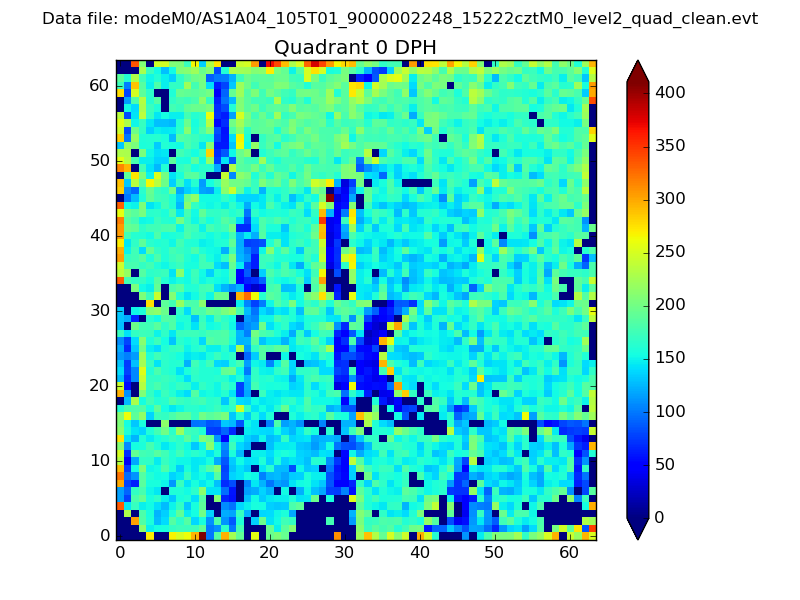 |
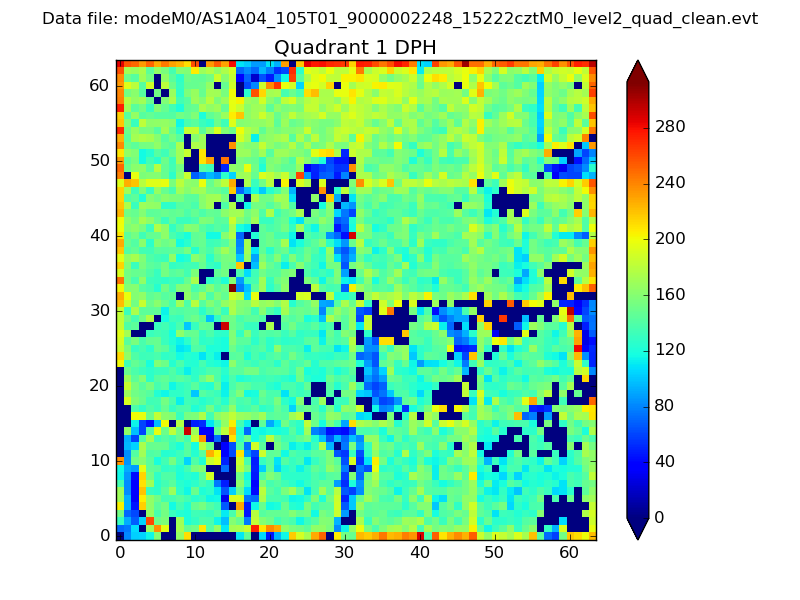 |
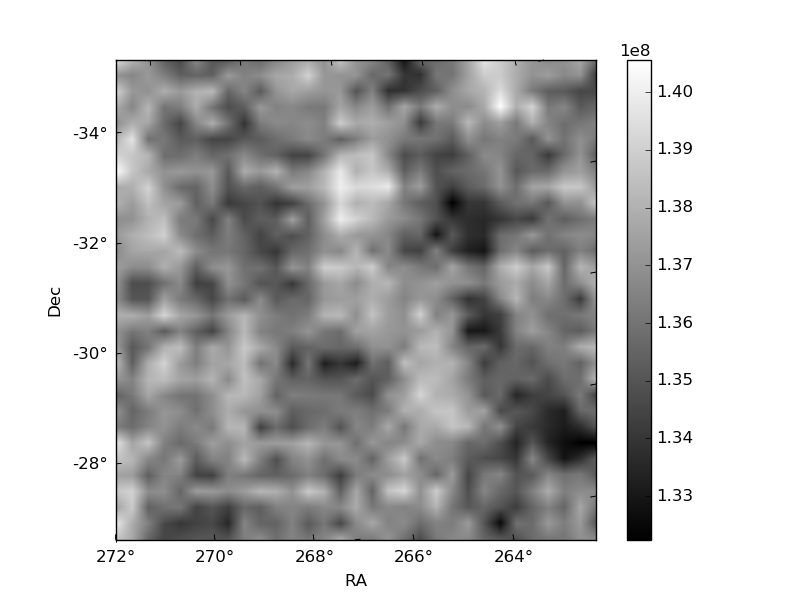
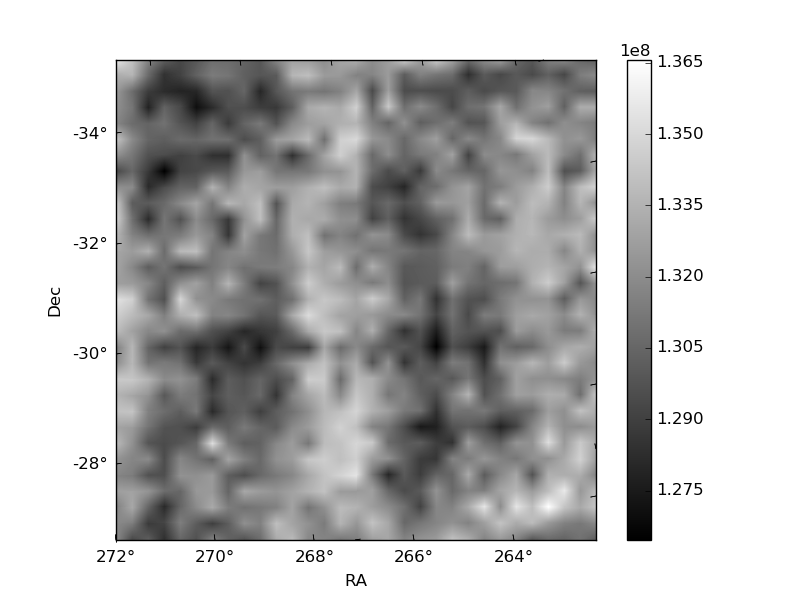
Quadrant B |
|---|---|---|---|
| Quadrant D | 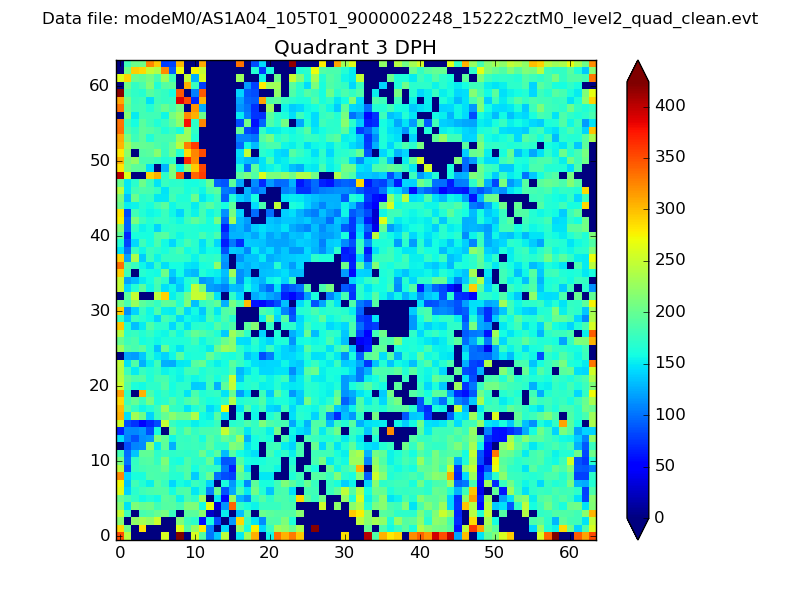 |
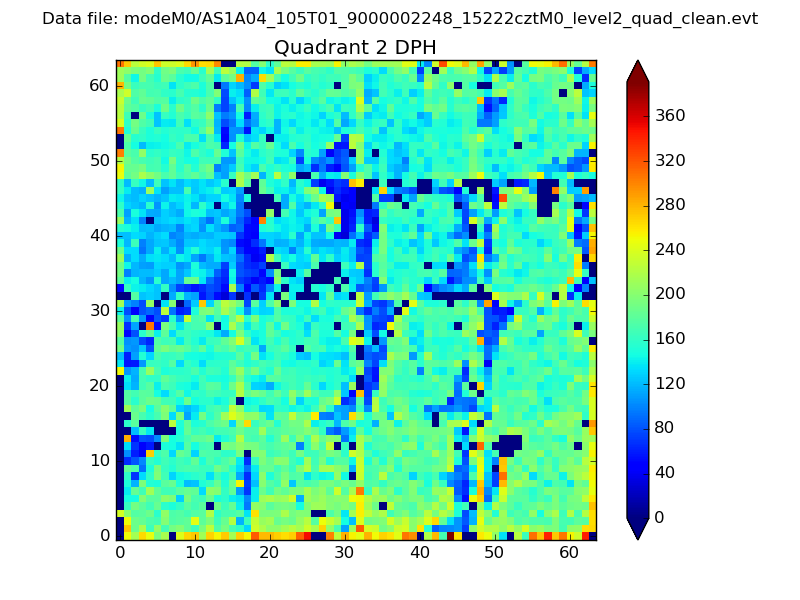 |
Quadrant C |
| Plot type | Count rate plots | Images |
|---|---|---|
| Comparison with Poisson distribution Blue bars denote a histogram of data divided into 1 sec bins. Red curve is a Poisson curve with rate = median count rate of data. |
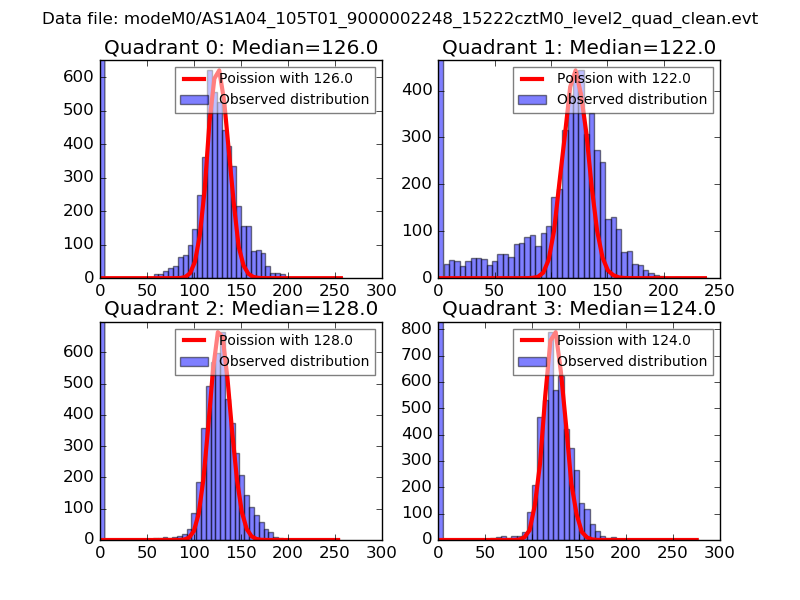 |
 |
| Quadrant-wise count rates Data is divided into 100 sec bins |
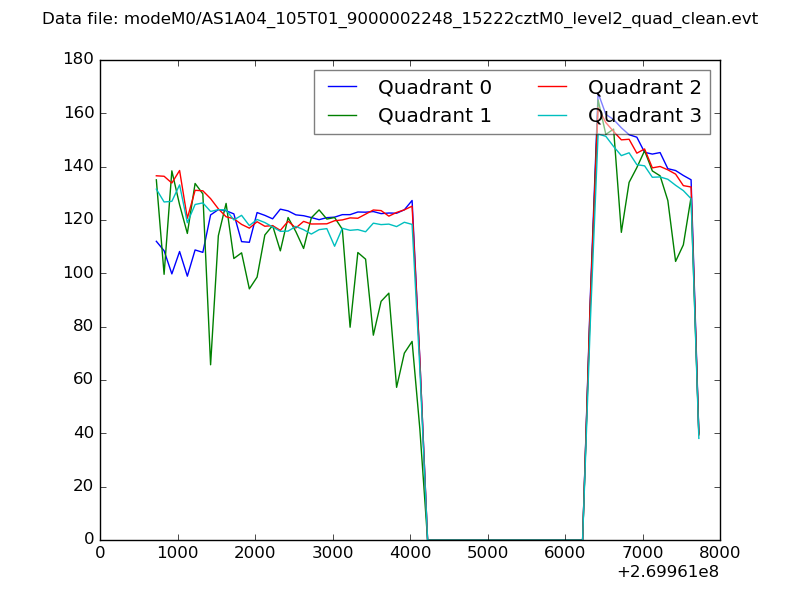 |
|
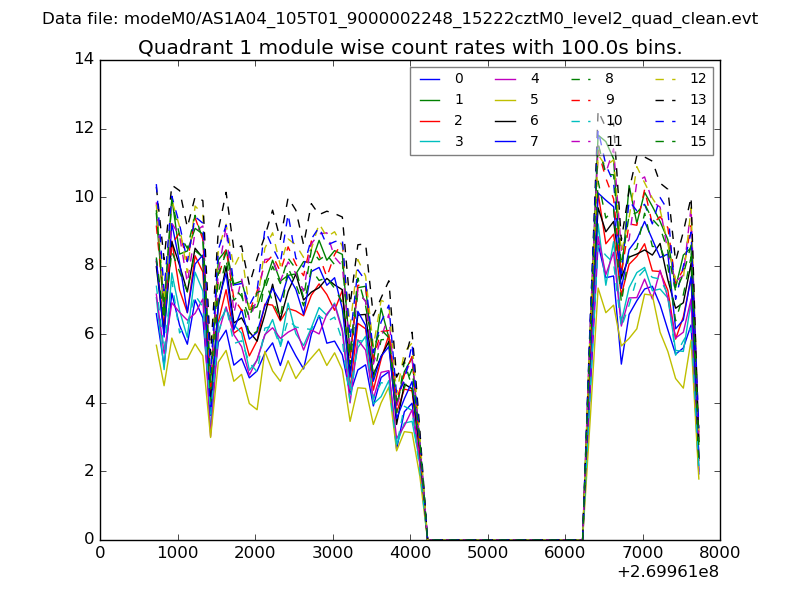
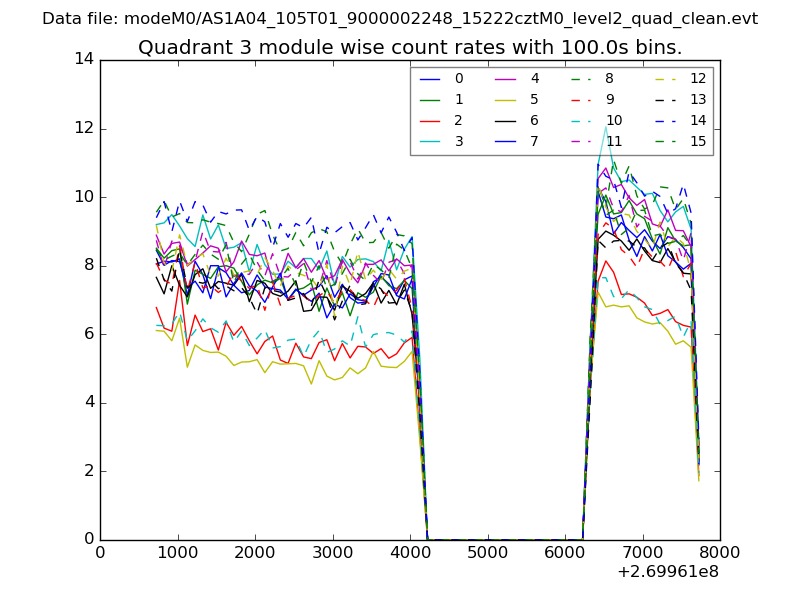
| Module-wise count rates for Quadrant A Data is divided into 100 sec bins |
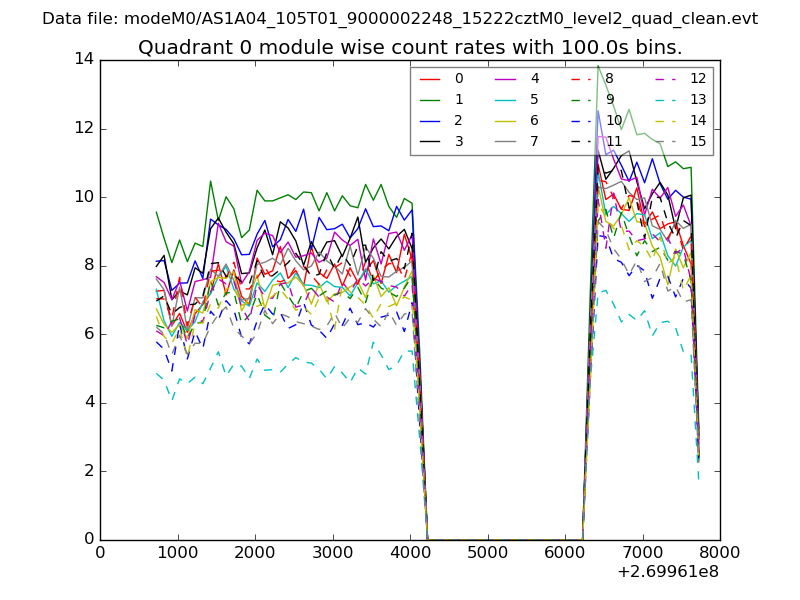 |
 |
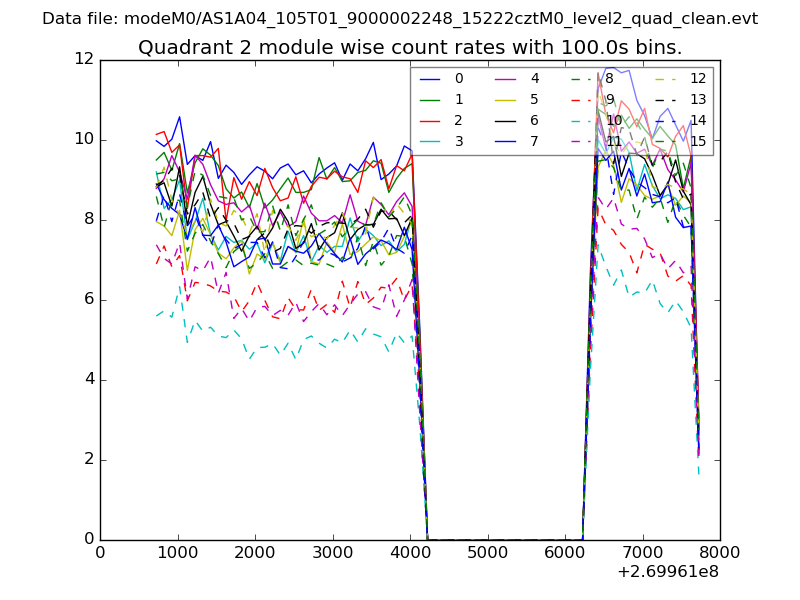
| Module-wise count rates for Quadrant B Data is divided into 100 sec bins |
 |
 |
| Module-wise count rates for Quadrant C Data is divided into 100 sec bins |
 |
 |
| Module-wise count rates for Quadrant D Data is divided into 100 sec bins |
 |
 |
| Parameter | Plot |
|---|---|
| CZT HV Monitor | 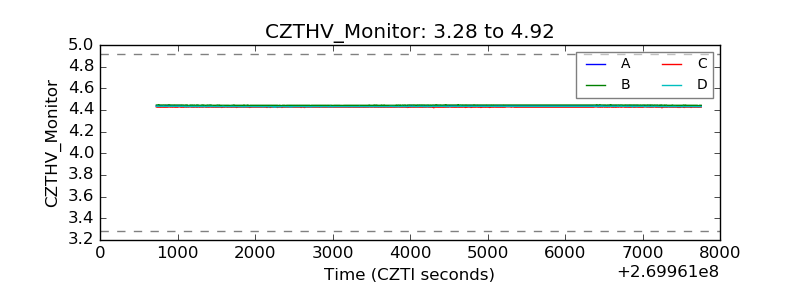 |
| D_VDD | 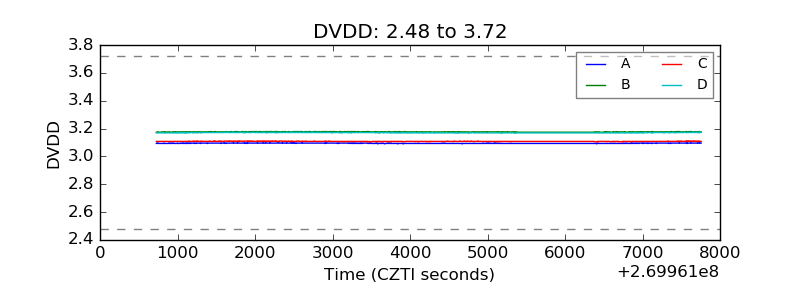 |
| Temperature 1 | 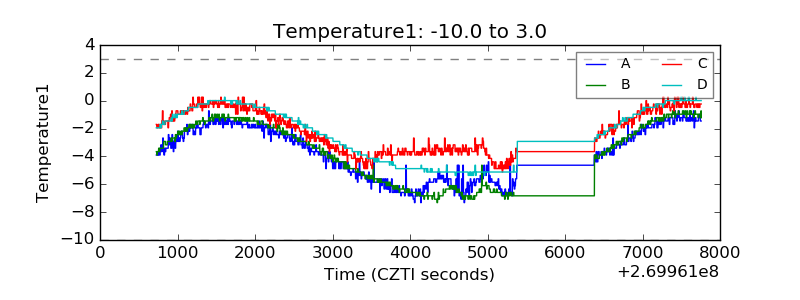 |
| Veto HV Monitor | 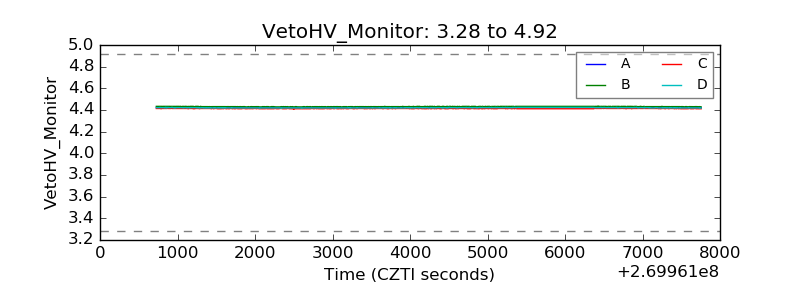 |
| Veto LLD | 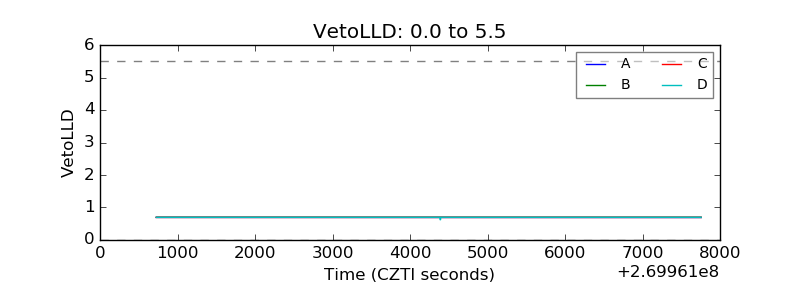 |
| Alpha Counter | 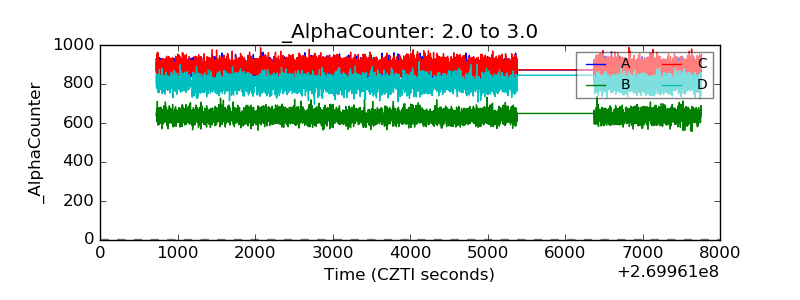 |
| _CPM_Rate | 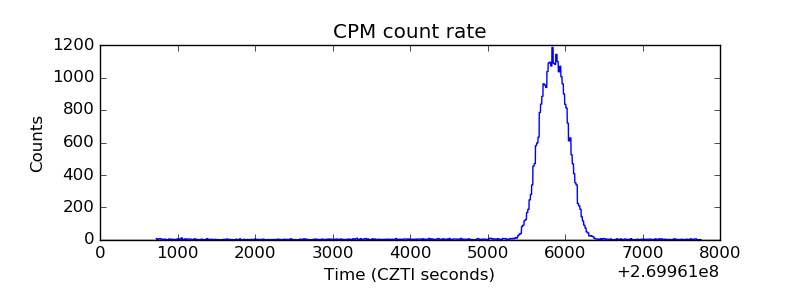 |
| CZT Counter | 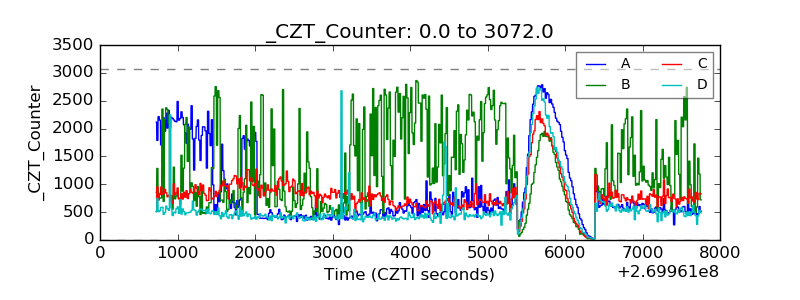 |
| +2.5 Volts monitor |  |
| +5 Volts monitor |  |
| _ROLL_ROT | 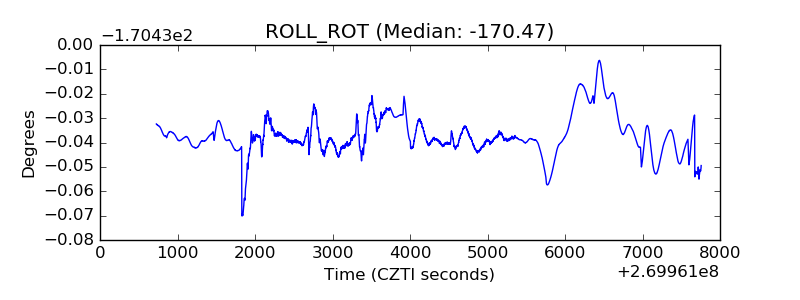 |
| _Roll_DEC | 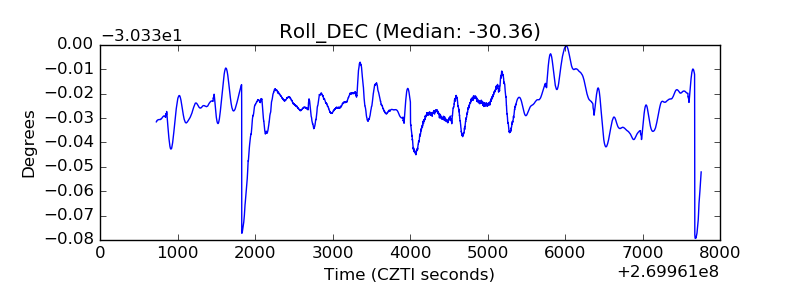 |
| _Roll_RA | 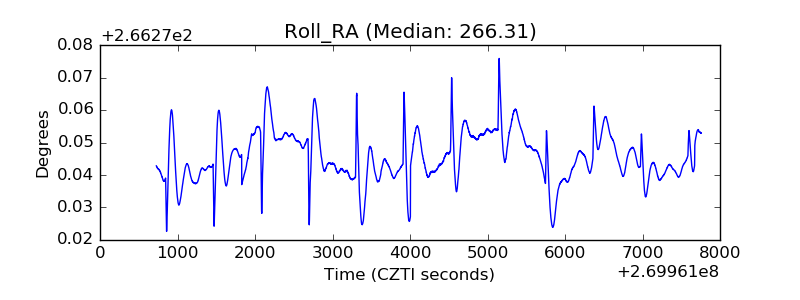 |
| Veto Counter | 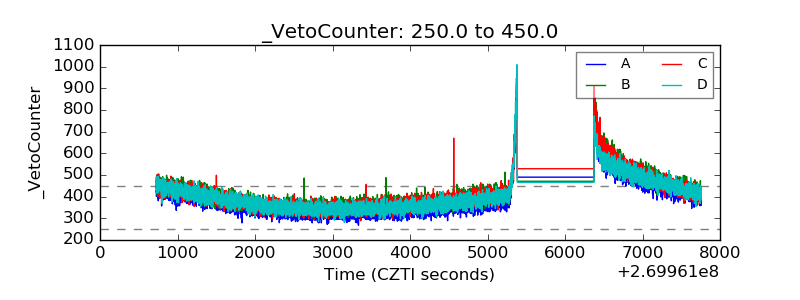 |