| Param | Original file | Final file |
|---|---|---|
| Filename | modeM0/AS1A04_105T01_9000002248_15223cztM0_level2.evt | modeM0/AS1A04_105T01_9000002248_15223cztM0_level2_quad_clean.evt |
| Size (bytes) | 599,532,480 | 99,486,720 |
| Size | 571.8 MB | 94.9 MB |
| Events in quadrant A | 3,410,272 | 671,055 |
| Events in quadrant B | 6,537,521 | 611,947 |
| Events in quadrant C | 4,412,940 | 654,513 |
| Events in quadrant D | 3,370,063 | 635,874 |
| Mode M9 | |||
|---|---|---|---|
| Quadrant | BADHDUFLAG | Total packets | Discarded packets |
| A | 0 | 11 | 0 |
| B | 0 | 11 | 0 |
| C | 0 | 11 | 0 |
| D | 0 | 11 | 0 |
| Mode SS | |||
|---|---|---|---|
| Quadrant | BADHDUFLAG | Total packets | Discarded packets |
| A | 0 | 128 | 0 |
| B | 0 | 128 | 0 |
| C | 0 | 128 | 0 |
| D | 0 | 128 | 0 |
| Mode M0 | |||
|---|---|---|---|
| Quadrant | BADHDUFLAG | Total packets | Discarded packets |
| A | 0 | 14182 | 2 |
| B | 0 | 23656 | 1 |
| C | 0 | 17690 | 1 |
| D | 0 | 14163 | 1 |
| Quadrant | Total seconds | Saturated seconds | Saturation percentage |
|---|---|---|---|
| A | 6291 | 128 | 2.034653% |
| B | 6291 | 1131 | 17.978064% |
| C | 6291 | 60 | 0.953743% |
| D | 6291 | 125 | 1.986966% |
Noise dominated data is calculated using 1-second bins in cleaned event files. If a bin has >2000 counts, and if more than 50% of those come from <1% of pixels, then it is considered to be noise-dominated and hence unusable.
| Quadrant | # 1 sec bins | Bins with >0 counts | Bins with >2000 counts | High rate bins dominated by noise | Noise dominated (total time) | Noise dominated (detector-on time) | Marked lightcurve |
|---|---|---|---|---|---|---|---|
| A | 7427 | 6292 | 68 | 68 | 0.92% | 1.08% | 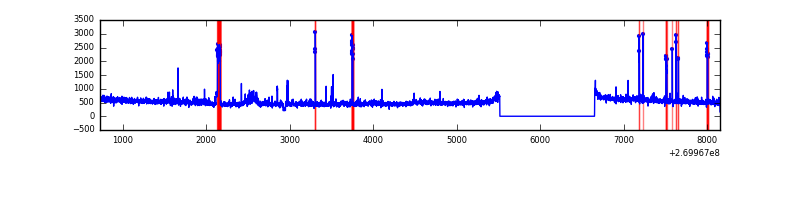 |
| B | 7427 | 6292 | 787 | 787 | 10.60% | 12.51% | 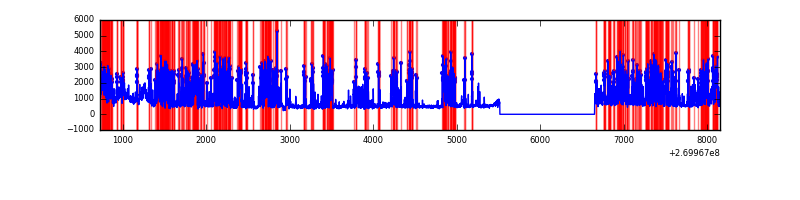 |
| C | 7427 | 6293 | 16 | 16 | 0.22% | 0.25% | 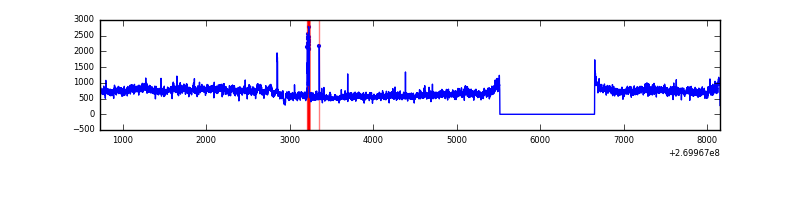 |
| D | 7427 | 6292 | 92 | 92 | 1.24% | 1.46% | 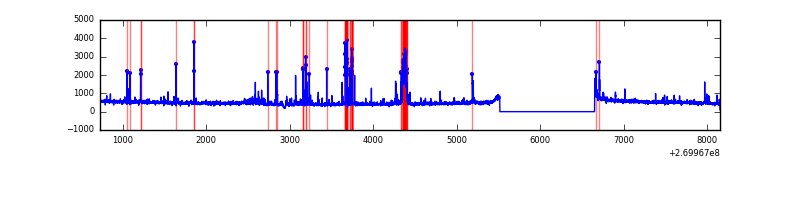 |
Top three noisy pixels from each quadrant. If the there are fewer than three noisy pixels in the level2.evt file, extra rows are filled as -1
| Pixel properties | Quadrant properties | ||||||
|---|---|---|---|---|---|---|---|
| Quadrant | DetID | PixID | Counts | Sigma | Mean | Median | Sigma |
| A | 0 | 253 | 179121 | 1100.0 | 792 | 777 | 162.1 |
| A | 12 | 189 | 146692 | 899.98 | 792 | 777 | 162.1 |
| A | 9 | 143 | 25797 | 154.32 | 792 | 777 | 162.1 |
| B | 3 | 112 | 2963162 | 21279.08 | 737 | 721 | 139.2 |
| B | 3 | 64 | 222402 | 1592.32 | 737 | 721 | 139.2 |
| B | 10 | 245 | 197713 | 1414.98 | 737 | 721 | 139.2 |
| C | 3 | 233 | 1414617 | 8105.09 | 754 | 759 | 174.4 |
| C | 4 | 254 | 42024 | 236.56 | 754 | 759 | 174.4 |
| C | 7 | 247 | 13322 | 72.02 | 754 | 759 | 174.4 |
| D | 13 | 172 | 140982 | 753.85 | 761 | 740 | 186.0 |
| D | 7 | 223 | 100963 | 538.74 | 761 | 740 | 186.0 |
| D | 2 | 16 | 79246 | 422.0 | 761 | 740 | 186.0 |
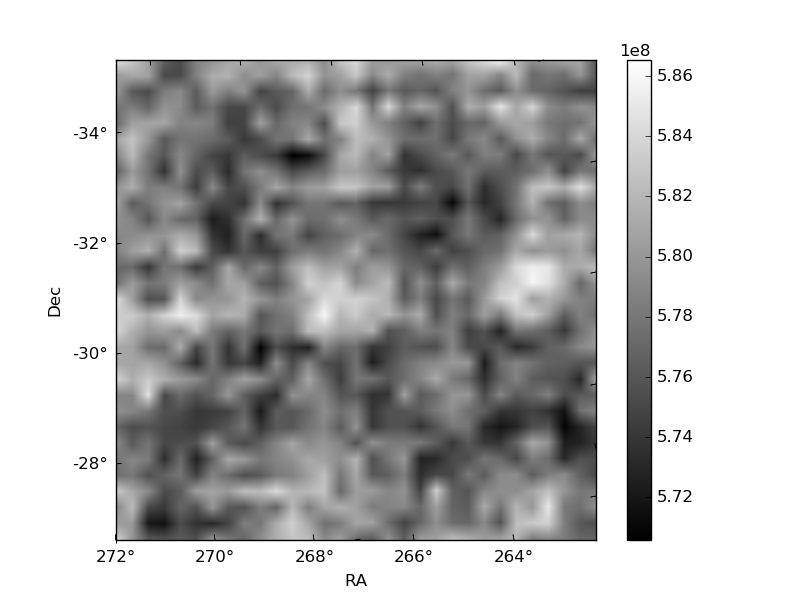
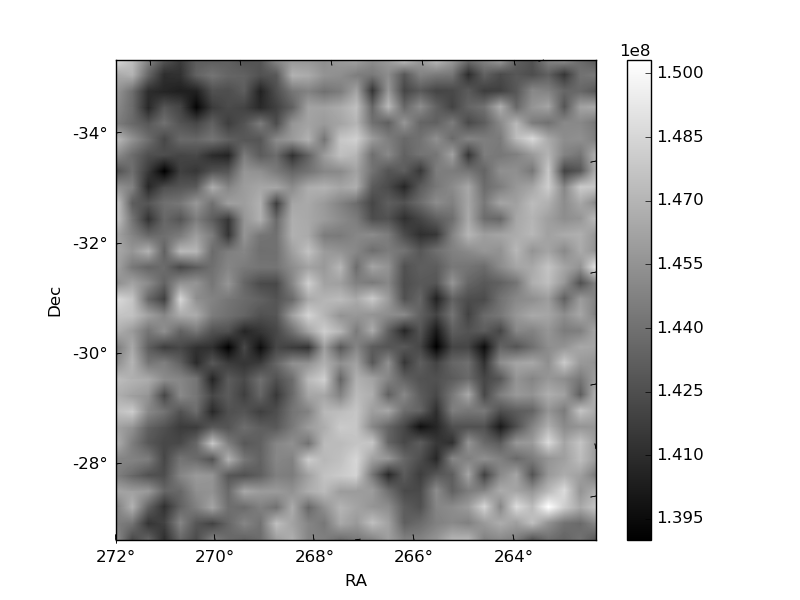
Histogram calculated using DETX and DETY for each event in the final _common_clean file
| Quadrant A | 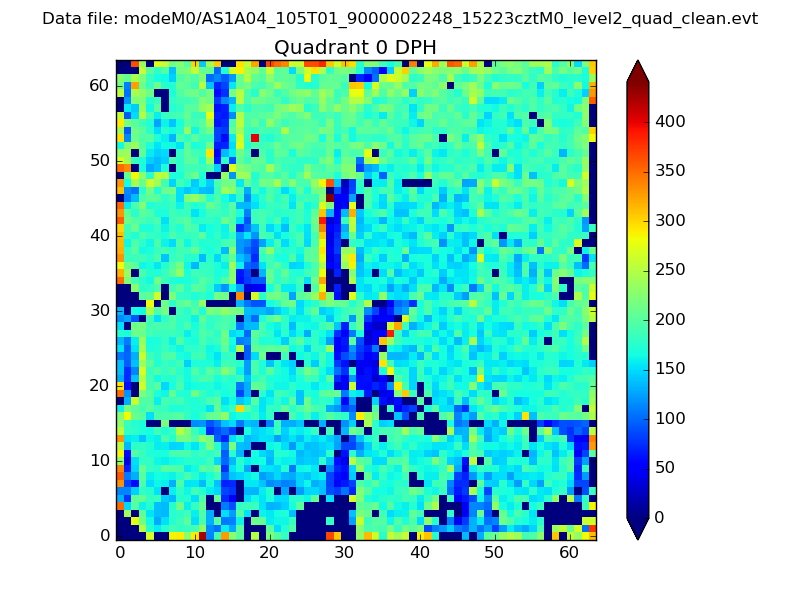 |
 |
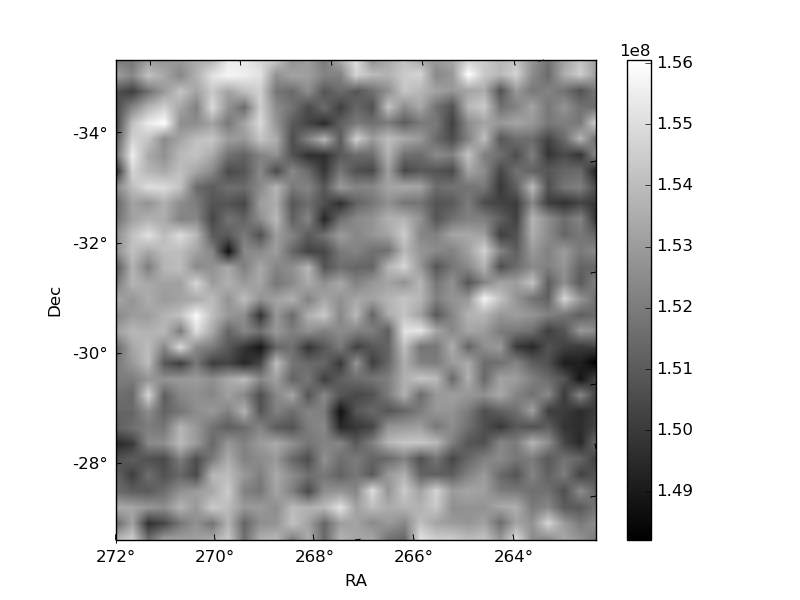
Quadrant B |
|---|---|---|---|
| Quadrant D | 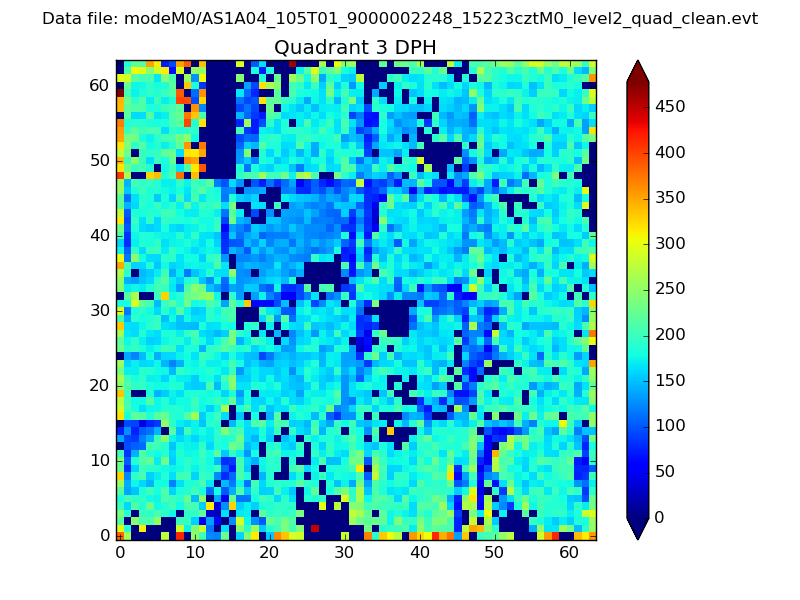 |
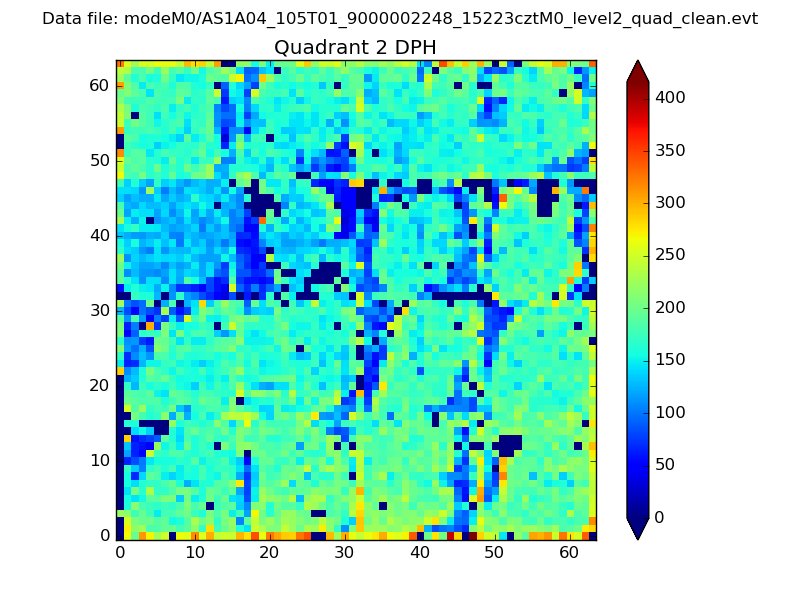 |
Quadrant C |
| Plot type | Count rate plots | Images |
|---|---|---|
| Comparison with Poisson distribution Blue bars denote a histogram of data divided into 1 sec bins. Red curve is a Poisson curve with rate = median count rate of data. |
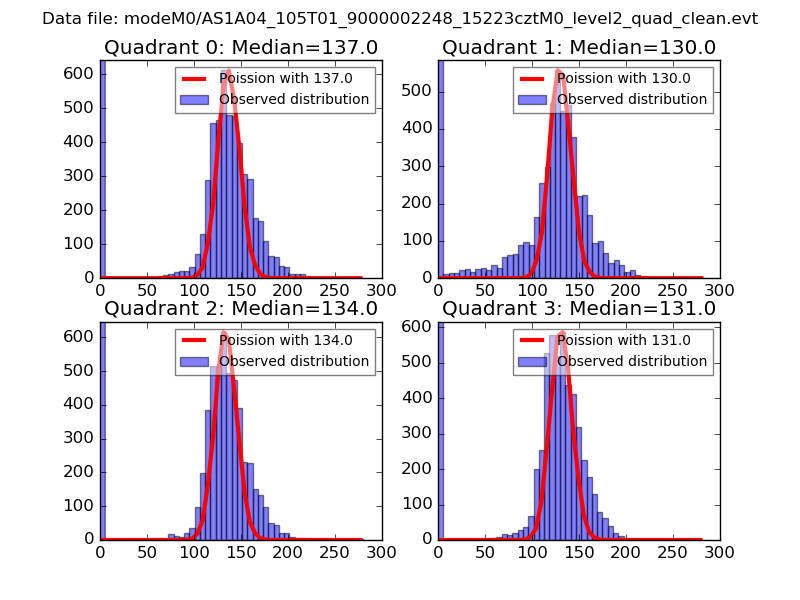 |
 |
| Quadrant-wise count rates Data is divided into 100 sec bins |
 |
|
| Module-wise count rates for Quadrant A Data is divided into 100 sec bins |
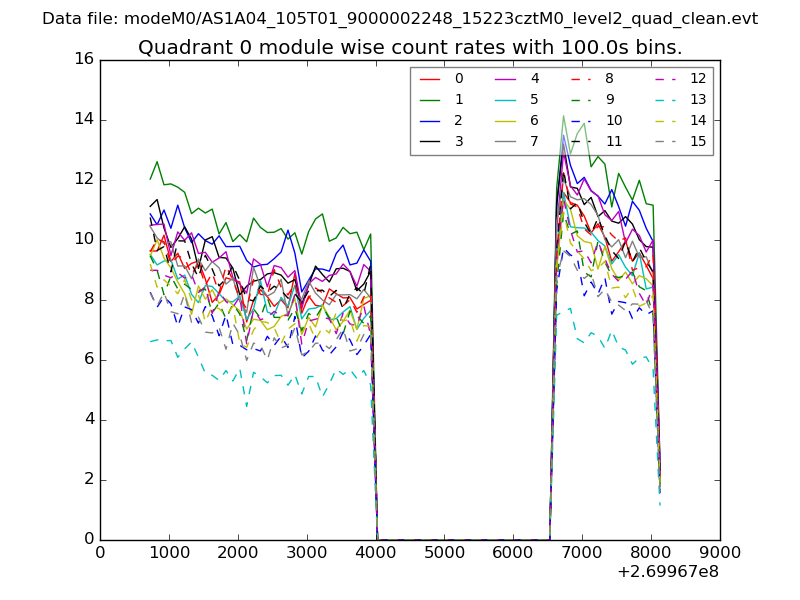 |
 |
| Module-wise count rates for Quadrant B Data is divided into 100 sec bins |
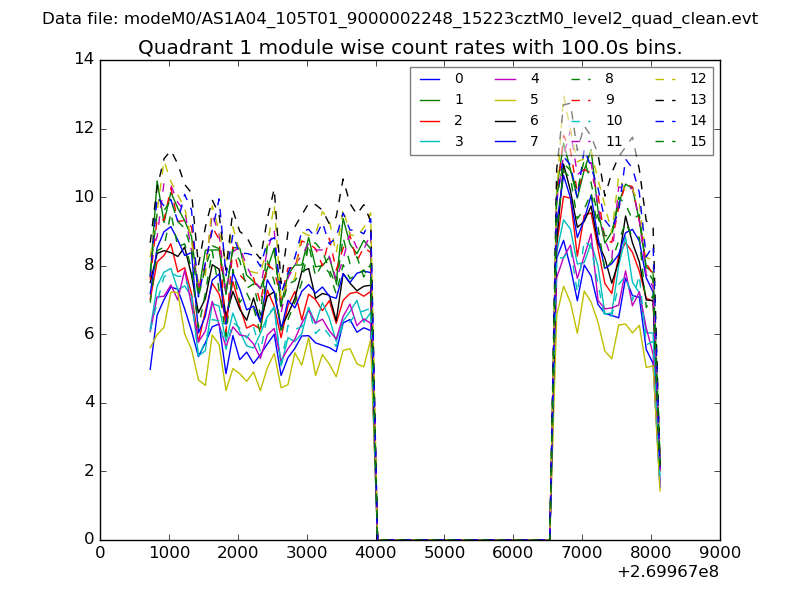 |
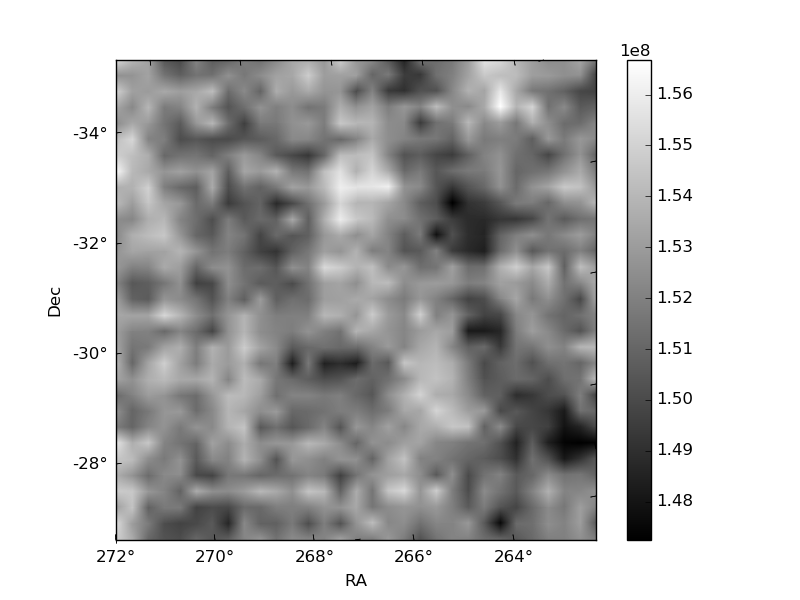 |
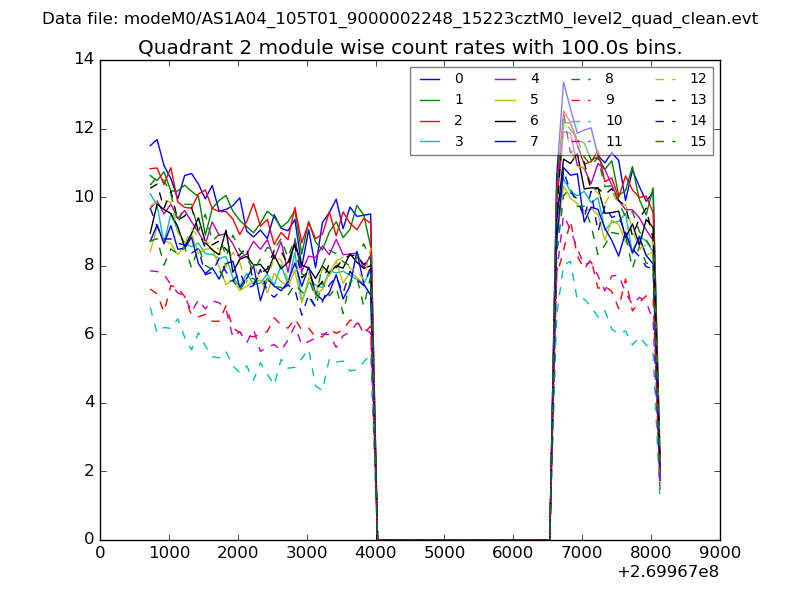
| Module-wise count rates for Quadrant C Data is divided into 100 sec bins |
 |
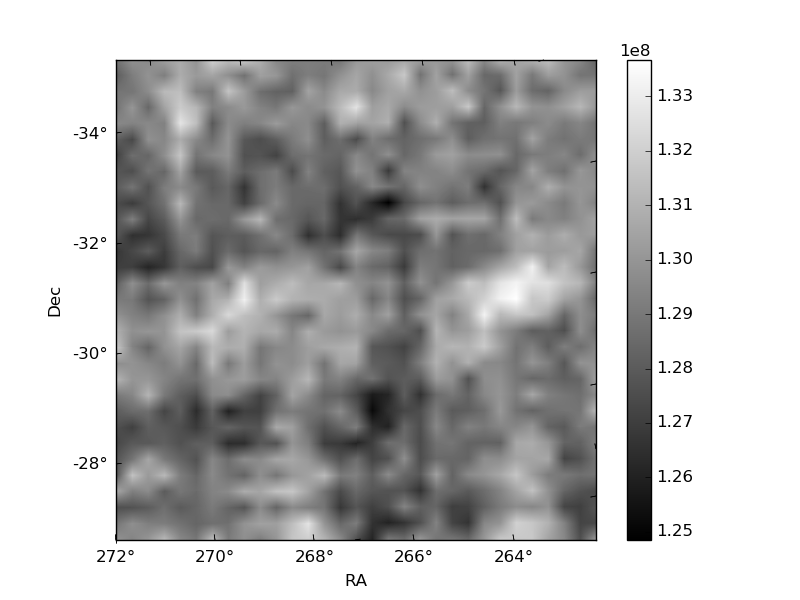 |
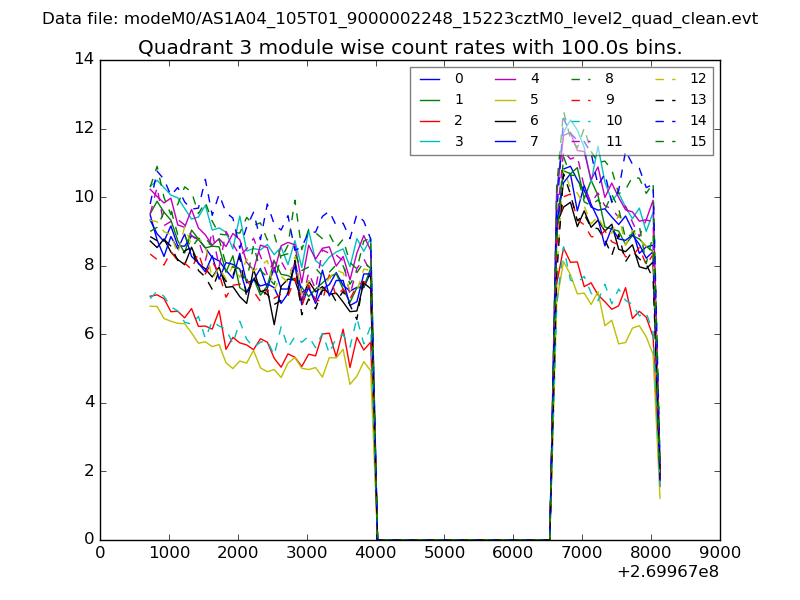
| Module-wise count rates for Quadrant D Data is divided into 100 sec bins |
 |
 |
| Parameter | Plot |
|---|---|
| CZT HV Monitor | 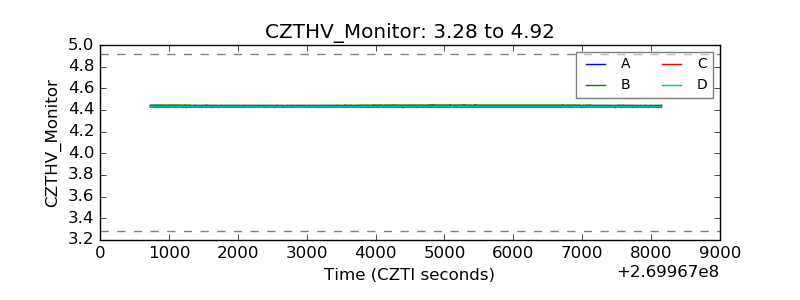 |
| D_VDD | 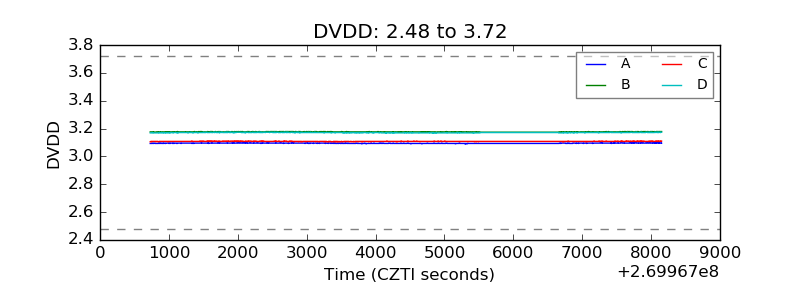 |
| Temperature 1 | 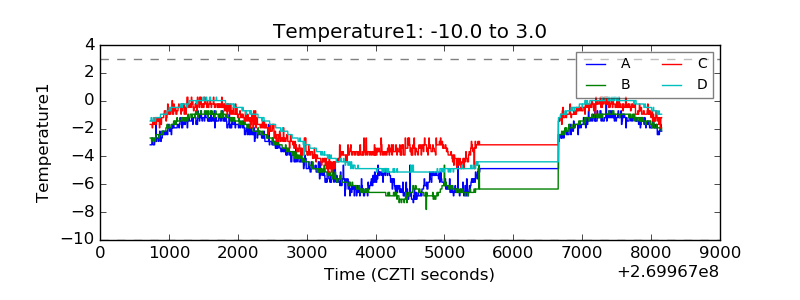 |
| Veto HV Monitor | 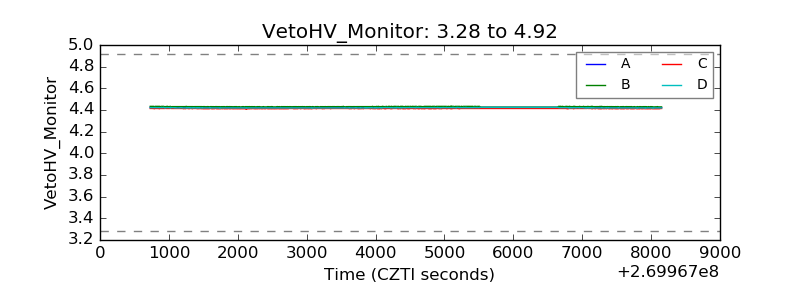 |
| Veto LLD | 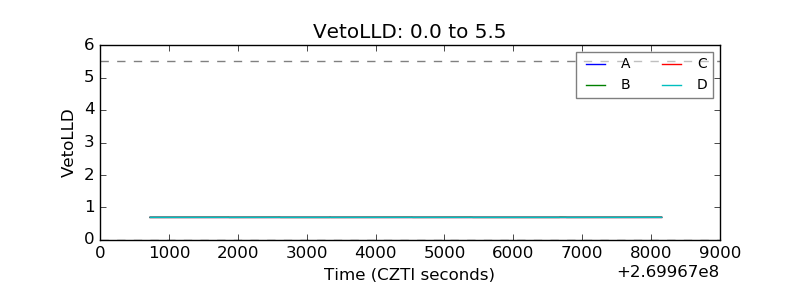 |
| Alpha Counter | 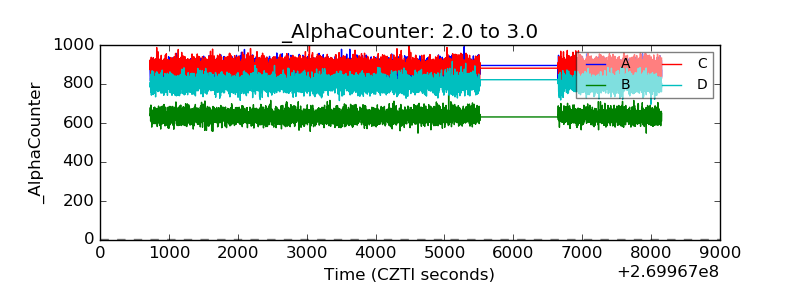 |
| _CPM_Rate |  |
| CZT Counter | 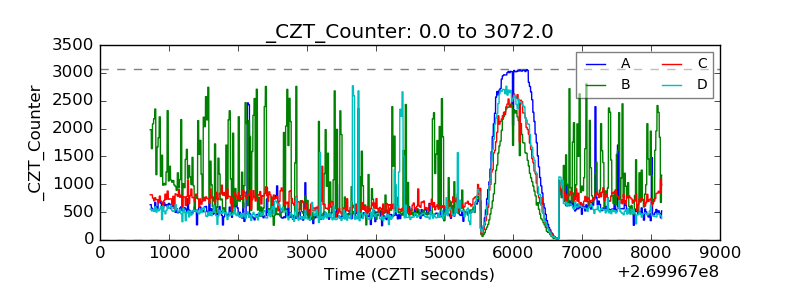 |
| +2.5 Volts monitor |  |
| +5 Volts monitor |  |
| _ROLL_ROT | 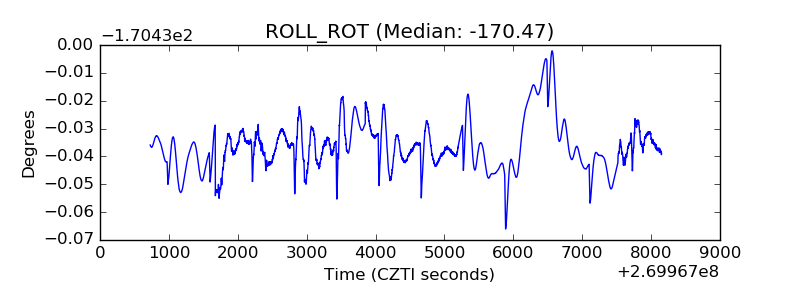 |
| _Roll_DEC | 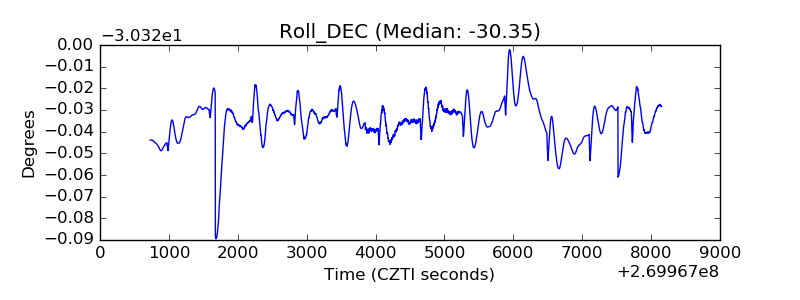 |
| _Roll_RA | 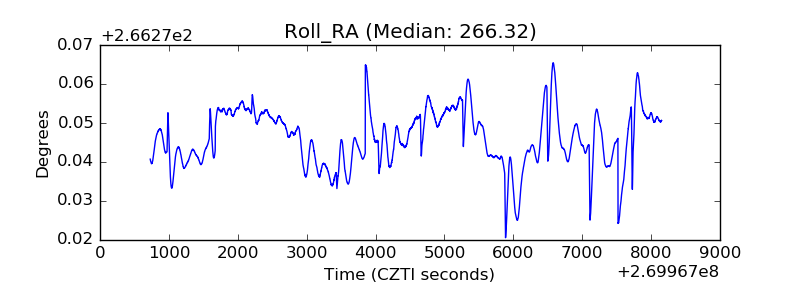 |
| Veto Counter | 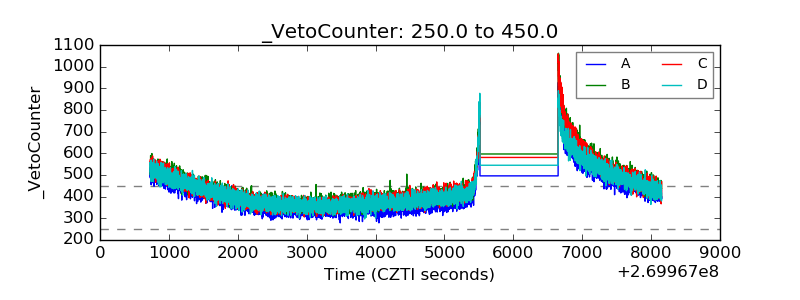 |