| Param | Original file | Final file |
|---|---|---|
| Filename | modeM0/AS1A04_105T01_9000002248_15226cztM0_level2.evt | modeM0/AS1A04_105T01_9000002248_15226cztM0_level2_quad_clean.evt |
| Size (bytes) | 588,335,040 | 91,563,840 |
| Size | 561.1 MB | 87.3 MB |
| Events in quadrant A | 4,932,141 | 621,725 |
| Events in quadrant B | 3,797,573 | 628,416 |
| Events in quadrant C | 5,491,526 | 509,190 |
| Events in quadrant D | 3,177,645 | 581,519 |
| Mode M9 | |||
|---|---|---|---|
| Quadrant | BADHDUFLAG | Total packets | Discarded packets |
| A | 0 | 17 | 0 |
| B | 0 | 17 | 0 |
| C | 0 | 17 | 0 |
| D | 0 | 18 | 0 |
| Mode SS | |||
|---|---|---|---|
| Quadrant | BADHDUFLAG | Total packets | Discarded packets |
| A | 0 | 126 | 0 |
| B | 0 | 126 | 0 |
| C | 0 | 126 | 0 |
| D | 0 | 126 | 0 |
| Mode M0 | |||
|---|---|---|---|
| Quadrant | BADHDUFLAG | Total packets | Discarded packets |
| A | 0 | 19413 | 3 |
| B | 0 | 15308 | 2 |
| C | 0 | 20492 | 2 |
| D | 0 | 13529 | 2 |
| Quadrant | Total seconds | Saturated seconds | Saturation percentage |
|---|---|---|---|
| A | 6184 | 469 | 7.584088% |
| B | 6184 | 165 | 2.668176% |
| C | 6184 | 871 | 14.084735% |
| D | 6184 | 64 | 1.034929% |
Noise dominated data is calculated using 1-second bins in cleaned event files. If a bin has >2000 counts, and if more than 50% of those come from <1% of pixels, then it is considered to be noise-dominated and hence unusable.
| Quadrant | # 1 sec bins | Bins with >0 counts | Bins with >2000 counts | High rate bins dominated by noise | Noise dominated (total time) | Noise dominated (detector-on time) | Marked lightcurve |
|---|---|---|---|---|---|---|---|
| A | 7530 | 6186 | 404 | 404 | 5.37% | 6.53% | 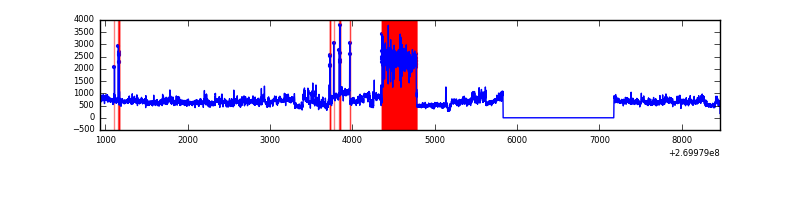 |
| B | 7530 | 6186 | 81 | 81 | 1.08% | 1.31% | 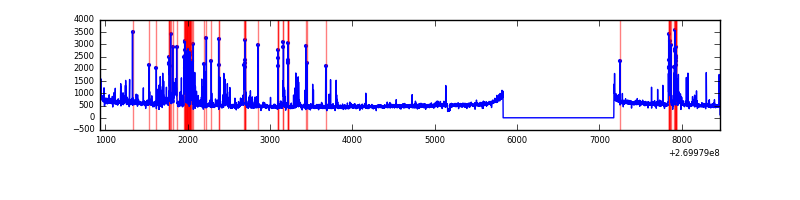 |
| C | 7530 | 6186 | 786 | 786 | 10.44% | 12.71% | 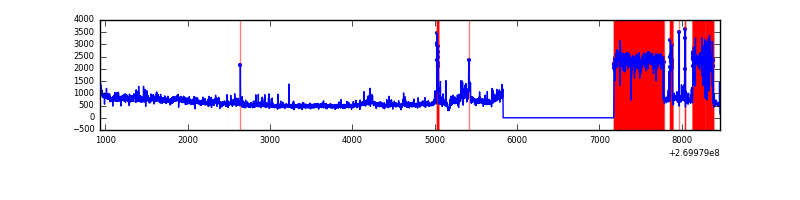 |
| D | 7530 | 6186 | 38 | 38 | 0.50% | 0.61% | 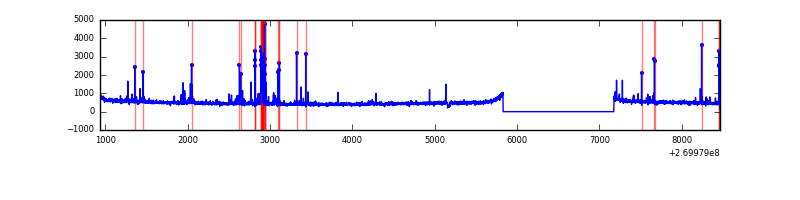 |
Top three noisy pixels from each quadrant. If the there are fewer than three noisy pixels in the level2.evt file, extra rows are filled as -1
| Pixel properties | Quadrant properties | ||||||
|---|---|---|---|---|---|---|---|
| Quadrant | DetID | PixID | Counts | Sigma | Mean | Median | Sigma |
| A | 0 | 253 | 1706697 | 10725.26 | 795 | 780 | 159.1 |
| A | 12 | 189 | 119295 | 745.11 | 795 | 780 | 159.1 |
| A | 9 | 143 | 31752 | 194.72 | 795 | 780 | 159.1 |
| B | 3 | 64 | 293679 | 1950.14 | 803 | 786 | 150.2 |
| B | 7 | 220 | 150184 | 994.72 | 803 | 786 | 150.2 |
| B | 0 | 190 | 38456 | 250.81 | 803 | 786 | 150.2 |
| C | 3 | 233 | 2647266 | 16617.0 | 690 | 694 | 159.3 |
| C | 4 | 254 | 107028 | 667.64 | 690 | 694 | 159.3 |
| C | 7 | 247 | 45580 | 281.83 | 690 | 694 | 159.3 |
| D | 7 | 38 | 178287 | 936.29 | 771 | 749 | 189.6 |
| D | 2 | 120 | 32744 | 168.73 | 771 | 749 | 189.6 |
| D | 2 | 234 | 24520 | 125.36 | 771 | 749 | 189.6 |
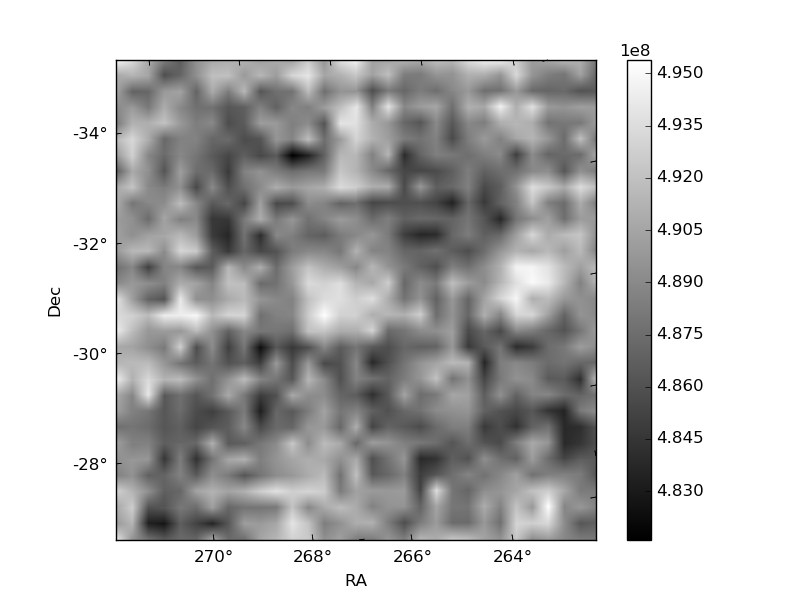
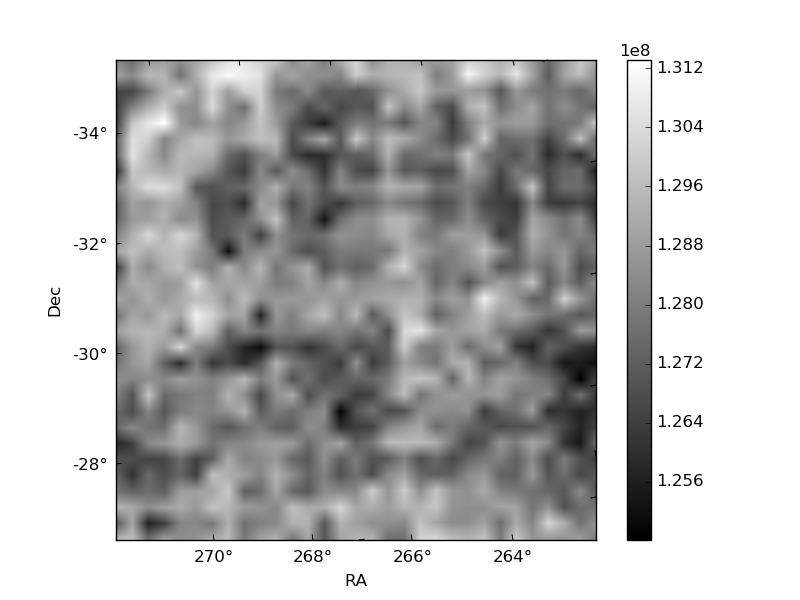
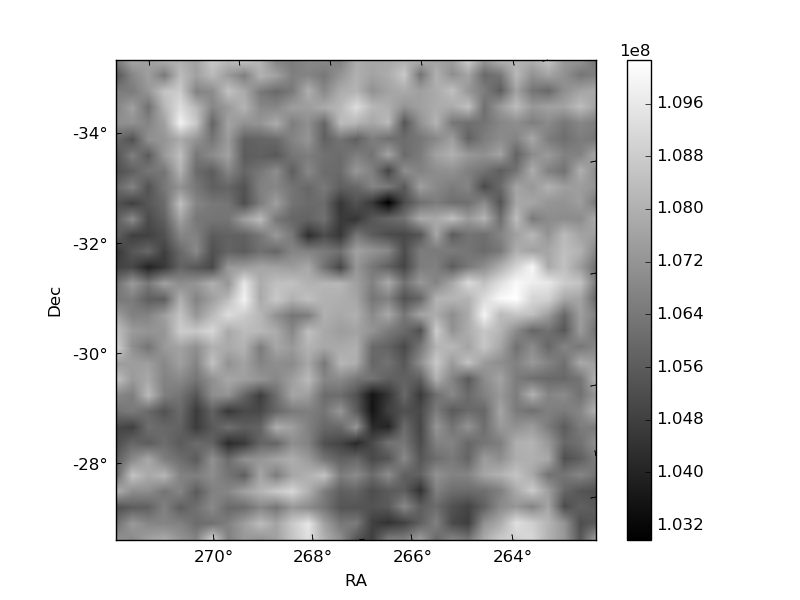
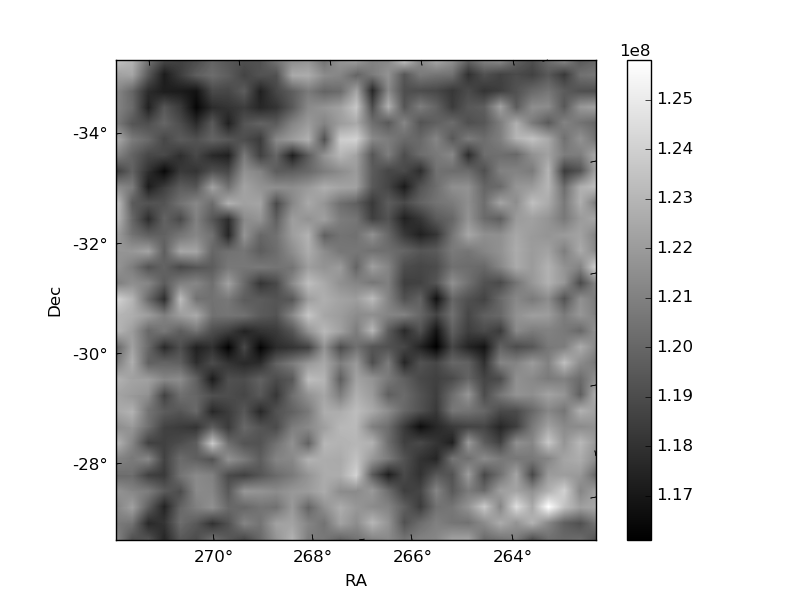
Histogram calculated using DETX and DETY for each event in the final _common_clean file
| Quadrant A | 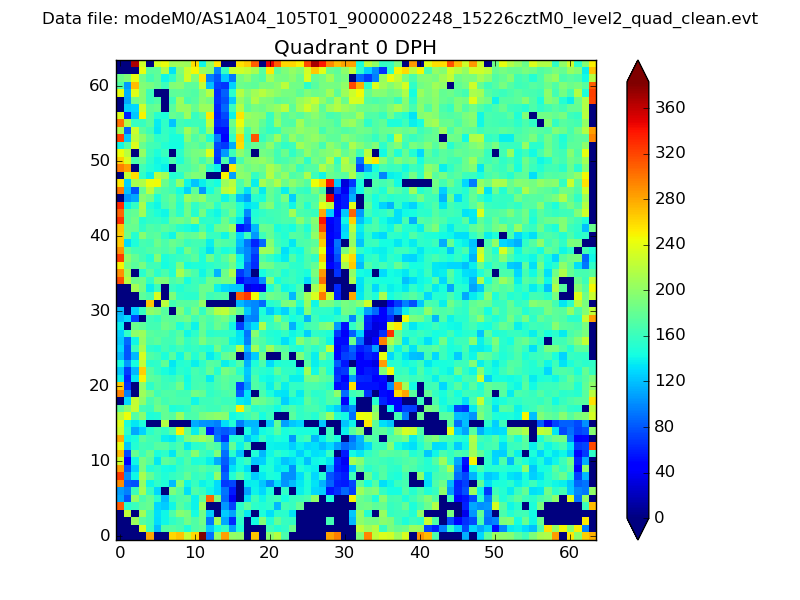 |
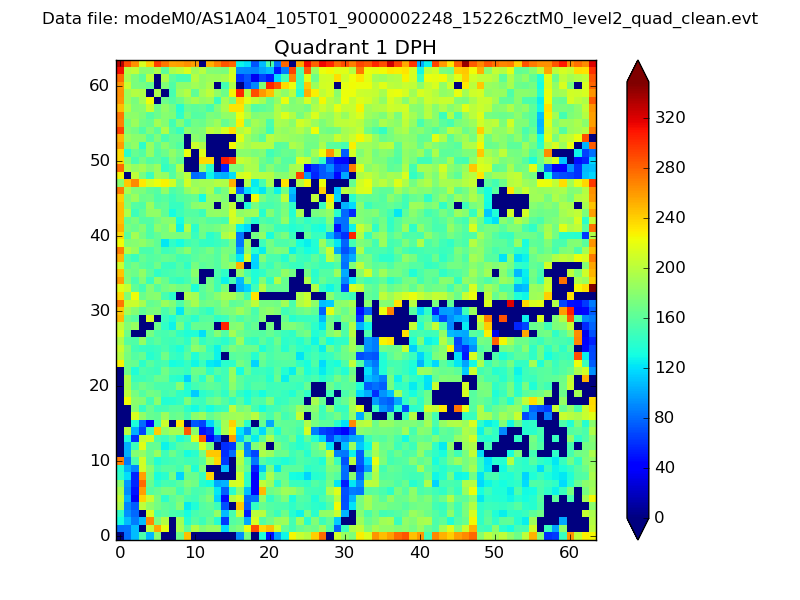 |
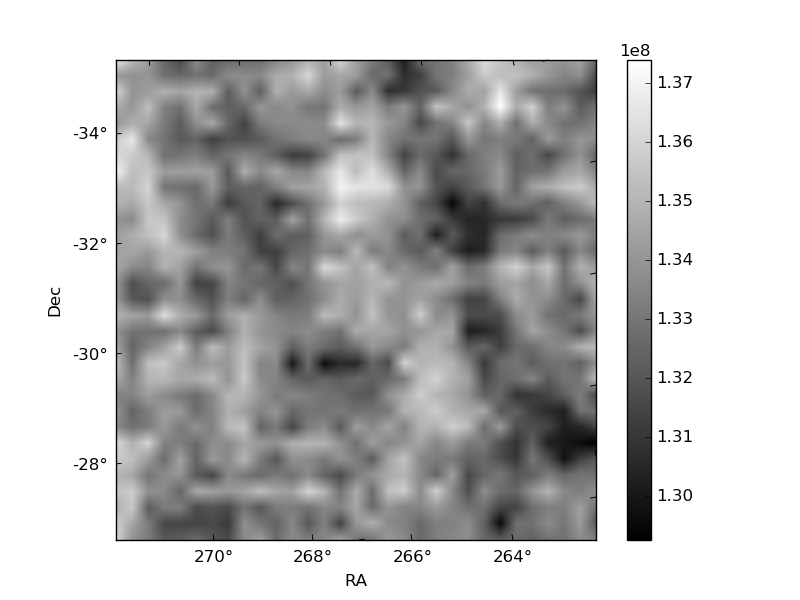
Quadrant B |
|---|---|---|---|
| Quadrant D | 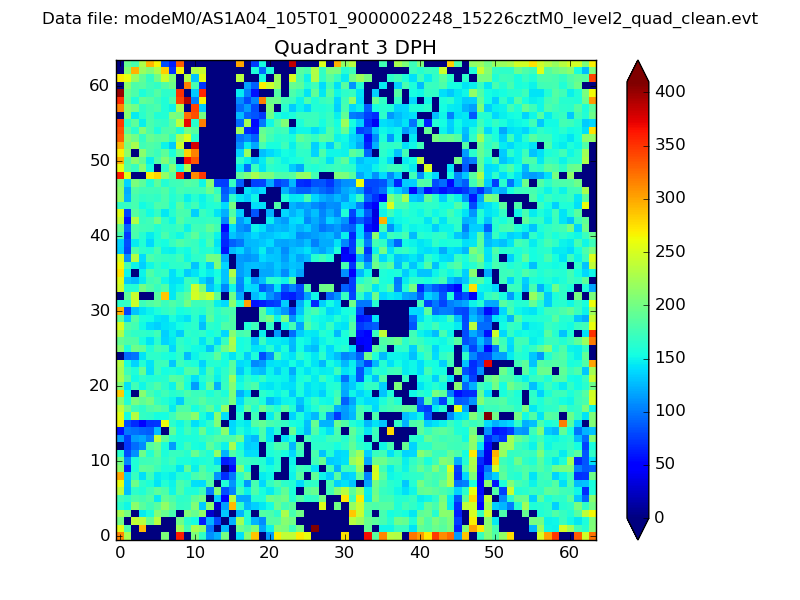 |
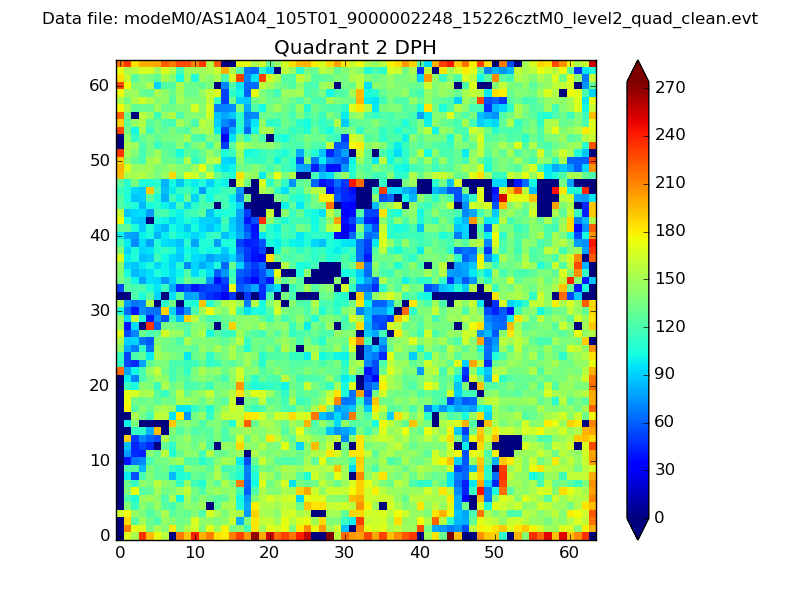 |
Quadrant C |
| Plot type | Count rate plots | Images |
|---|---|---|
| Comparison with Poisson distribution Blue bars denote a histogram of data divided into 1 sec bins. Red curve is a Poisson curve with rate = median count rate of data. |
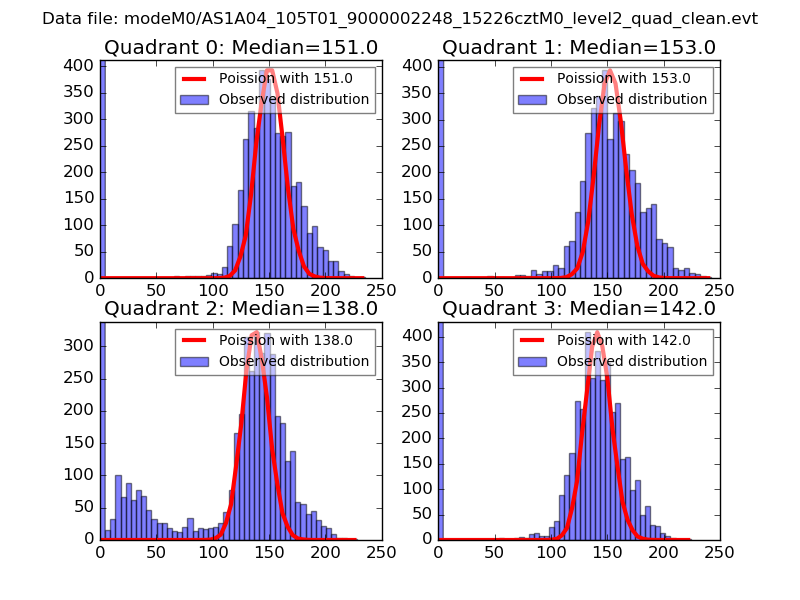 |
 |
| Quadrant-wise count rates Data is divided into 100 sec bins |
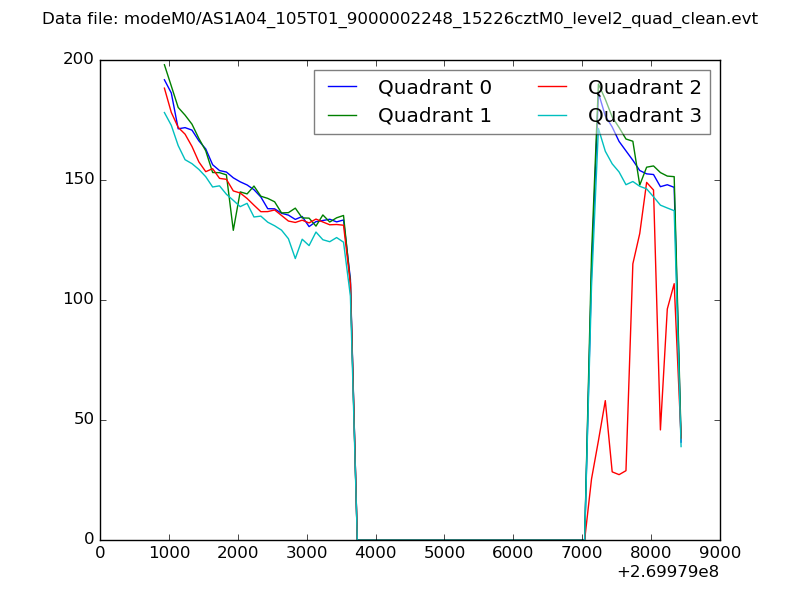 |
|
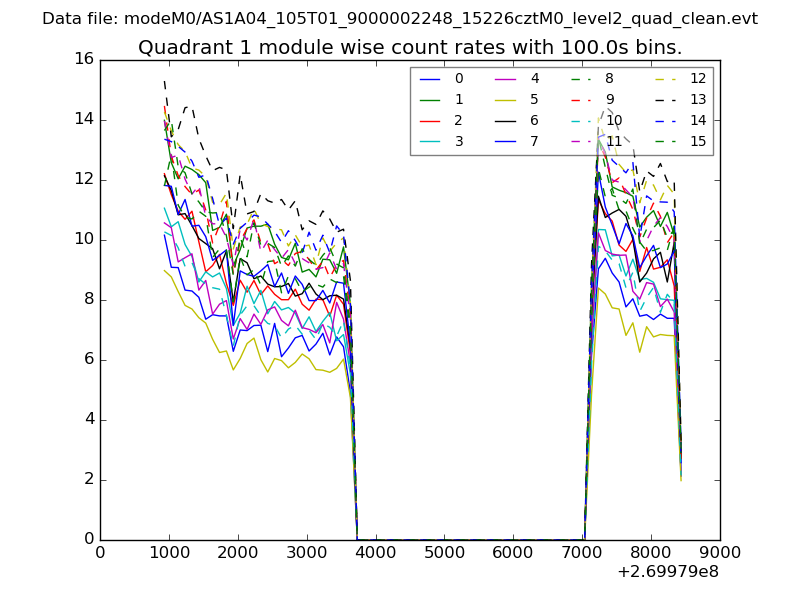
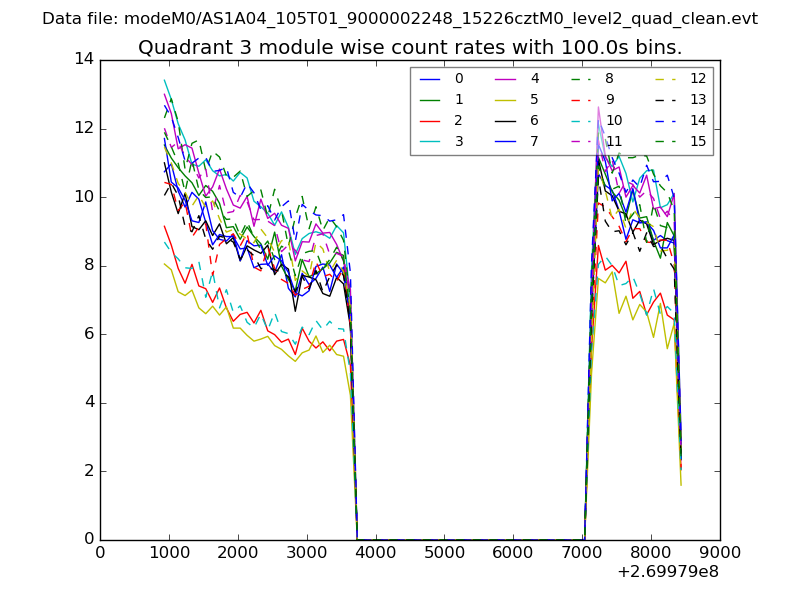
| Module-wise count rates for Quadrant A Data is divided into 100 sec bins |
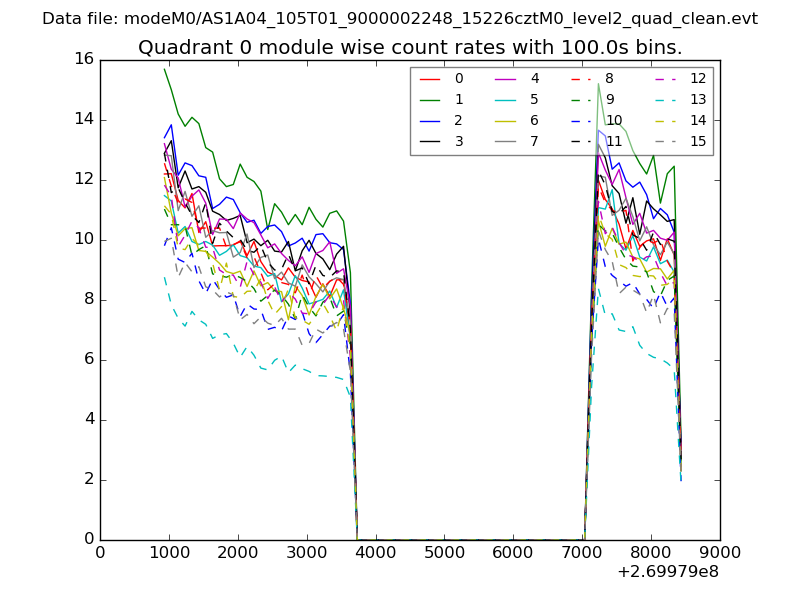 |
 |
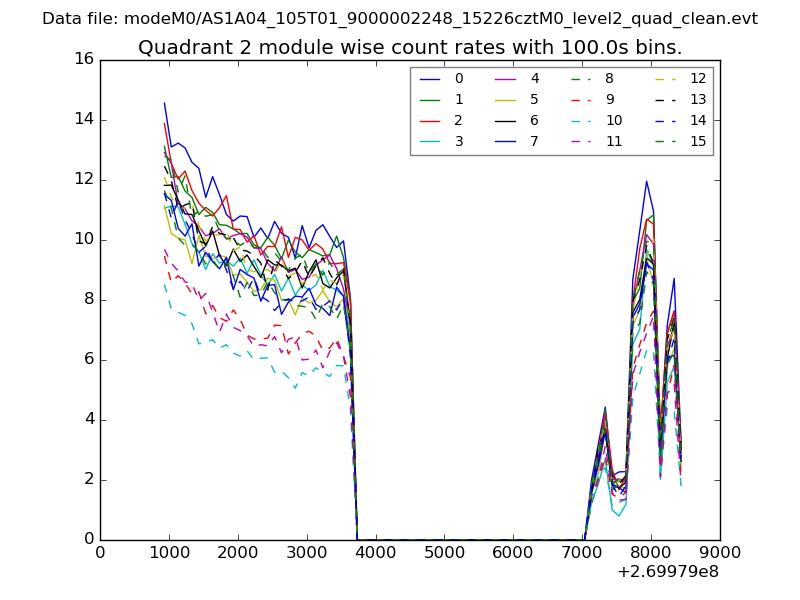
| Module-wise count rates for Quadrant B Data is divided into 100 sec bins |
 |
 |
| Module-wise count rates for Quadrant C Data is divided into 100 sec bins |
 |
 |
| Module-wise count rates for Quadrant D Data is divided into 100 sec bins |
 |
 |
| Parameter | Plot |
|---|---|
| CZT HV Monitor | 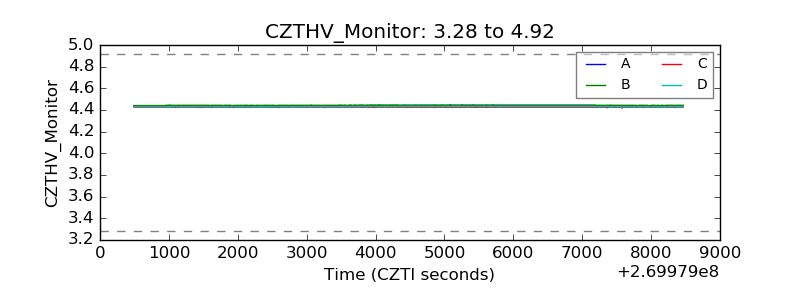 |
| D_VDD | 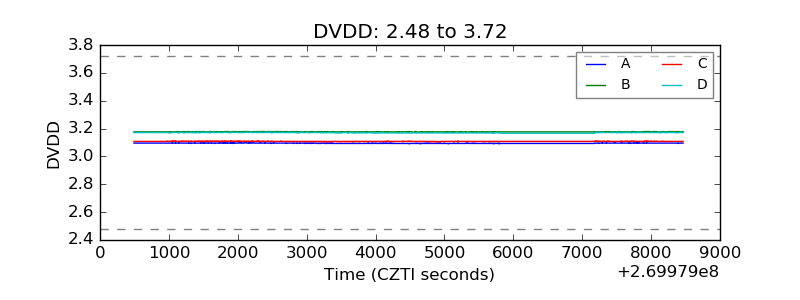 |
| Temperature 1 | 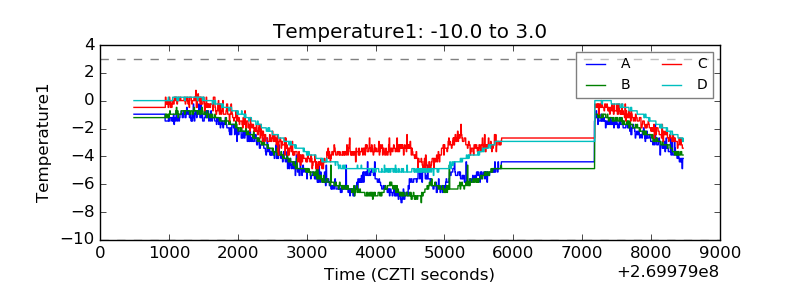 |
| Veto HV Monitor |  |
| Veto LLD | 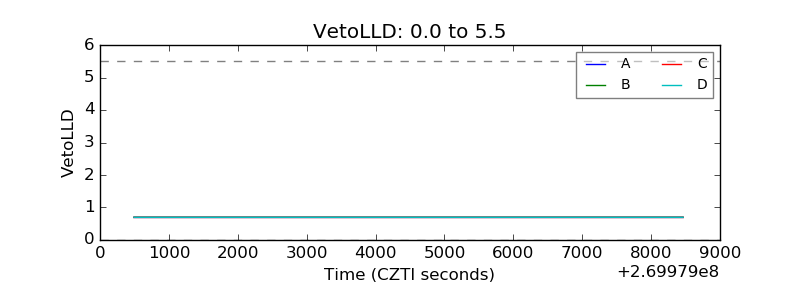 |
| Alpha Counter | 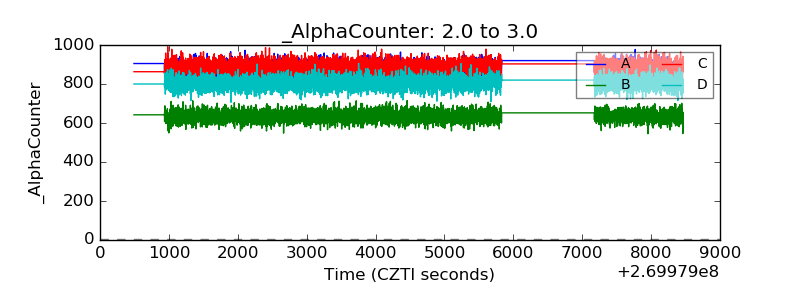 |
| _CPM_Rate |  |
| CZT Counter | 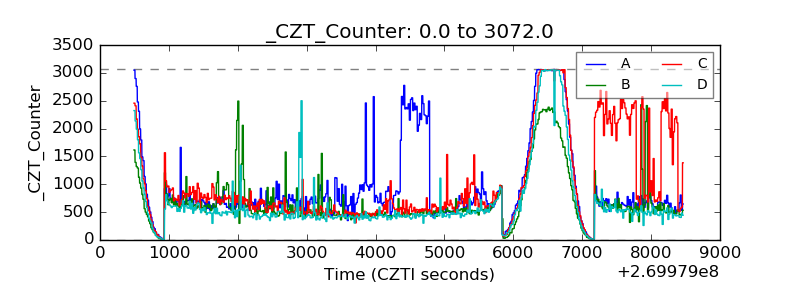 |
| +2.5 Volts monitor |  |
| +5 Volts monitor |  |
| _ROLL_ROT | 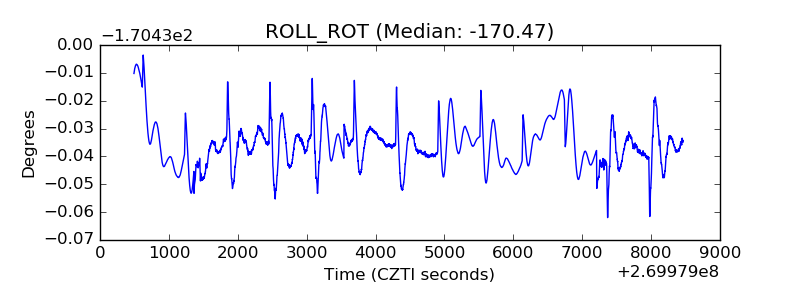 |
| _Roll_DEC |  |
| _Roll_RA | 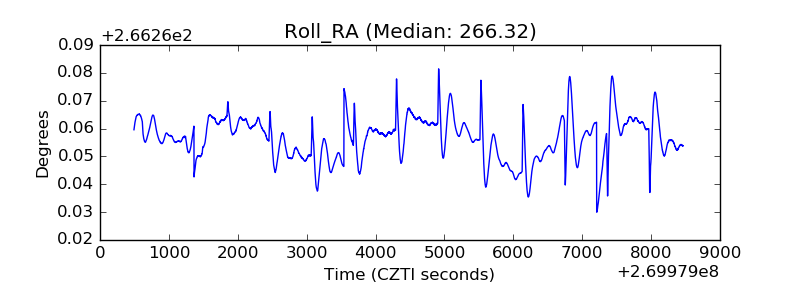 |
| Veto Counter | 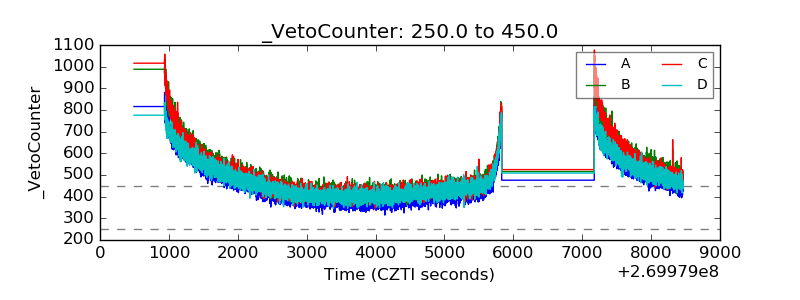 |