| Param | Original file | Final file |
|---|---|---|
| Filename | modeM0/AS1A04_105T01_9000002248_15229cztM0_level2.evt | modeM0/AS1A04_105T01_9000002248_15229cztM0_level2_quad_clean.evt |
| Size (bytes) | 1,174,112,640 | 151,421,760 |
| Size | 1.1 GB | 144.4 MB |
| Events in quadrant A | 15,085,903 | 925,253 |
| Events in quadrant B | 5,918,436 | 995,724 |
| Events in quadrant C | 8,026,604 | 954,163 |
| Events in quadrant D | 5,760,617 | 922,974 |
| Mode M9 | |||
|---|---|---|---|
| Quadrant | BADHDUFLAG | Total packets | Discarded packets |
| A | 0 | 35 | 0 |
| B | 0 | 35 | 0 |
| C | 0 | 35 | 0 |
| D | 0 | 36 | 0 |
| Mode SS | |||
|---|---|---|---|
| Quadrant | BADHDUFLAG | Total packets | Discarded packets |
| A | 0 | 232 | 0 |
| B | 0 | 232 | 0 |
| C | 0 | 232 | 0 |
| D | 0 | 232 | 0 |
| Mode M0 | |||
|---|---|---|---|
| Quadrant | BADHDUFLAG | Total packets | Discarded packets |
| A | 0 | 52491 | 4 |
| B | 0 | 24804 | 3 |
| C | 0 | 31411 | 3 |
| D | 0 | 25142 | 3 |
| Quadrant | Total seconds | Saturated seconds | Saturation percentage |
|---|---|---|---|
| A | 11379 | 2707 | 23.789437% |
| B | 11379 | 93 | 0.817295% |
| C | 11379 | 451 | 3.963441% |
| D | 11379 | 45 | 0.395465% |
Noise dominated data is calculated using 1-second bins in cleaned event files. If a bin has >2000 counts, and if more than 50% of those come from <1% of pixels, then it is considered to be noise-dominated and hence unusable.
| Quadrant | # 1 sec bins | Bins with >0 counts | Bins with >2000 counts | High rate bins dominated by noise | Noise dominated (total time) | Noise dominated (detector-on time) | Marked lightcurve |
|---|---|---|---|---|---|---|---|
| A | 13800 | 11382 | 2724 | 2724 | 19.74% | 23.93% | 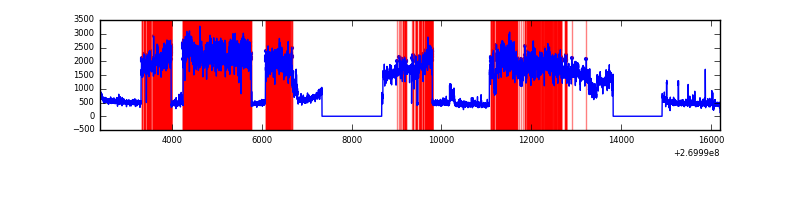 |
| B | 13800 | 11382 | 16 | 16 | 0.12% | 0.14% | 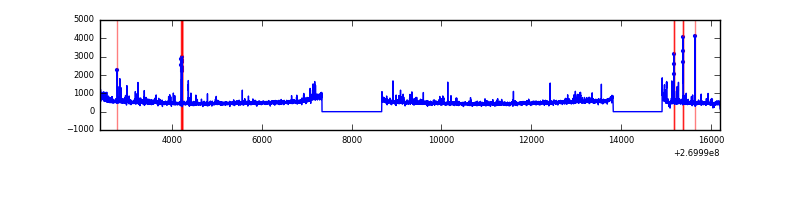 |
| C | 13800 | 11382 | 401 | 401 | 2.91% | 3.52% | 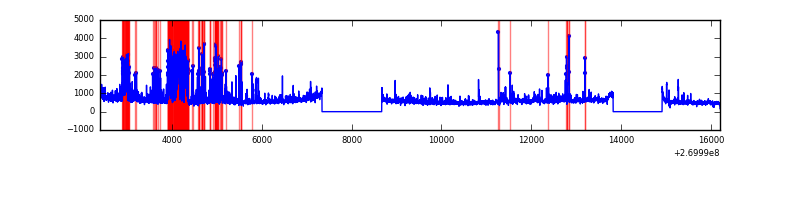 |
| D | 13800 | 11382 | 26 | 26 | 0.19% | 0.23% | 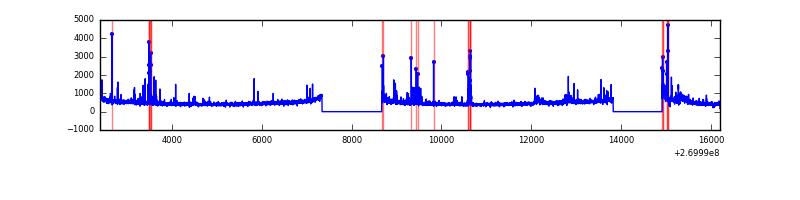 |
Top three noisy pixels from each quadrant. If the there are fewer than three noisy pixels in the level2.evt file, extra rows are filled as -1
| Pixel properties | Quadrant properties | ||||||
|---|---|---|---|---|---|---|---|
| Quadrant | DetID | PixID | Counts | Sigma | Mean | Median | Sigma |
| A | 0 | 253 | 9720940 | 35703.99 | 1348 | 1322 | 272.2 |
| A | 12 | 189 | 176834 | 644.72 | 1348 | 1322 | 272.2 |
| A | 0 | 226 | 12004 | 39.24 | 1348 | 1322 | 272.2 |
| B | 0 | 189 | 95458 | 354.95 | 1414 | 1382 | 265.0 |
| B | 3 | 64 | 92901 | 345.31 | 1414 | 1382 | 265.0 |
| B | 10 | 245 | 45430 | 166.2 | 1414 | 1382 | 265.0 |
| C | 3 | 233 | 2492662 | 8101.6 | 1341 | 1352 | 307.5 |
| C | 4 | 254 | 203957 | 658.86 | 1341 | 1352 | 307.5 |
| C | 7 | 247 | 56577 | 179.59 | 1341 | 1352 | 307.5 |
| D | 2 | 16 | 313887 | 948.21 | 1348 | 1306 | 329.7 |
| D | 7 | 38 | 135770 | 407.89 | 1348 | 1306 | 329.7 |
| D | 13 | 172 | 86559 | 258.61 | 1348 | 1306 | 329.7 |
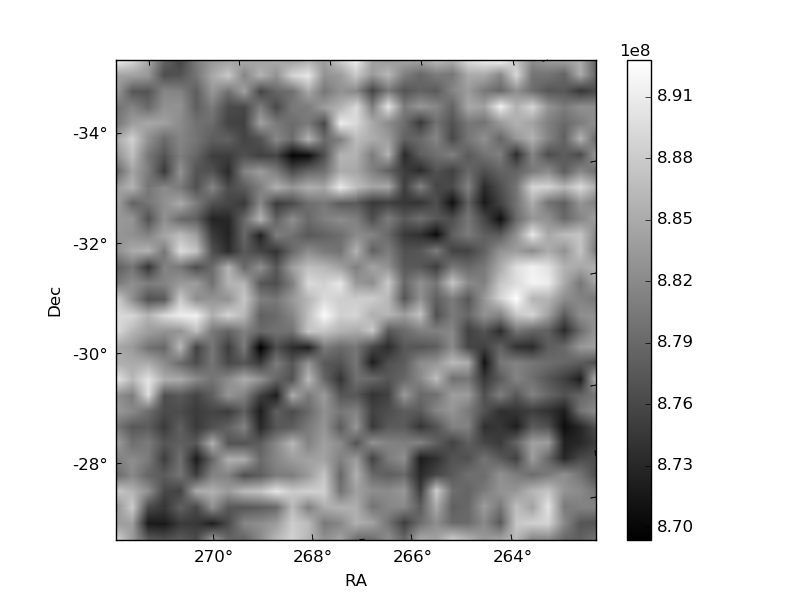
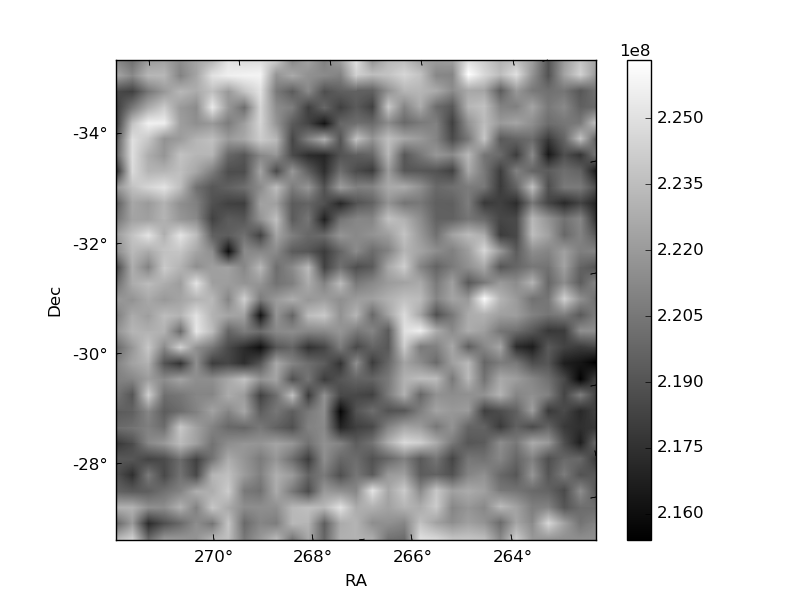
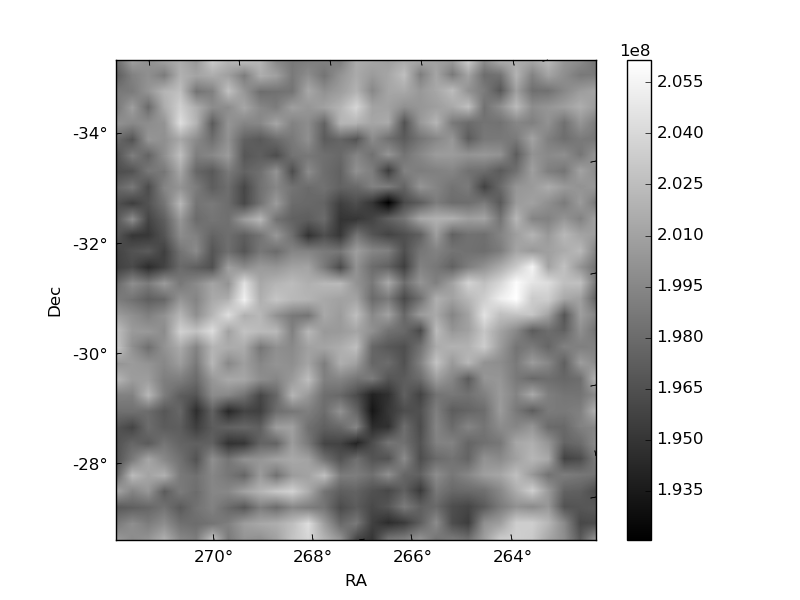
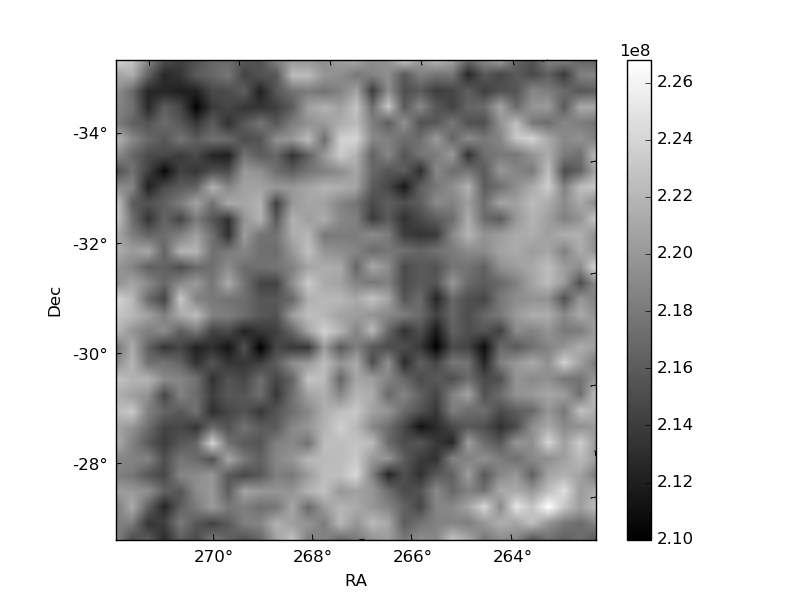
Histogram calculated using DETX and DETY for each event in the final _common_clean file
| Quadrant A | 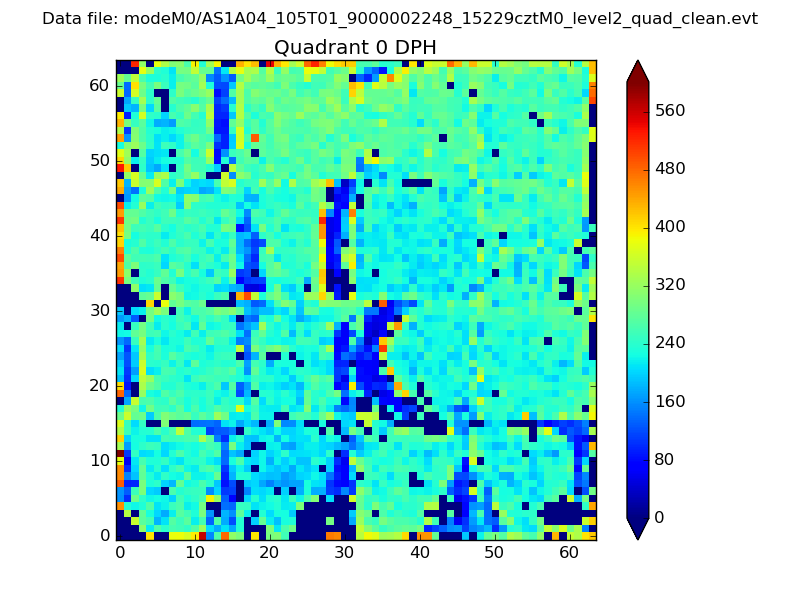 |
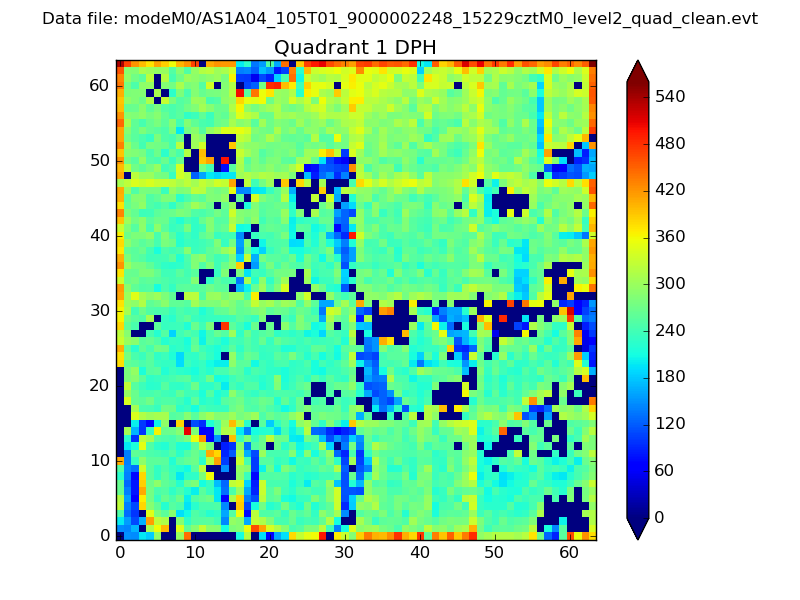 |
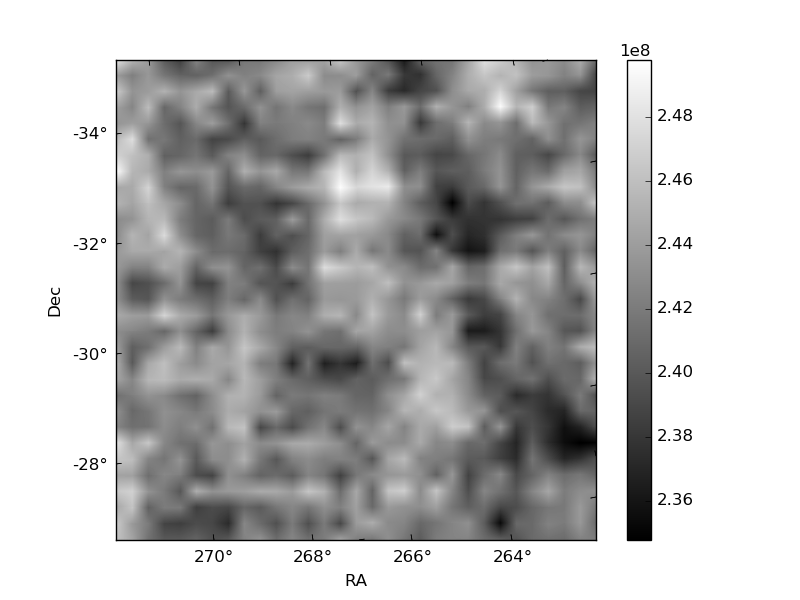
Quadrant B |
|---|---|---|---|
| Quadrant D | 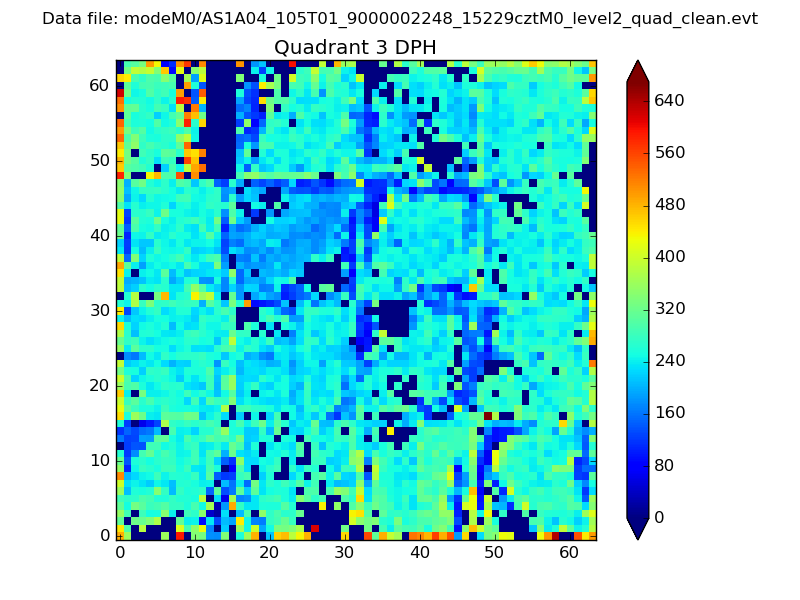 |
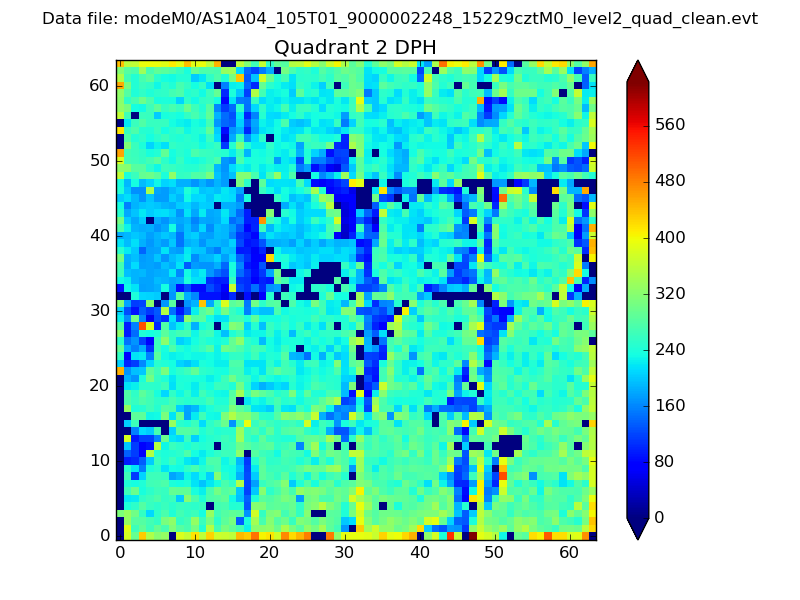 |
Quadrant C |
| Plot type | Count rate plots | Images |
|---|---|---|
| Comparison with Poisson distribution Blue bars denote a histogram of data divided into 1 sec bins. Red curve is a Poisson curve with rate = median count rate of data. |
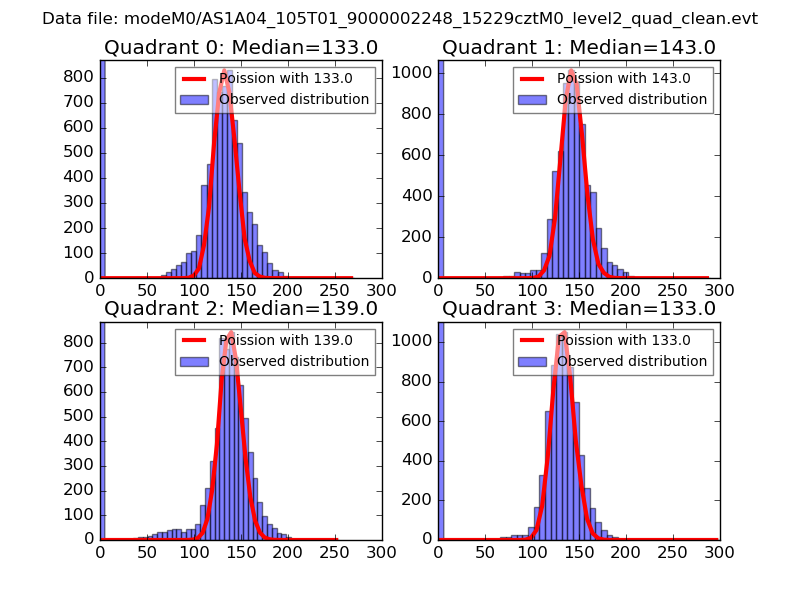 |
 |
| Quadrant-wise count rates Data is divided into 100 sec bins |
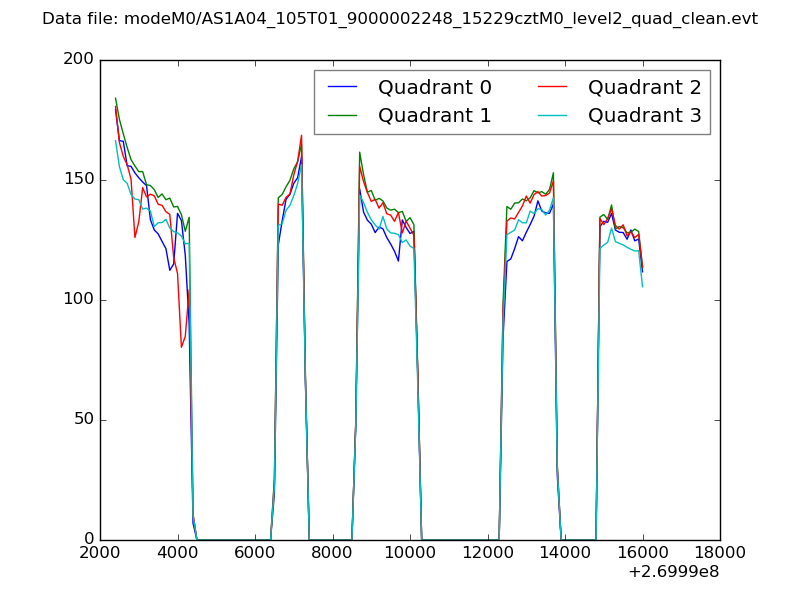 |
|
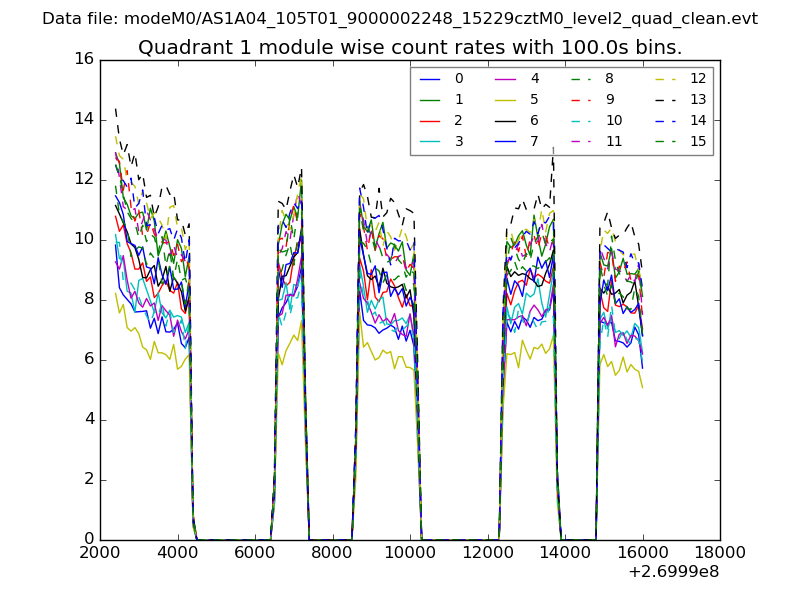
| Module-wise count rates for Quadrant A Data is divided into 100 sec bins |
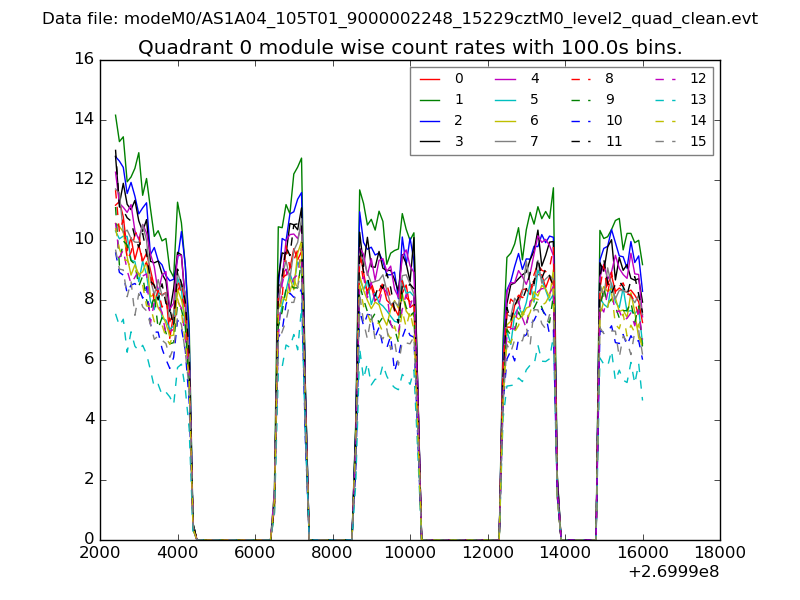 |
 |
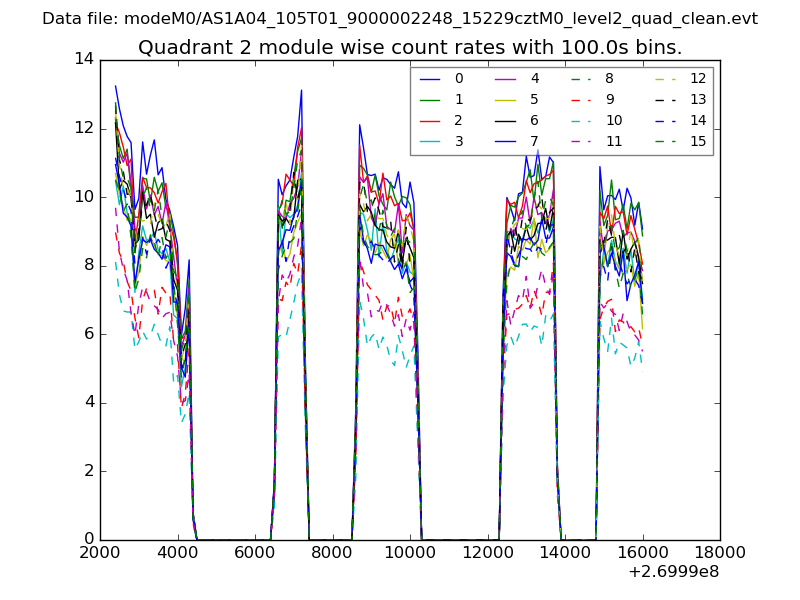
| Module-wise count rates for Quadrant B Data is divided into 100 sec bins |
 |
 |
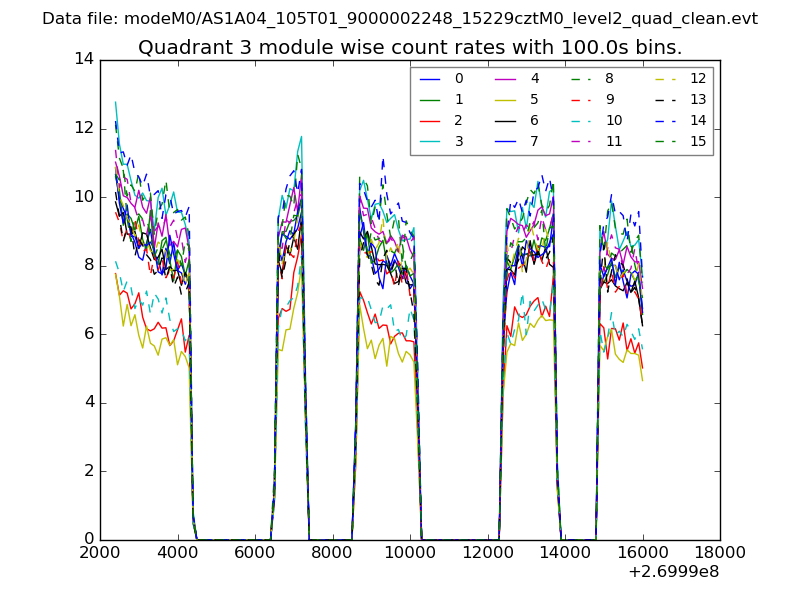
| Module-wise count rates for Quadrant C Data is divided into 100 sec bins |
 |
 |
| Module-wise count rates for Quadrant D Data is divided into 100 sec bins |
 |
 |
| Parameter | Plot |
|---|---|
| CZT HV Monitor | 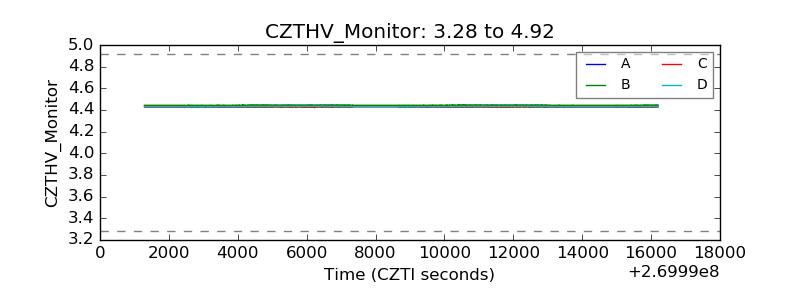 |
| D_VDD | 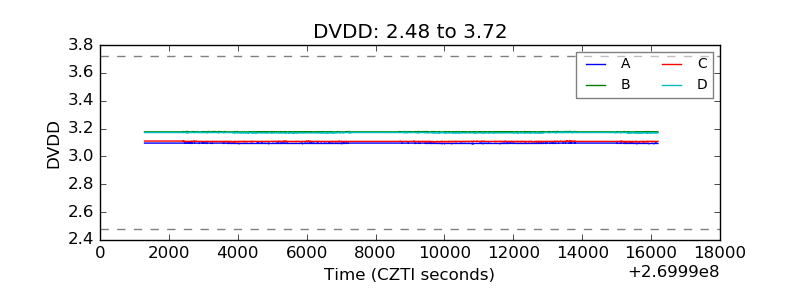 |
| Temperature 1 | 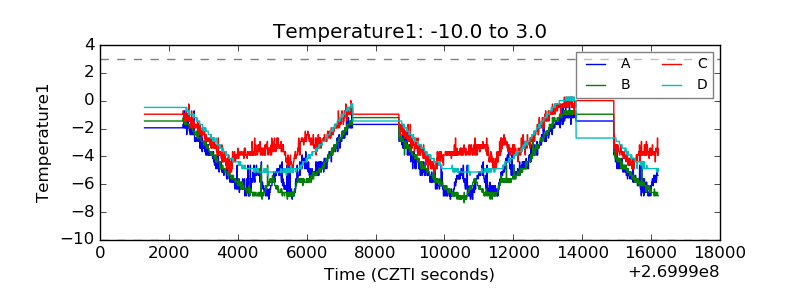 |
| Veto HV Monitor |  |
| Veto LLD | 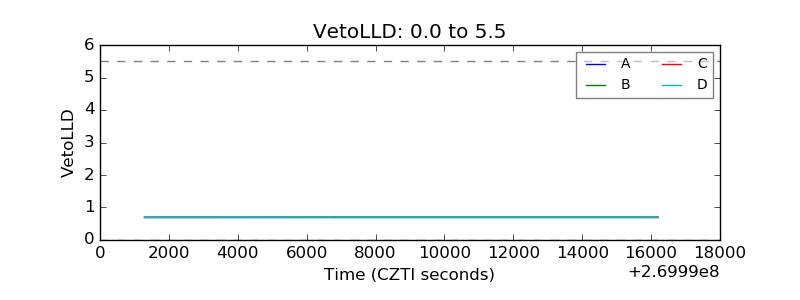 |
| Alpha Counter | 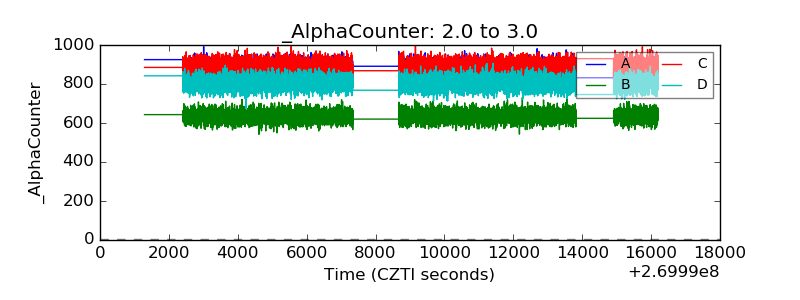 |
| _CPM_Rate |  |
| CZT Counter | 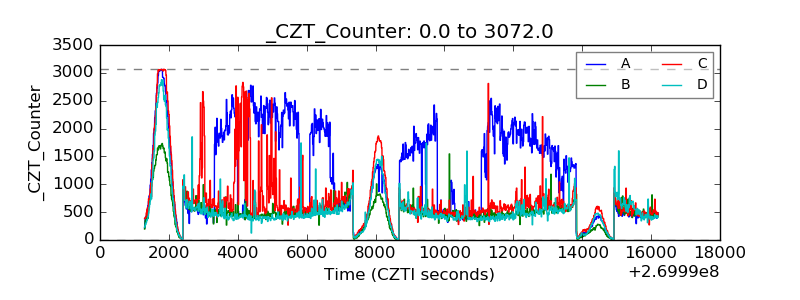 |
| +2.5 Volts monitor |  |
| +5 Volts monitor |  |
| _ROLL_ROT | 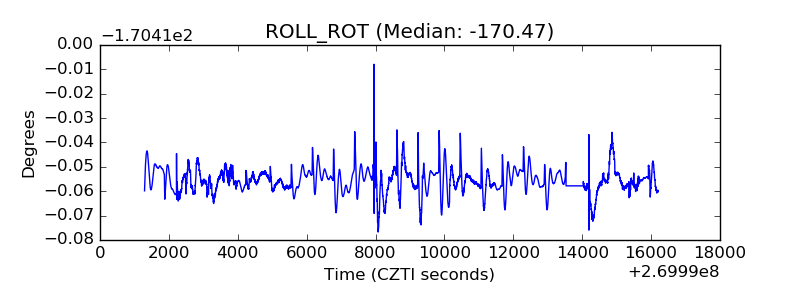 |
| _Roll_DEC | 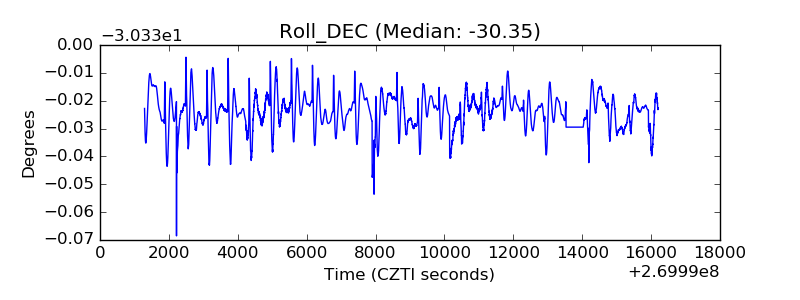 |
| _Roll_RA | 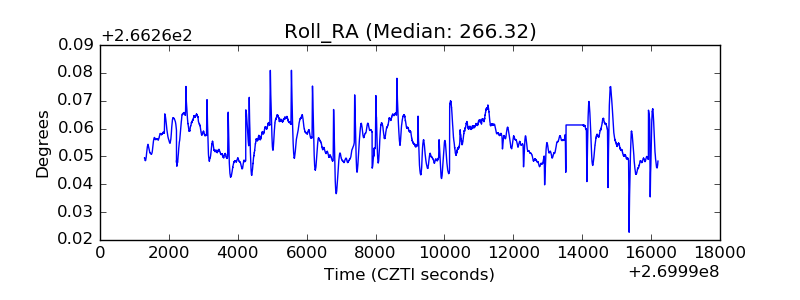 |
| Veto Counter | 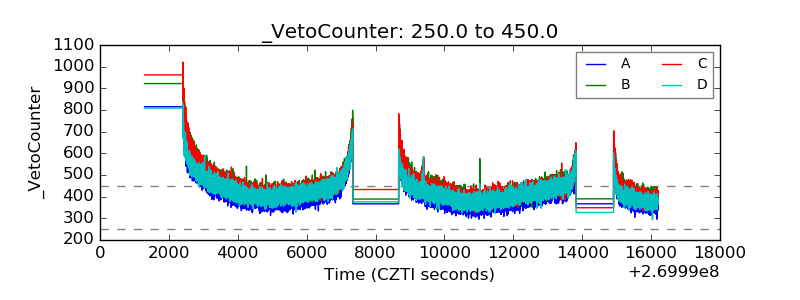 |