| Param | Original file | Final file |
|---|---|---|
| Filename | modeM0/AS1A04_105T01_9000002248_15230cztM0_level2.evt | modeM0/AS1A04_105T01_9000002248_15230cztM0_level2_quad_clean.evt |
| Size (bytes) | 499,867,200 | 87,586,560 |
| Size | 476.7 MB | 83.5 MB |
| Events in quadrant A | 3,983,446 | 542,300 |
| Events in quadrant B | 3,547,891 | 559,143 |
| Events in quadrant C | 3,652,573 | 551,321 |
| Events in quadrant D | 3,490,972 | 523,489 |
| Mode M9 | |||
|---|---|---|---|
| Quadrant | BADHDUFLAG | Total packets | Discarded packets |
| A | 0 | 11 | 0 |
| B | 0 | 11 | 0 |
| C | 0 | 11 | 0 |
| D | 0 | 12 | 0 |
| Mode SS | |||
|---|---|---|---|
| Quadrant | BADHDUFLAG | Total packets | Discarded packets |
| A | 0 | 138 | 0 |
| B | 0 | 138 | 0 |
| C | 0 | 138 | 0 |
| D | 0 | 138 | 0 |
| Mode M0 | |||
|---|---|---|---|
| Quadrant | BADHDUFLAG | Total packets | Discarded packets |
| A | 0 | 16337 | 3 |
| B | 0 | 14848 | 2 |
| C | 0 | 15024 | 2 |
| D | 0 | 15292 | 2 |
| Quadrant | Total seconds | Saturated seconds | Saturation percentage |
|---|---|---|---|
| A | 6834 | 175 | 2.560726% |
| B | 6834 | 44 | 0.643840% |
| C | 6834 | 24 | 0.351185% |
| D | 6834 | 43 | 0.629207% |
Noise dominated data is calculated using 1-second bins in cleaned event files. If a bin has >2000 counts, and if more than 50% of those come from <1% of pixels, then it is considered to be noise-dominated and hence unusable.
| Quadrant | # 1 sec bins | Bins with >0 counts | Bins with >2000 counts | High rate bins dominated by noise | Noise dominated (total time) | Noise dominated (detector-on time) | Marked lightcurve |
|---|---|---|---|---|---|---|---|
| A | 7510 | 6835 | 61 | 61 | 0.81% | 0.89% | 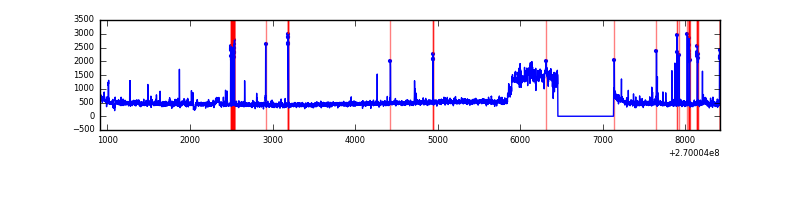 |
| B | 7510 | 6836 | 17 | 17 | 0.23% | 0.25% | 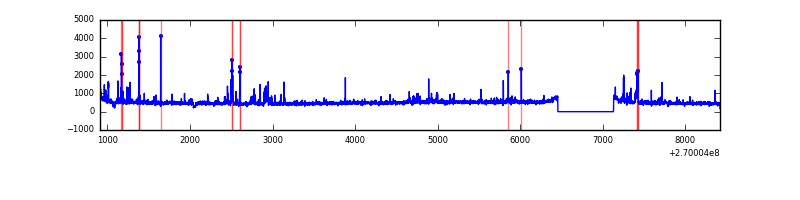 |
| C | 7510 | 6836 | 0 | 0 | 0.00% | 0.00% | 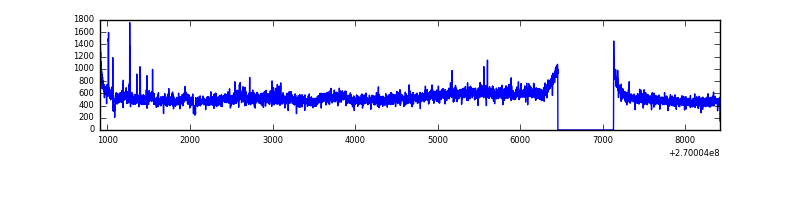 |
| D | 7510 | 6836 | 17 | 17 | 0.23% | 0.25% | 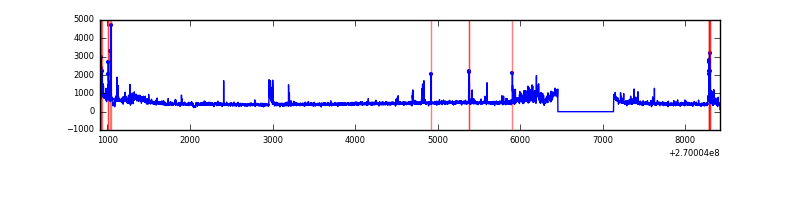 |
Top three noisy pixels from each quadrant. If the there are fewer than three noisy pixels in the level2.evt file, extra rows are filled as -1
| Pixel properties | Quadrant properties | ||||||
|---|---|---|---|---|---|---|---|
| Quadrant | DetID | PixID | Counts | Sigma | Mean | Median | Sigma |
| A | 0 | 253 | 704458 | 4246.04 | 809 | 794 | 165.7 |
| A | 12 | 189 | 150732 | 904.75 | 809 | 794 | 165.7 |
| A | 9 | 143 | 10407 | 58.01 | 809 | 794 | 165.7 |
| B | 0 | 229 | 98417 | 626.78 | 819 | 798 | 155.7 |
| B | 0 | 189 | 69410 | 440.54 | 819 | 798 | 155.7 |
| B | 10 | 245 | 53475 | 338.22 | 819 | 798 | 155.7 |
| C | 3 | 233 | 556099 | 3040.15 | 789 | 793 | 182.7 |
| C | 7 | 247 | 9991 | 50.36 | 789 | 793 | 182.7 |
| C | 10 | 22 | 7416 | 36.26 | 789 | 793 | 182.7 |
| D | 2 | 16 | 327214 | 1694.27 | 785 | 759 | 192.7 |
| D | 2 | 33 | 65118 | 334.02 | 785 | 759 | 192.7 |
| D | 13 | 172 | 50003 | 255.57 | 785 | 759 | 192.7 |
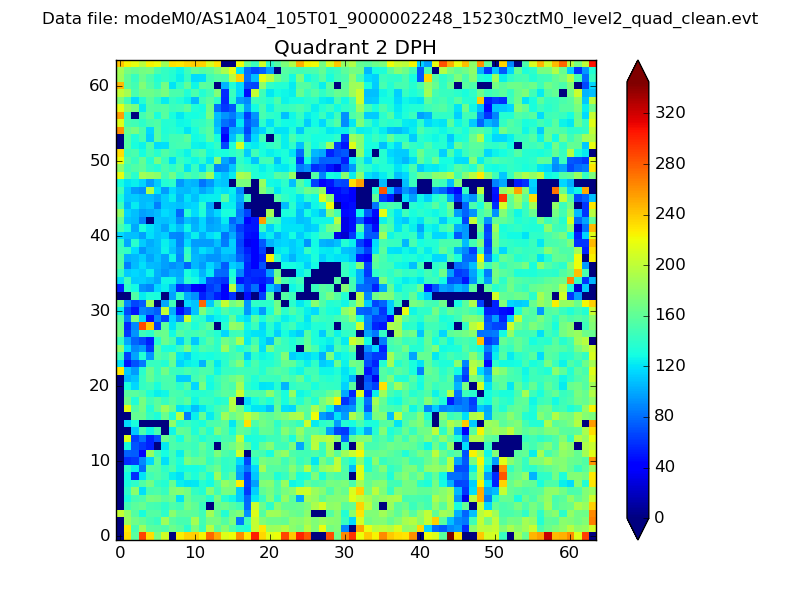
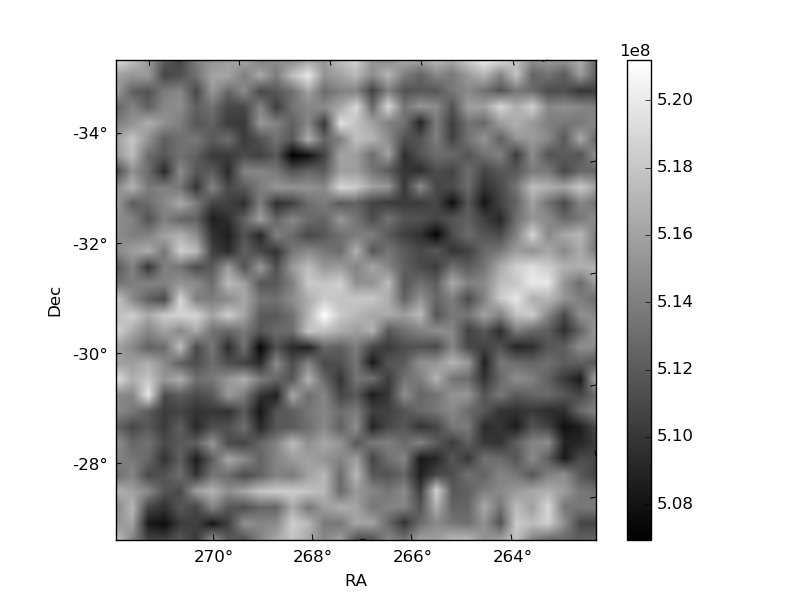
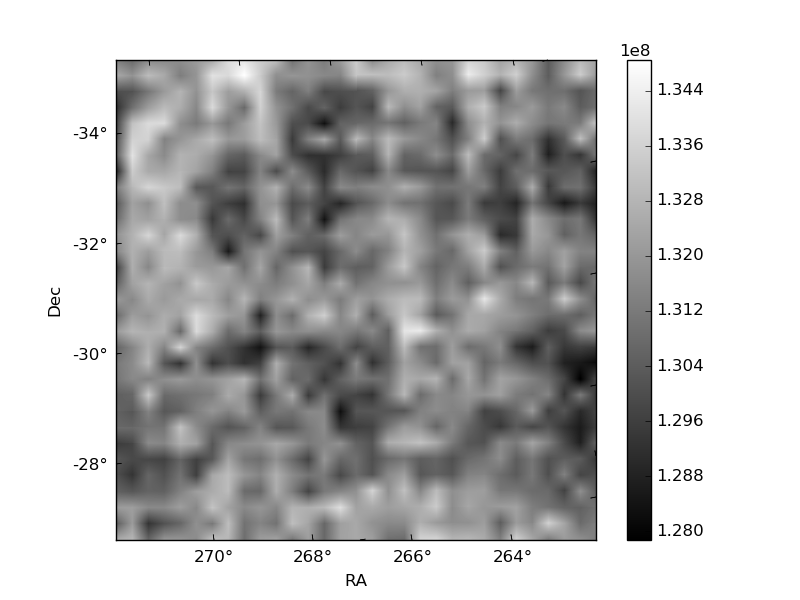
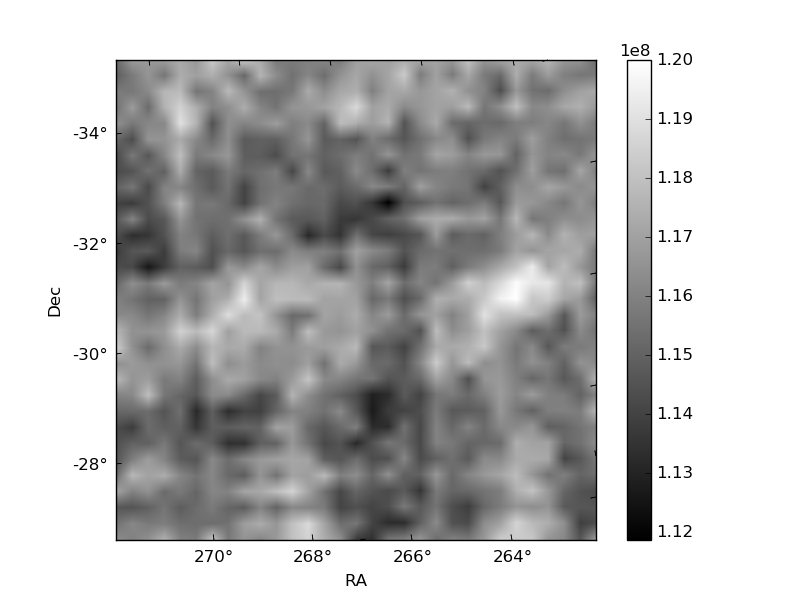
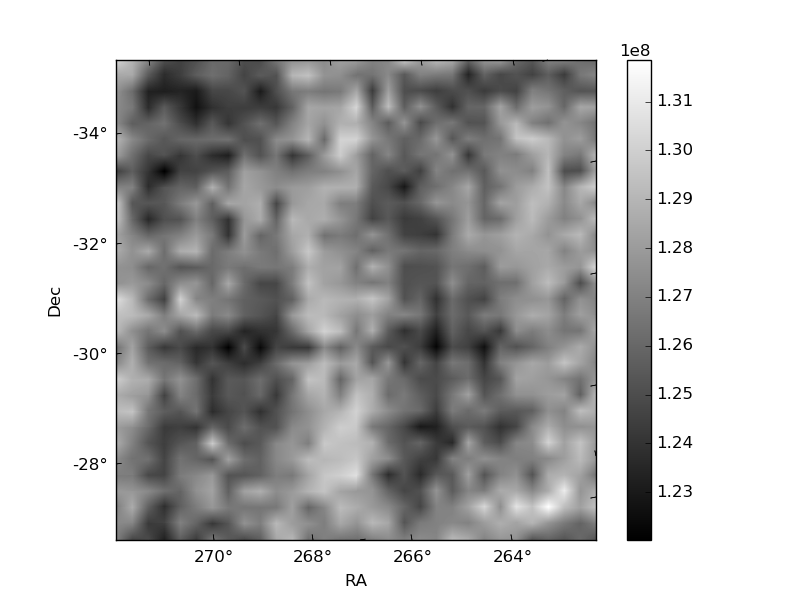
Histogram calculated using DETX and DETY for each event in the final _common_clean file
| Quadrant A | 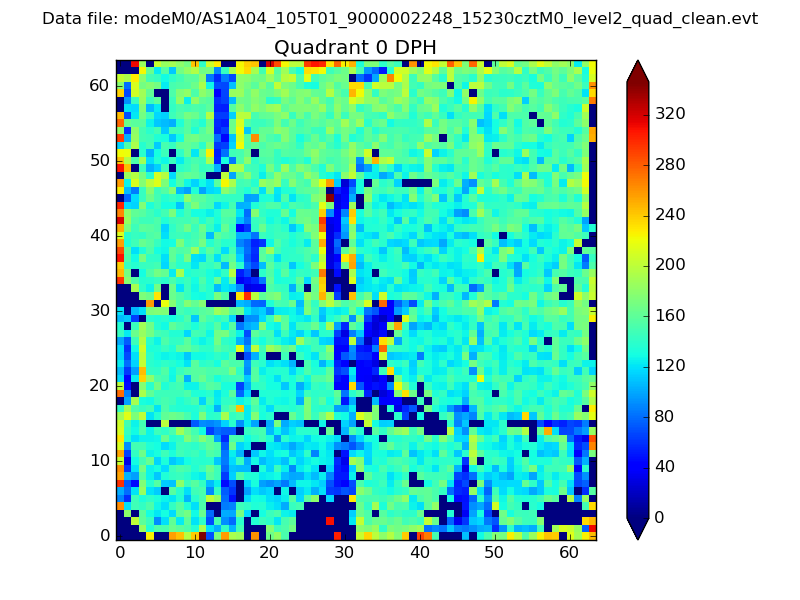 |
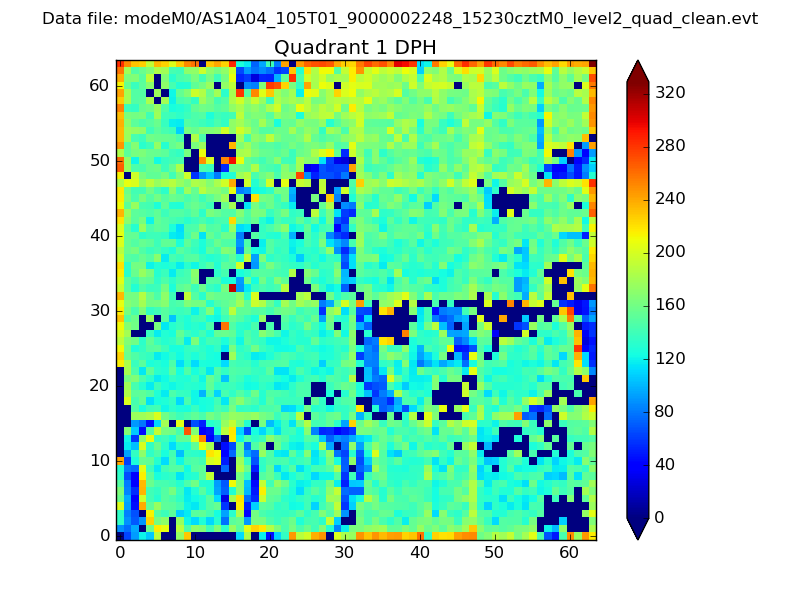 |
Quadrant B |
|---|---|---|---|
| Quadrant D | 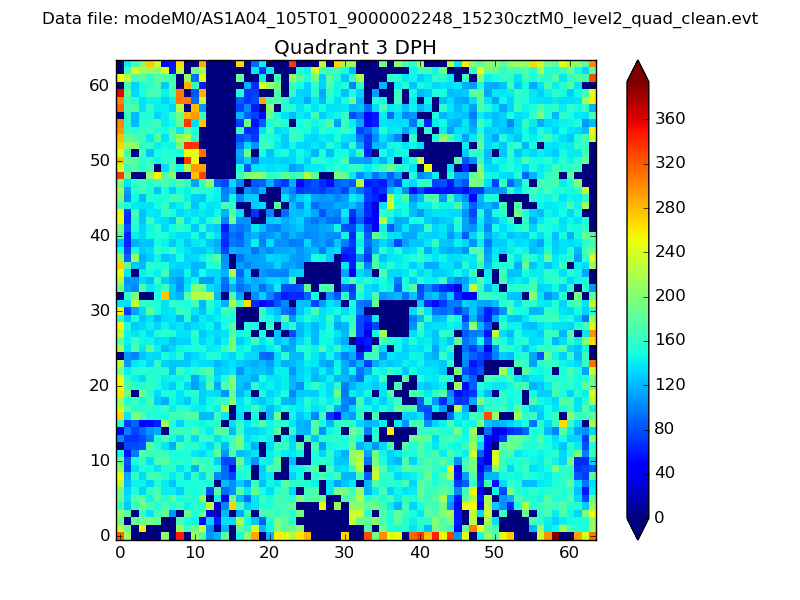 |
 |
Quadrant C |
| Plot type | Count rate plots | Images |
|---|---|---|
| Comparison with Poisson distribution Blue bars denote a histogram of data divided into 1 sec bins. Red curve is a Poisson curve with rate = median count rate of data. |
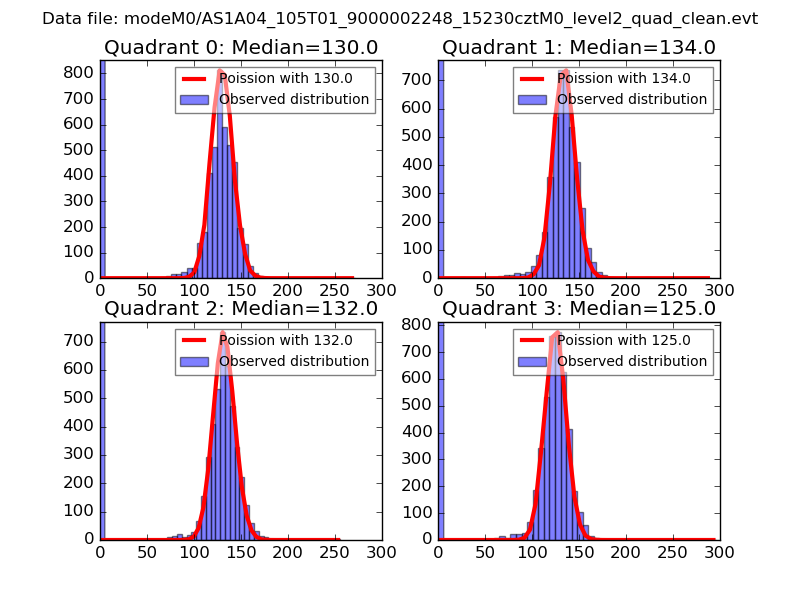 |
 |
| Quadrant-wise count rates Data is divided into 100 sec bins |
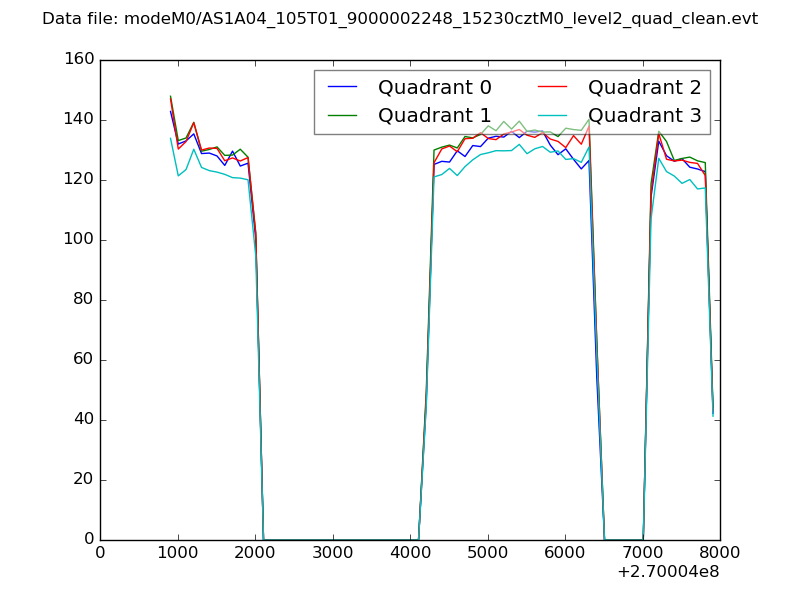 |
|
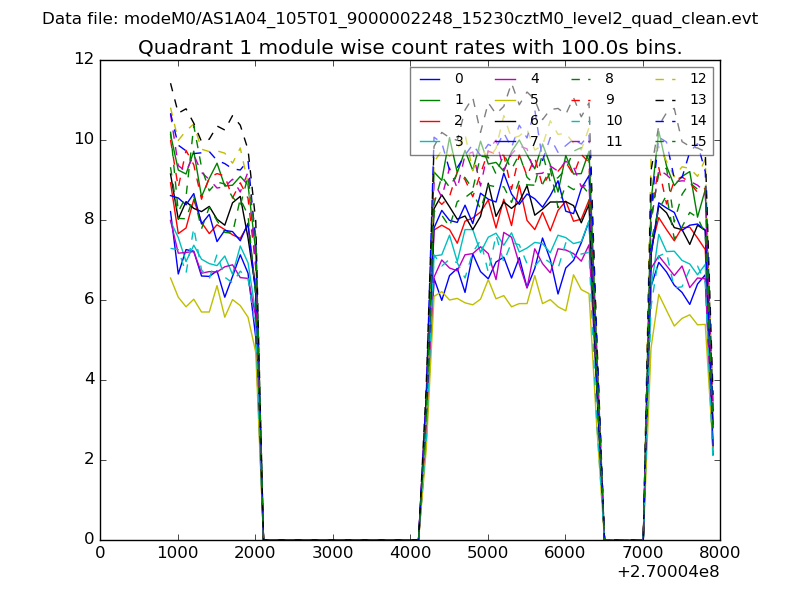
| Module-wise count rates for Quadrant A Data is divided into 100 sec bins |
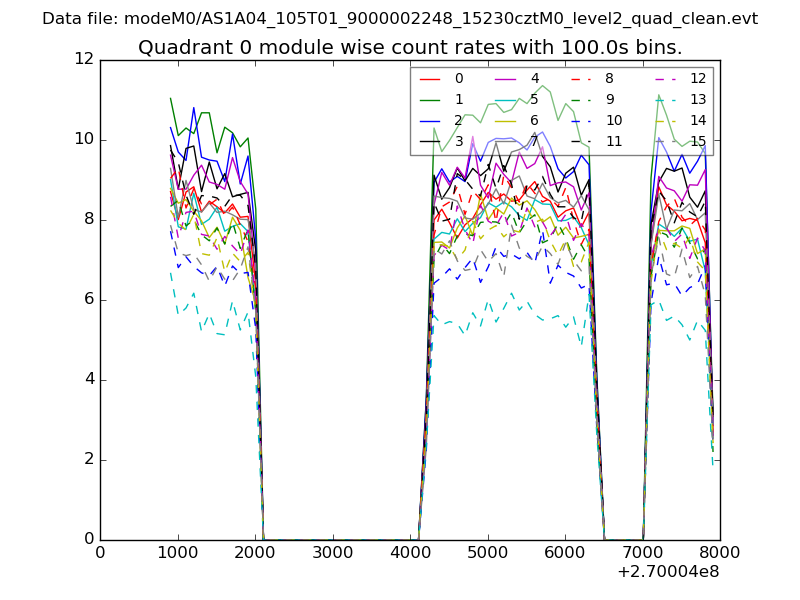 |
 |
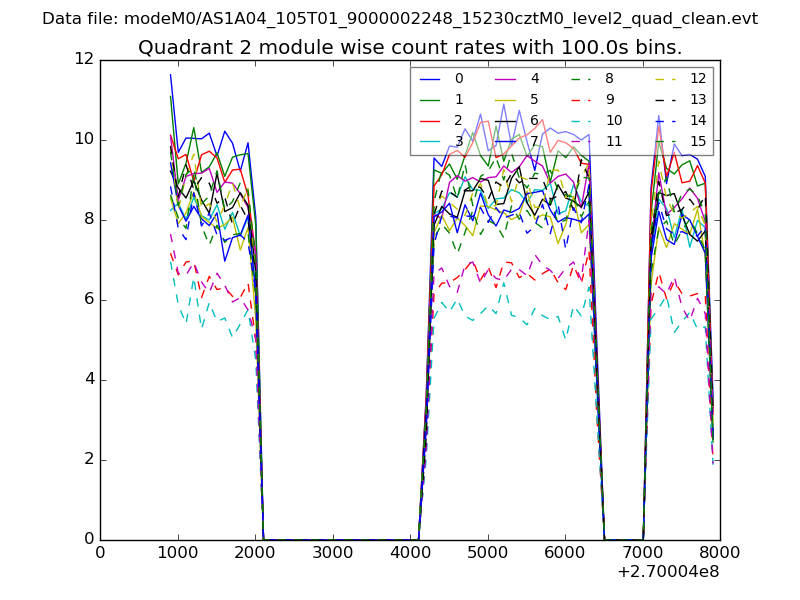
| Module-wise count rates for Quadrant B Data is divided into 100 sec bins |
 |
 |
| Module-wise count rates for Quadrant C Data is divided into 100 sec bins |
 |
 |
| Module-wise count rates for Quadrant D Data is divided into 100 sec bins |
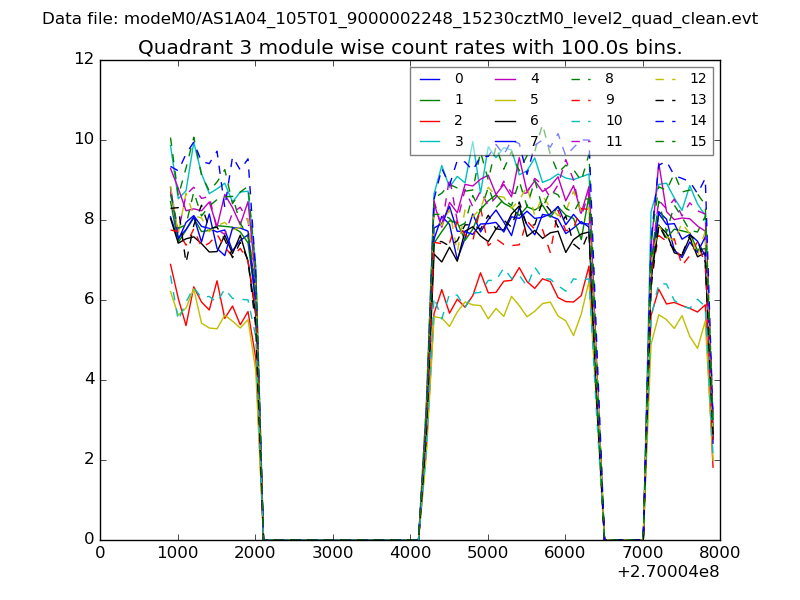 |
 |
| Parameter | Plot |
|---|---|
| CZT HV Monitor | 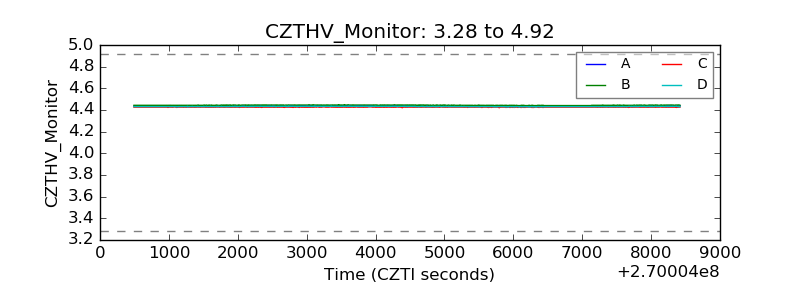 |
| D_VDD | 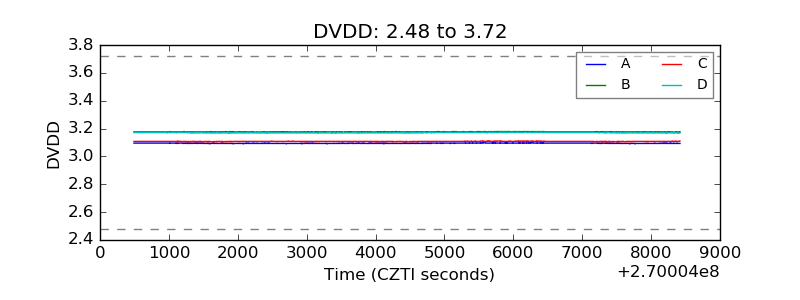 |
| Temperature 1 | 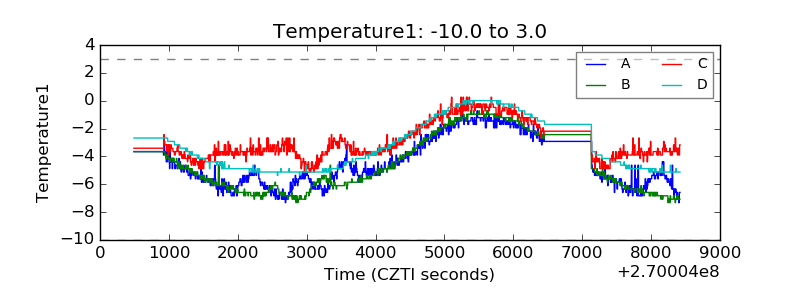 |
| Veto HV Monitor | 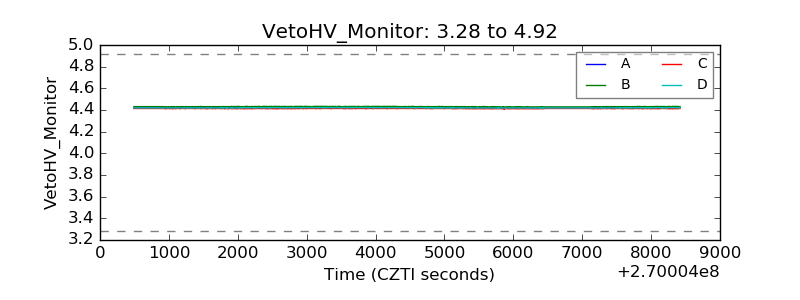 |
| Veto LLD | 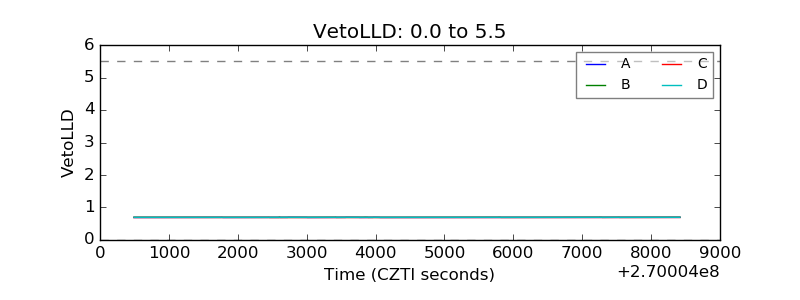 |
| Alpha Counter | 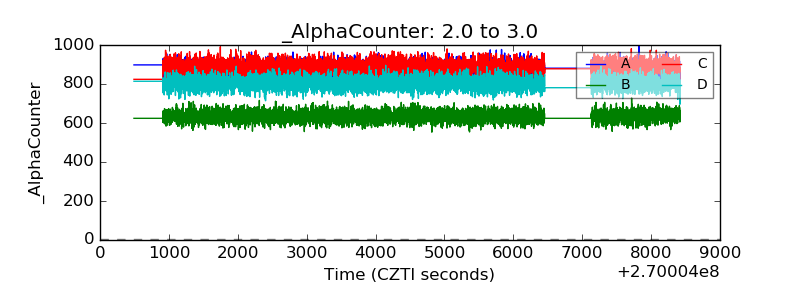 |
| _CPM_Rate | 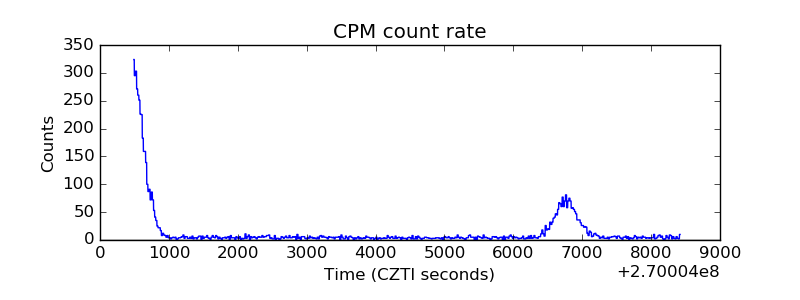 |
| CZT Counter | 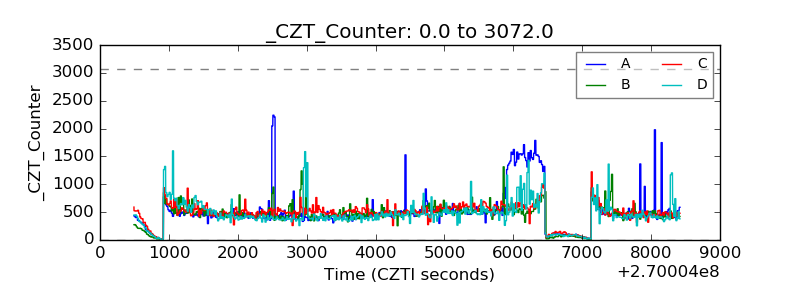 |
| +2.5 Volts monitor |  |
| +5 Volts monitor |  |
| _ROLL_ROT | 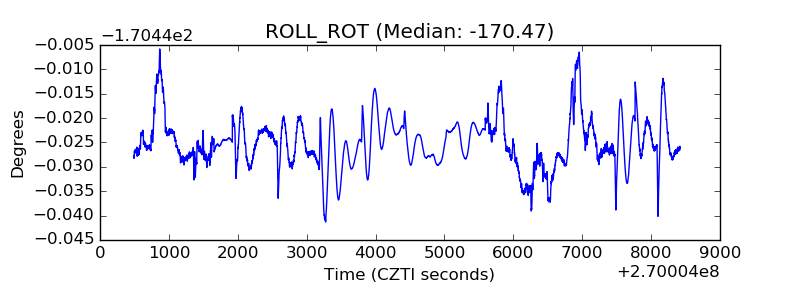 |
| _Roll_DEC | 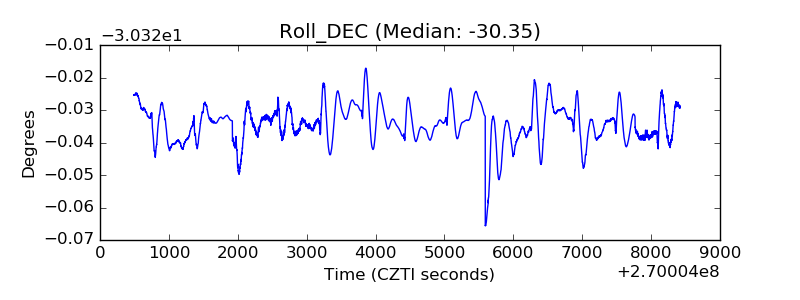 |
| _Roll_RA | 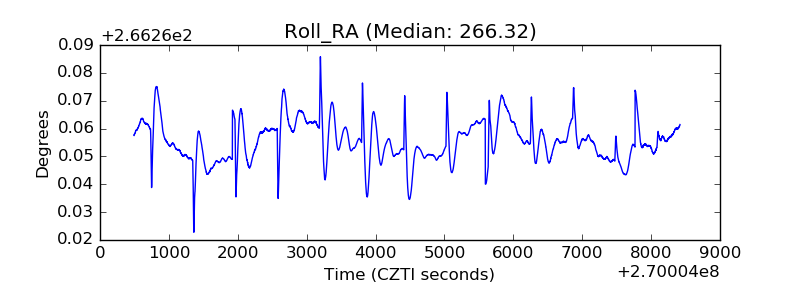 |
| Veto Counter | 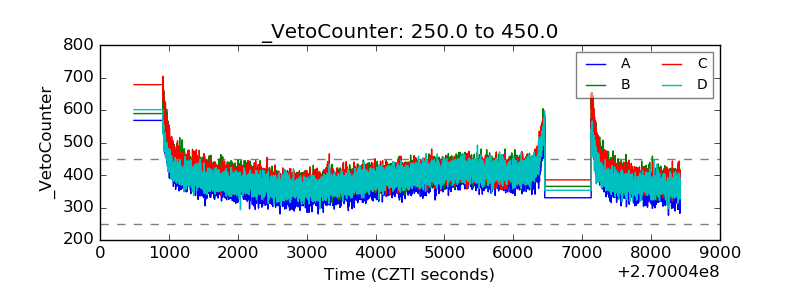 |