| Param | Original file | Final file |
|---|---|---|
| Filename | modeM0/AS1A04_105T01_9000002248_15231cztM0_level2.evt | modeM0/AS1A04_105T01_9000002248_15231cztM0_level2_quad_clean.evt |
| Size (bytes) | 762,111,360 | 99,673,920 |
| Size | 726.8 MB | 95.1 MB |
| Events in quadrant A | 9,302,785 | 574,982 |
| Events in quadrant B | 4,418,083 | 637,570 |
| Events in quadrant C | 4,420,473 | 631,112 |
| Events in quadrant D | 4,382,065 | 601,781 |
| Mode M9 | |||
|---|---|---|---|
| Quadrant | BADHDUFLAG | Total packets | Discarded packets |
| A | 0 | 10 | 0 |
| B | 0 | 10 | 0 |
| C | 0 | 10 | 0 |
| D | 0 | 10 | 0 |
| Mode SS | |||
|---|---|---|---|
| Quadrant | BADHDUFLAG | Total packets | Discarded packets |
| A | 0 | 170 | 0 |
| B | 0 | 170 | 0 |
| C | 0 | 170 | 0 |
| D | 0 | 170 | 0 |
| Mode M0 | |||
|---|---|---|---|
| Quadrant | BADHDUFLAG | Total packets | Discarded packets |
| A | 0 | 33220 | 3 |
| B | 0 | 18502 | 2 |
| C | 0 | 18239 | 2 |
| D | 0 | 19049 | 2 |
| Quadrant | Total seconds | Saturated seconds | Saturation percentage |
|---|---|---|---|
| A | 8242 | 1558 | 18.903179% |
| B | 8242 | 182 | 2.208202% |
| C | 8242 | 126 | 1.528755% |
| D | 8242 | 135 | 1.637952% |
Noise dominated data is calculated using 1-second bins in cleaned event files. If a bin has >2000 counts, and if more than 50% of those come from <1% of pixels, then it is considered to be noise-dominated and hence unusable.
| Quadrant | # 1 sec bins | Bins with >0 counts | Bins with >2000 counts | High rate bins dominated by noise | Noise dominated (total time) | Noise dominated (detector-on time) | Marked lightcurve |
|---|---|---|---|---|---|---|---|
| A | 9153 | 8244 | 1172 | 1172 | 12.80% | 14.22% | 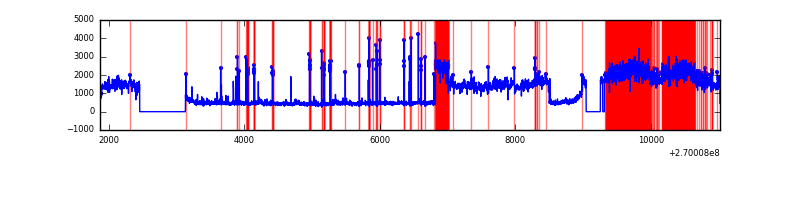 |
| B | 9153 | 8246 | 42 | 42 | 0.46% | 0.51% | 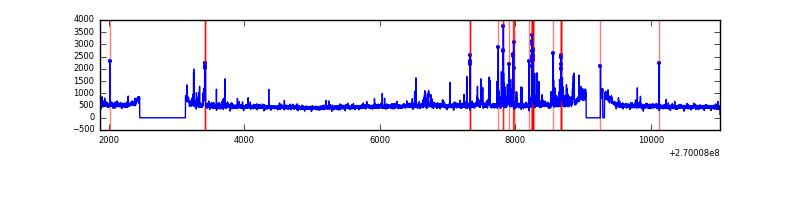 |
| C | 9153 | 8246 | 15 | 15 | 0.16% | 0.18% | 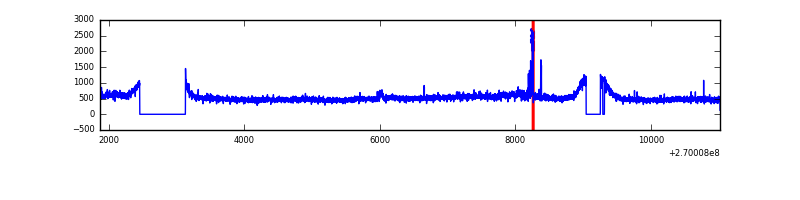 |
| D | 9153 | 8246 | 21 | 21 | 0.23% | 0.25% |  |
Top three noisy pixels from each quadrant. If the there are fewer than three noisy pixels in the level2.evt file, extra rows are filled as -1
| Pixel properties | Quadrant properties | ||||||
|---|---|---|---|---|---|---|---|
| Quadrant | DetID | PixID | Counts | Sigma | Mean | Median | Sigma |
| A | 0 | 253 | 5414421 | 28040.97 | 945 | 927 | 193.1 |
| A | 12 | 189 | 217484 | 1121.73 | 945 | 927 | 193.1 |
| A | 13 | 248 | 18292 | 89.95 | 945 | 927 | 193.1 |
| B | 3 | 64 | 247856 | 1271.06 | 1004 | 981 | 194.2 |
| B | 0 | 189 | 62802 | 318.29 | 1004 | 981 | 194.2 |
| B | 10 | 16 | 43776 | 220.33 | 1004 | 981 | 194.2 |
| C | 3 | 233 | 612769 | 2681.57 | 972 | 978 | 228.1 |
| C | 4 | 254 | 8586 | 33.35 | 972 | 978 | 228.1 |
| C | 13 | 61 | 6972 | 26.27 | 972 | 978 | 228.1 |
| D | 7 | 223 | 342585 | 1436.54 | 970 | 938 | 237.8 |
| D | 2 | 16 | 168048 | 702.65 | 970 | 938 | 237.8 |
| D | 13 | 172 | 70769 | 293.62 | 970 | 938 | 237.8 |
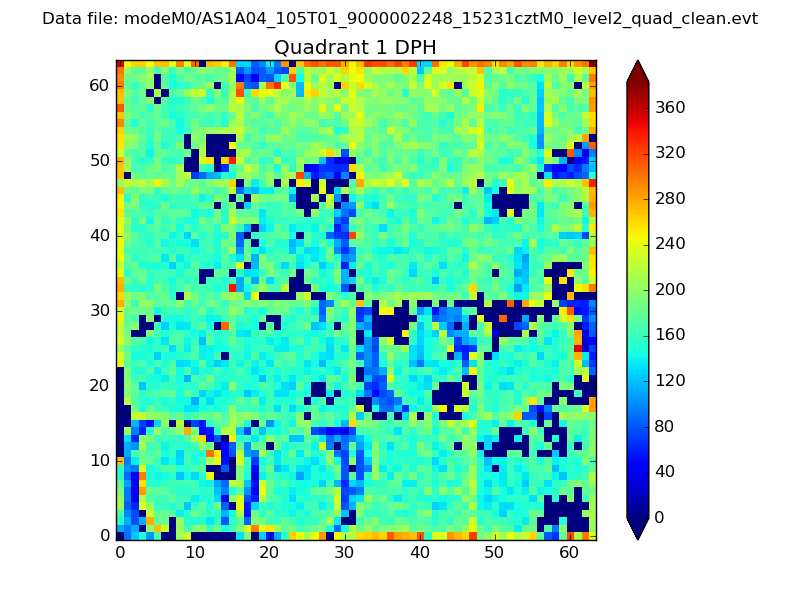
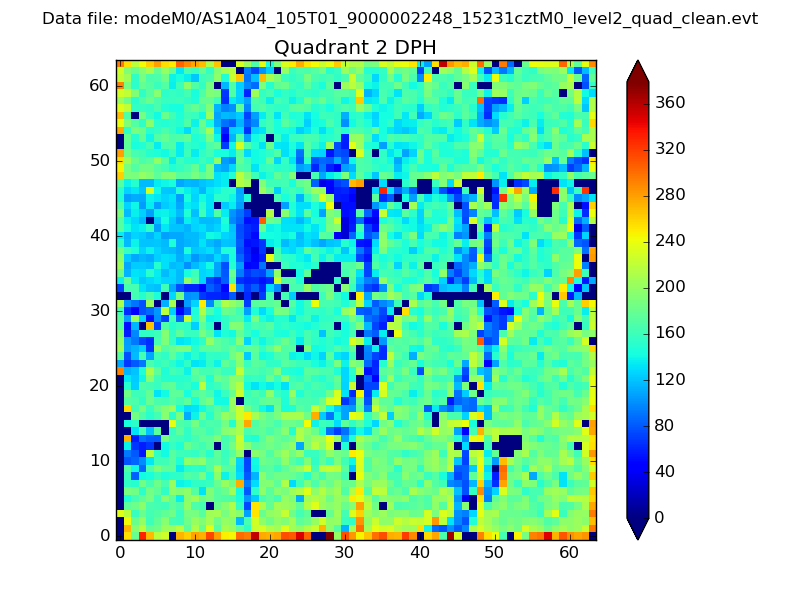
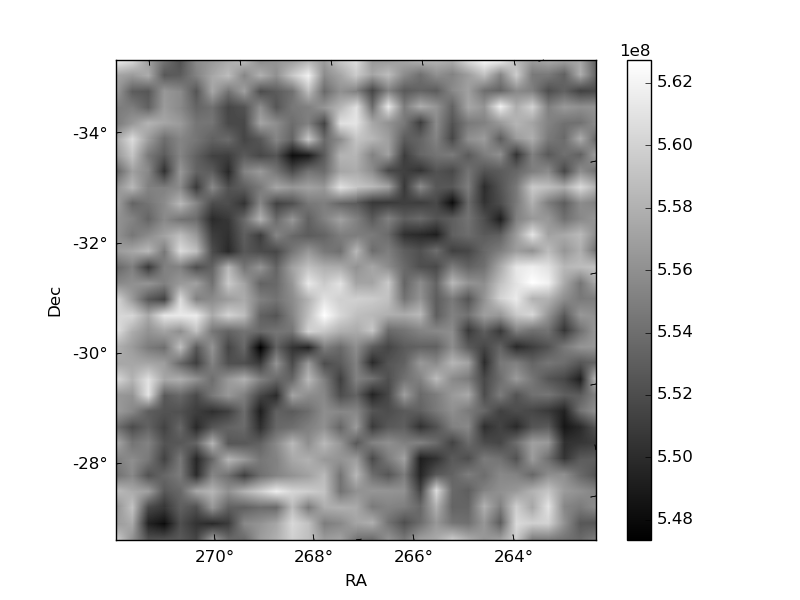
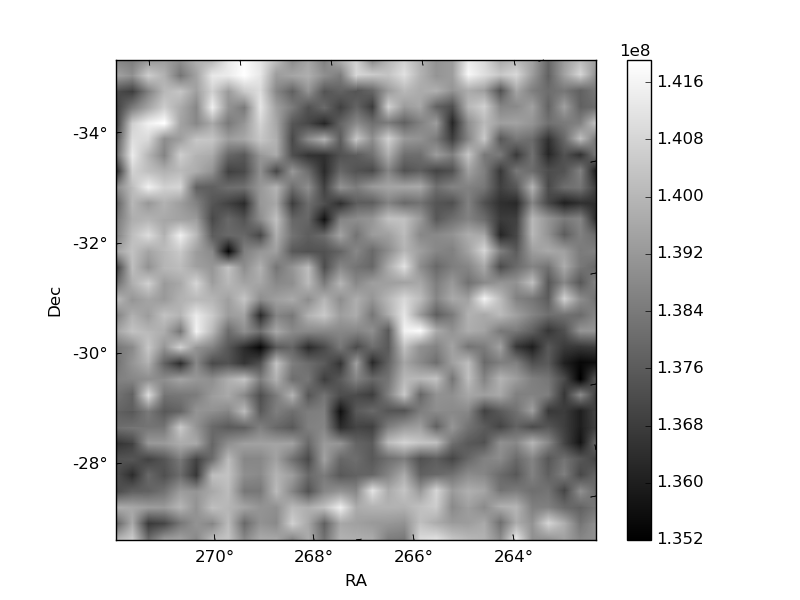
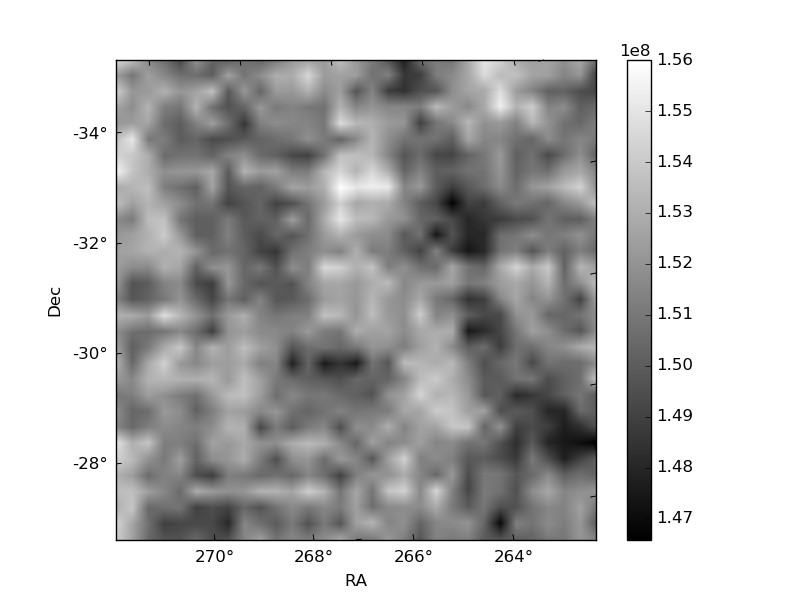
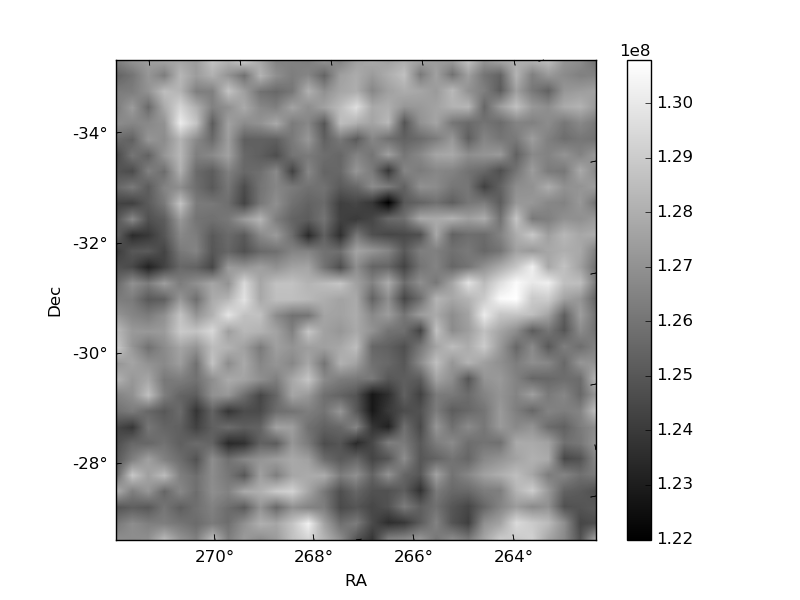
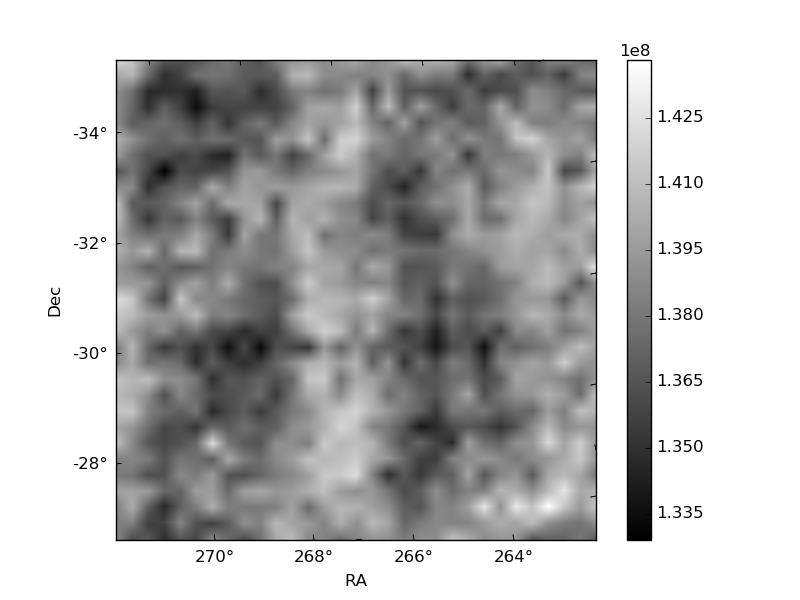
Histogram calculated using DETX and DETY for each event in the final _common_clean file
| Quadrant A | 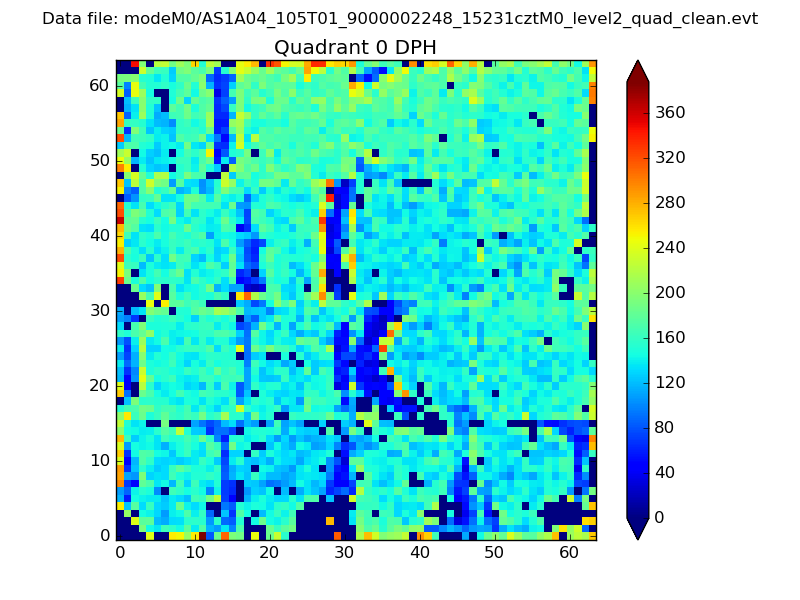 |
 |
Quadrant B |
|---|---|---|---|
| Quadrant D | 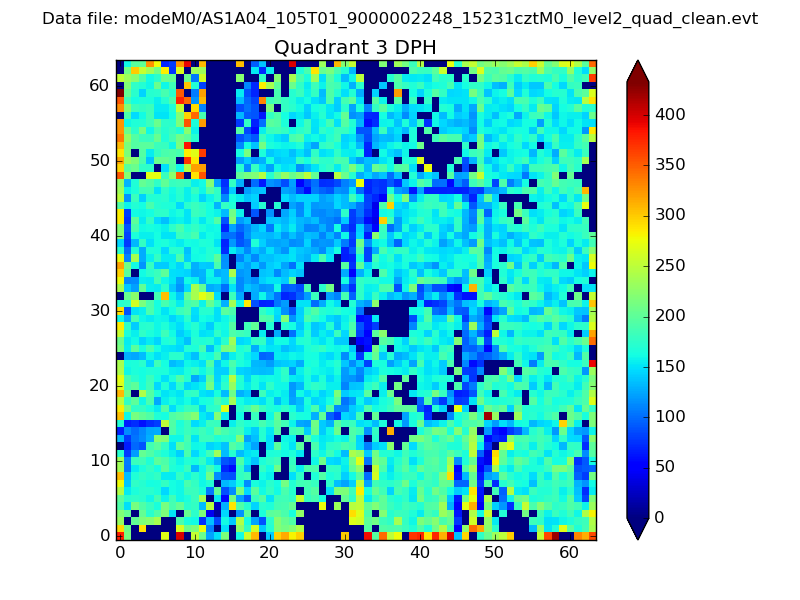 |
 |
Quadrant C |
| Plot type | Count rate plots | Images |
|---|---|---|
| Comparison with Poisson distribution Blue bars denote a histogram of data divided into 1 sec bins. Red curve is a Poisson curve with rate = median count rate of data. |
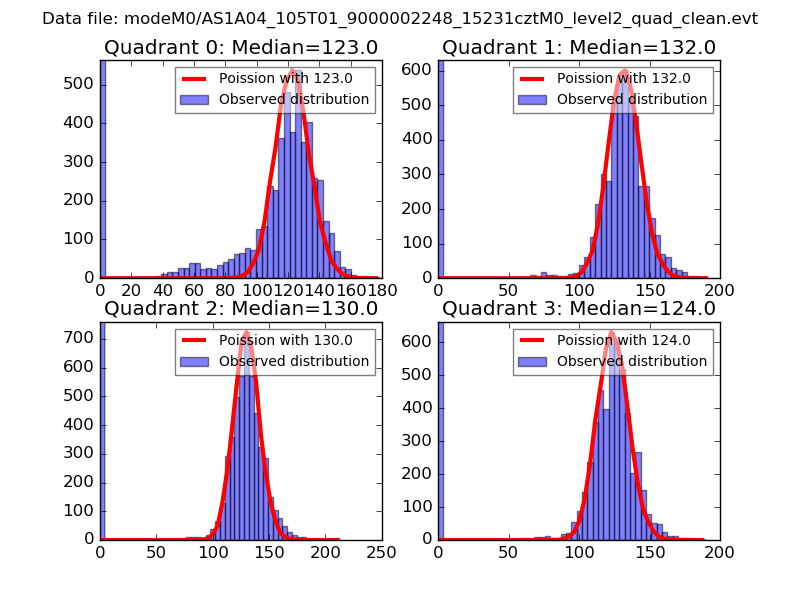 |
 |
| Quadrant-wise count rates Data is divided into 100 sec bins |
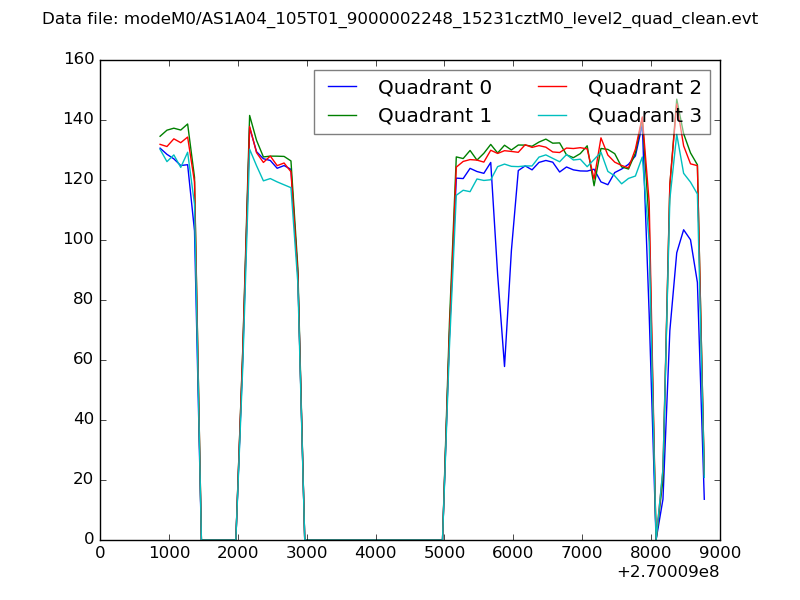 |
|
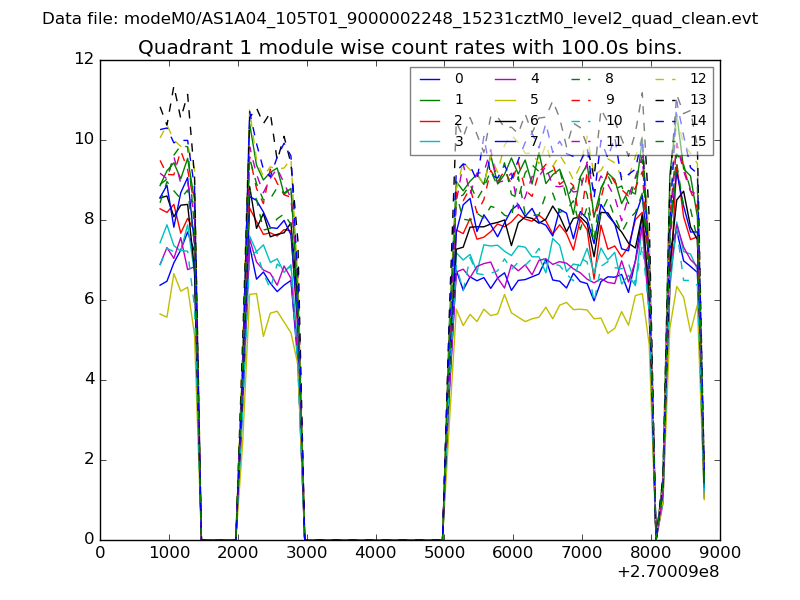
| Module-wise count rates for Quadrant A Data is divided into 100 sec bins |
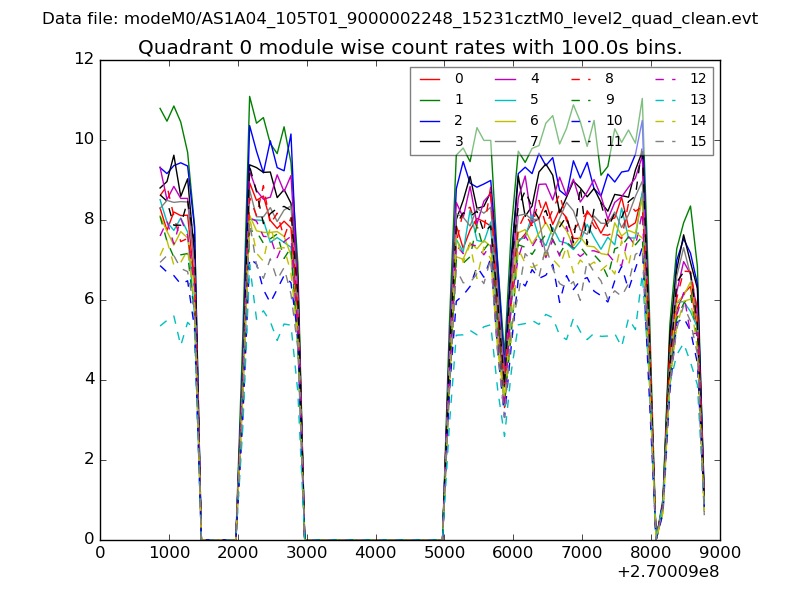 |
 |
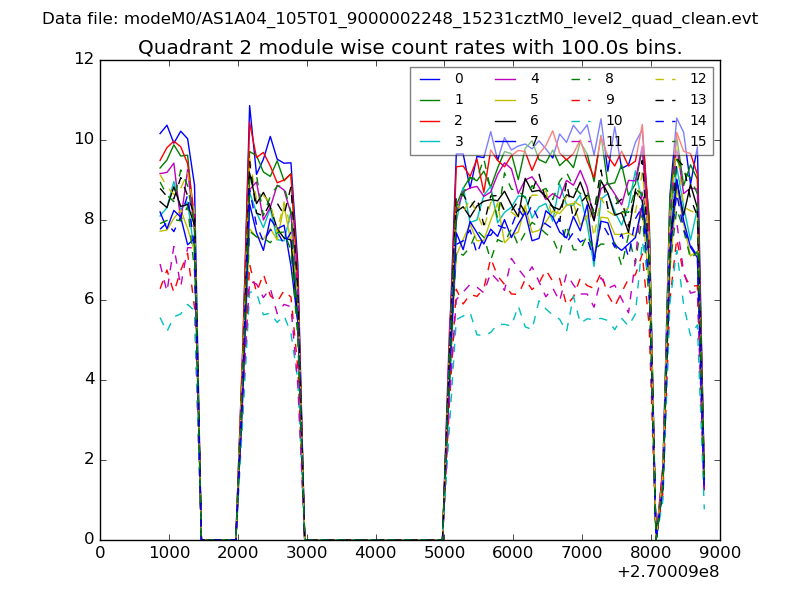
| Module-wise count rates for Quadrant B Data is divided into 100 sec bins |
 |
 |
| Module-wise count rates for Quadrant C Data is divided into 100 sec bins |
 |
 |
| Module-wise count rates for Quadrant D Data is divided into 100 sec bins |
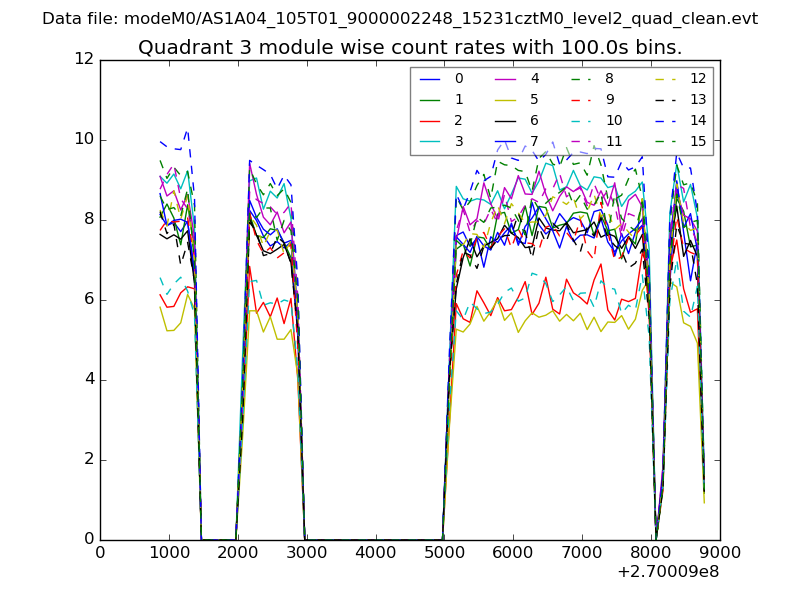 |
 |
| Parameter | Plot |
|---|---|
| CZT HV Monitor | 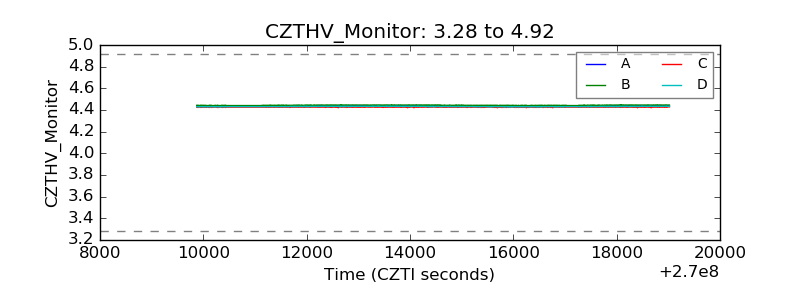 |
| D_VDD | 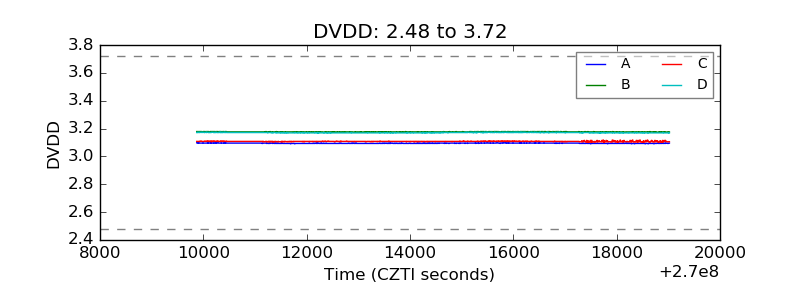 |
| Temperature 1 | 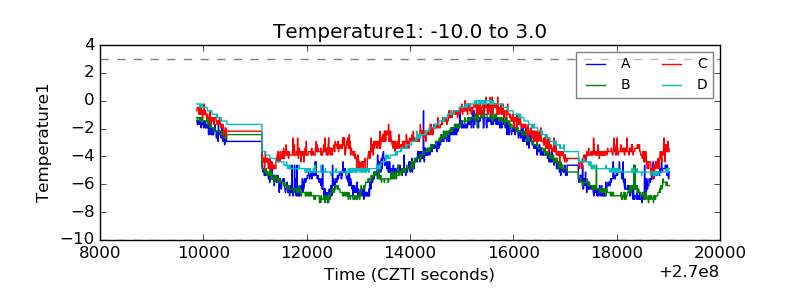 |
| Veto HV Monitor | 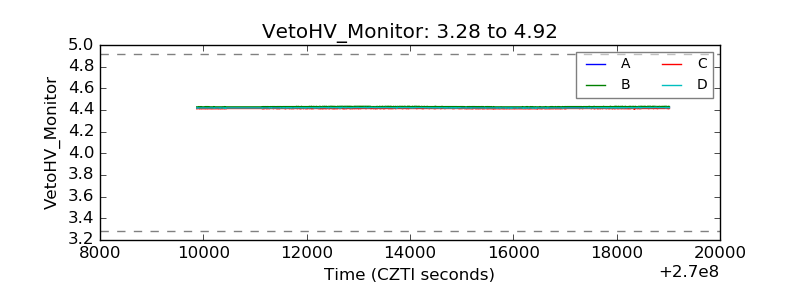 |
| Veto LLD | 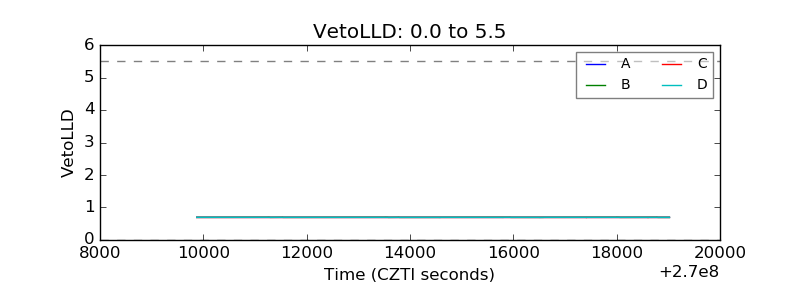 |
| Alpha Counter | 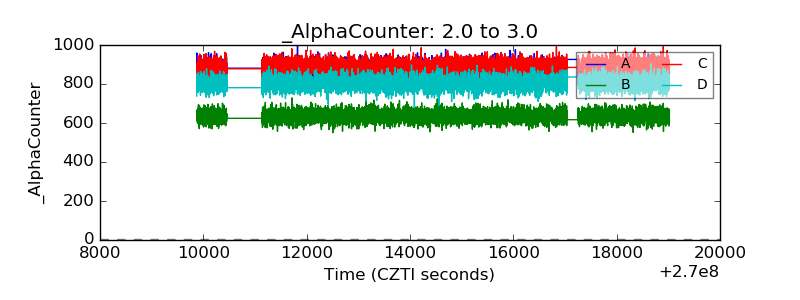 |
| _CPM_Rate | 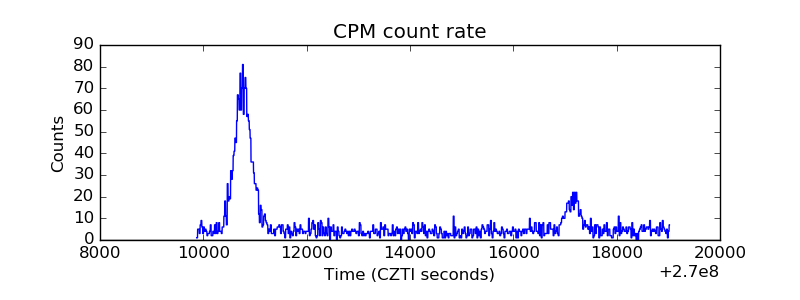 |
| CZT Counter | 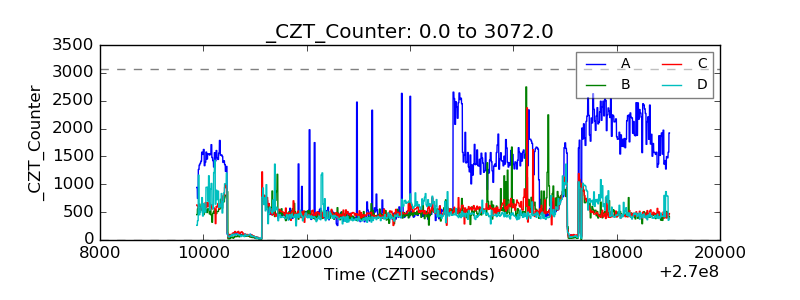 |
| +2.5 Volts monitor |  |
| +5 Volts monitor |  |
| _ROLL_ROT | 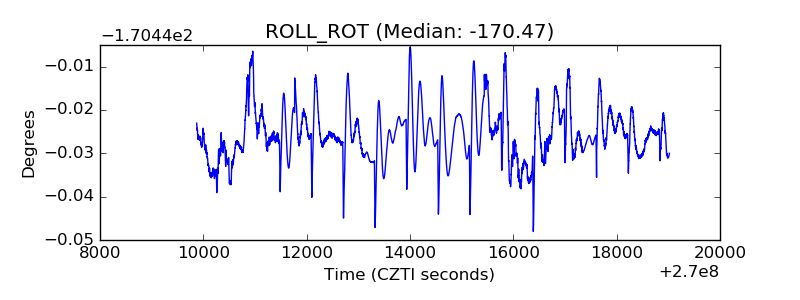 |
| _Roll_DEC | 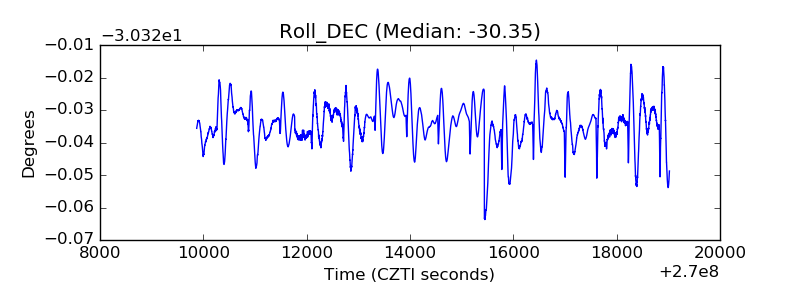 |
| _Roll_RA | 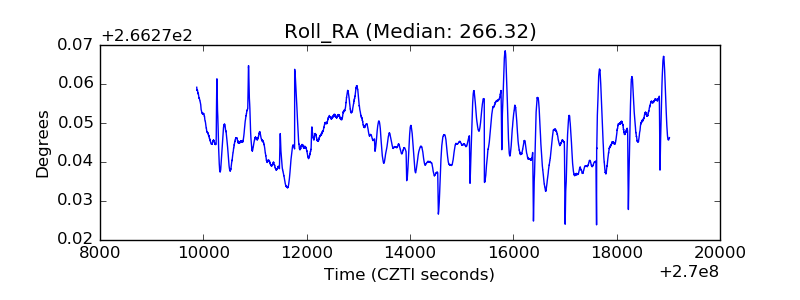 |
| Veto Counter | 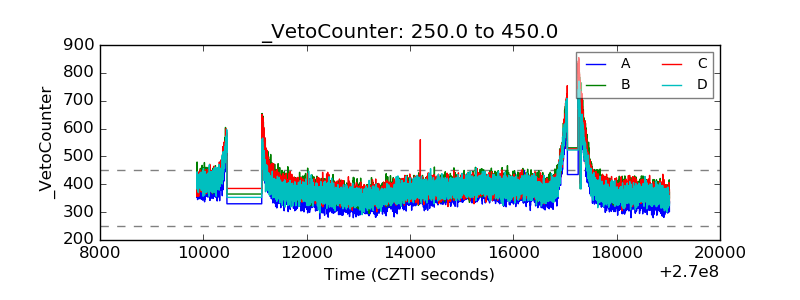 |