| Param | Original file | Final file |
|---|---|---|
| Filename | modeM0/AS1A04_105T01_9000002248_15232cztM0_level2.evt | modeM0/AS1A04_105T01_9000002248_15232cztM0_level2_quad_clean.evt |
| Size (bytes) | 866,822,400 | 89,049,600 |
| Size | 826.7 MB | 84.9 MB |
| Events in quadrant A | 12,547,367 | 438,704 |
| Events in quadrant B | 4,606,701 | 573,238 |
| Events in quadrant C | 4,227,642 | 577,571 |
| Events in quadrant D | 4,319,871 | 539,743 |
| Mode M9 | |||
|---|---|---|---|
| Quadrant | BADHDUFLAG | Total packets | Discarded packets |
| A | 0 | 5 | 0 |
| B | 0 | 5 | 0 |
| C | 0 | 5 | 0 |
| D | 0 | 5 | 0 |
| Mode SS | |||
|---|---|---|---|
| Quadrant | BADHDUFLAG | Total packets | Discarded packets |
| A | 0 | 168 | 0 |
| B | 0 | 168 | 0 |
| C | 0 | 168 | 0 |
| D | 0 | 168 | 0 |
| Mode M0 | |||
|---|---|---|---|
| Quadrant | BADHDUFLAG | Total packets | Discarded packets |
| A | 0 | 42876 | 3 |
| B | 0 | 18999 | 2 |
| C | 0 | 17393 | 2 |
| D | 0 | 18710 | 2 |
| Quadrant | Total seconds | Saturated seconds | Saturation percentage |
|---|---|---|---|
| A | 8145 | 3092 | 37.961940% |
| B | 8145 | 305 | 3.744629% |
| C | 8145 | 176 | 2.160835% |
| D | 8145 | 276 | 3.388582% |
Noise dominated data is calculated using 1-second bins in cleaned event files. If a bin has >2000 counts, and if more than 50% of those come from <1% of pixels, then it is considered to be noise-dominated and hence unusable.
| Quadrant | # 1 sec bins | Bins with >0 counts | Bins with >2000 counts | High rate bins dominated by noise | Noise dominated (total time) | Noise dominated (detector-on time) | Marked lightcurve |
|---|---|---|---|---|---|---|---|
| A | 8606 | 8148 | 2685 | 2685 | 31.20% | 32.95% | 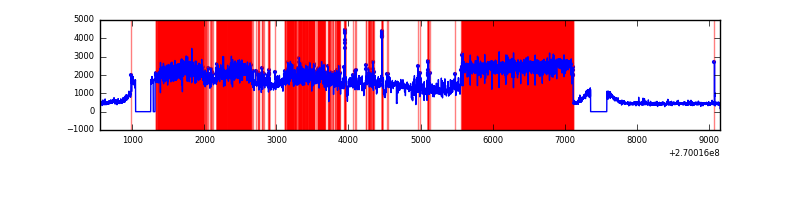 |
| B | 8606 | 8149 | 60 | 60 | 0.70% | 0.74% | 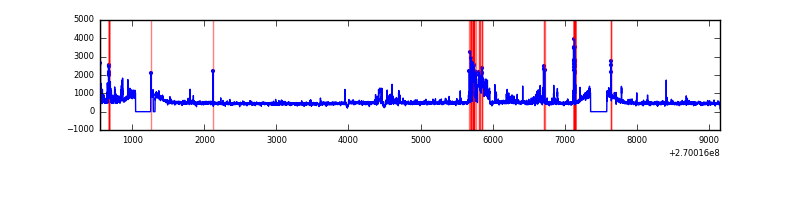 |
| C | 8606 | 8149 | 0 | 0 | 0.00% | 0.00% | 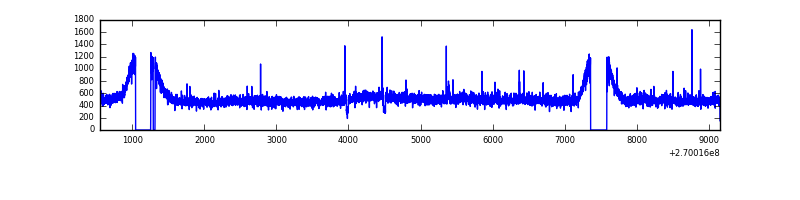 |
| D | 8606 | 8149 | 107 | 107 | 1.24% | 1.31% | 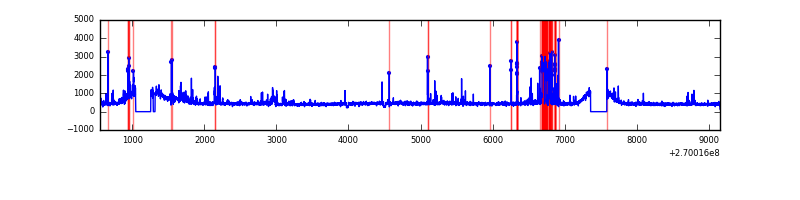 |
Top three noisy pixels from each quadrant. If the there are fewer than three noisy pixels in the level2.evt file, extra rows are filled as -1
| Pixel properties | Quadrant properties | ||||||
|---|---|---|---|---|---|---|---|
| Quadrant | DetID | PixID | Counts | Sigma | Mean | Median | Sigma |
| A | 0 | 253 | 9025908 | 49478.87 | 887 | 866 | 182.4 |
| A | 12 | 189 | 89052 | 483.47 | 887 | 866 | 182.4 |
| A | 9 | 143 | 17289 | 90.04 | 887 | 866 | 182.4 |
| B | 10 | 16 | 294313 | 1505.81 | 1004 | 978 | 194.8 |
| B | 3 | 64 | 176501 | 901.03 | 1004 | 978 | 194.8 |
| B | 0 | 189 | 58663 | 296.12 | 1004 | 978 | 194.8 |
| C | 3 | 233 | 369614 | 1593.08 | 981 | 989 | 231.4 |
| C | 8 | 128 | 10960 | 43.09 | 981 | 989 | 231.4 |
| C | 4 | 254 | 8345 | 31.79 | 981 | 989 | 231.4 |
| D | 7 | 38 | 362673 | 1520.07 | 964 | 932 | 238.0 |
| D | 7 | 223 | 177326 | 741.22 | 964 | 932 | 238.0 |
| D | 14 | 35 | 51570 | 212.79 | 964 | 932 | 238.0 |
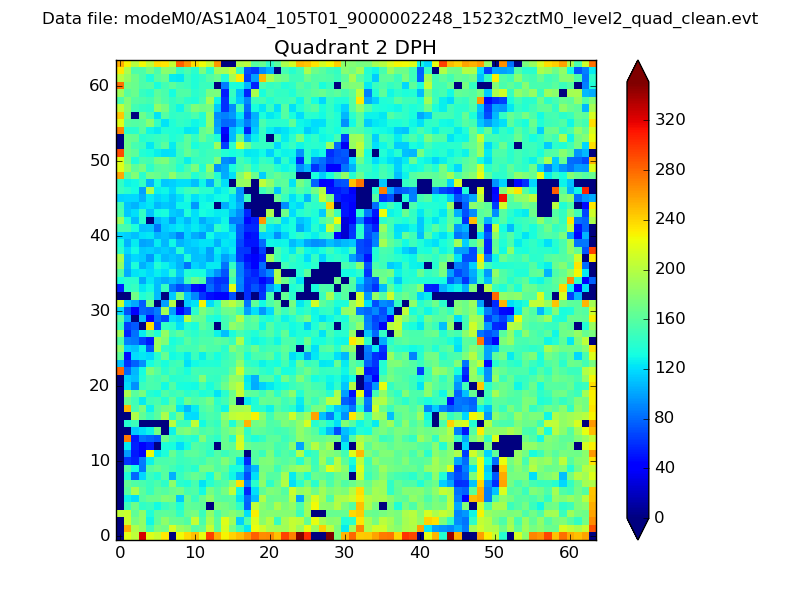
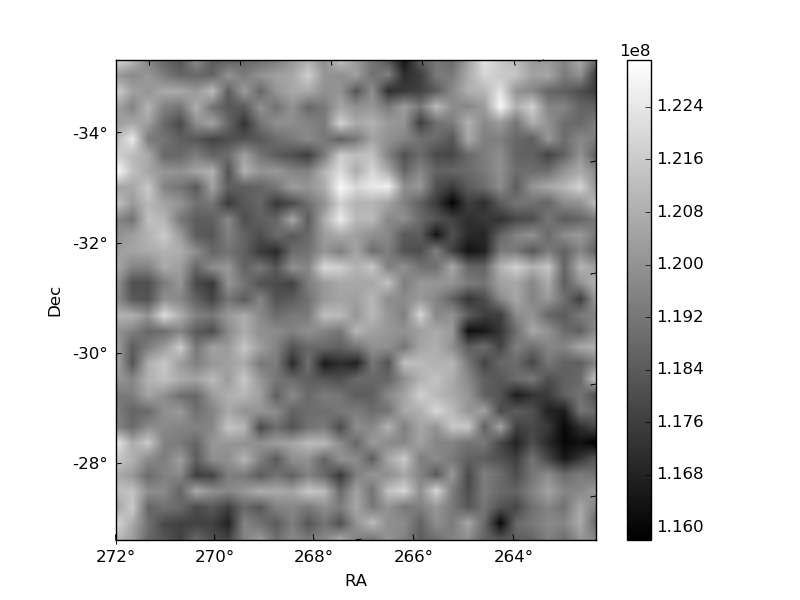
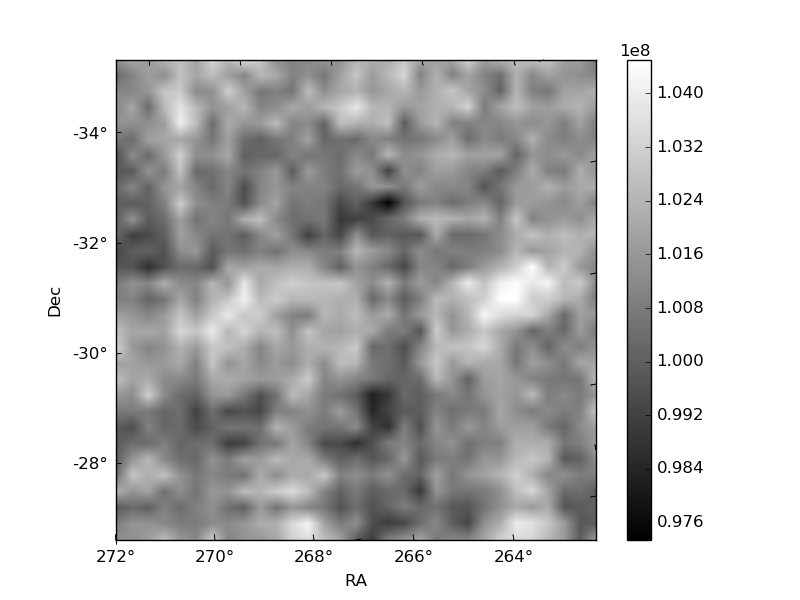
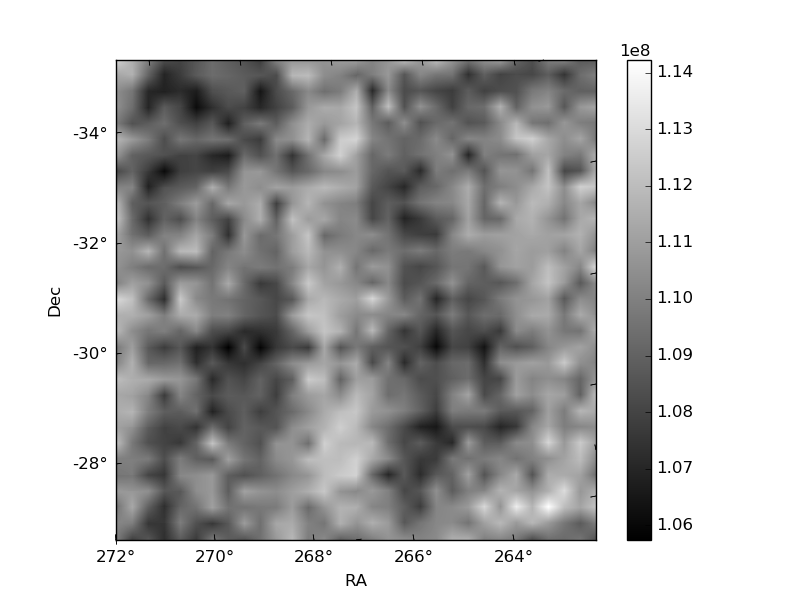
Histogram calculated using DETX and DETY for each event in the final _common_clean file
| Quadrant A | 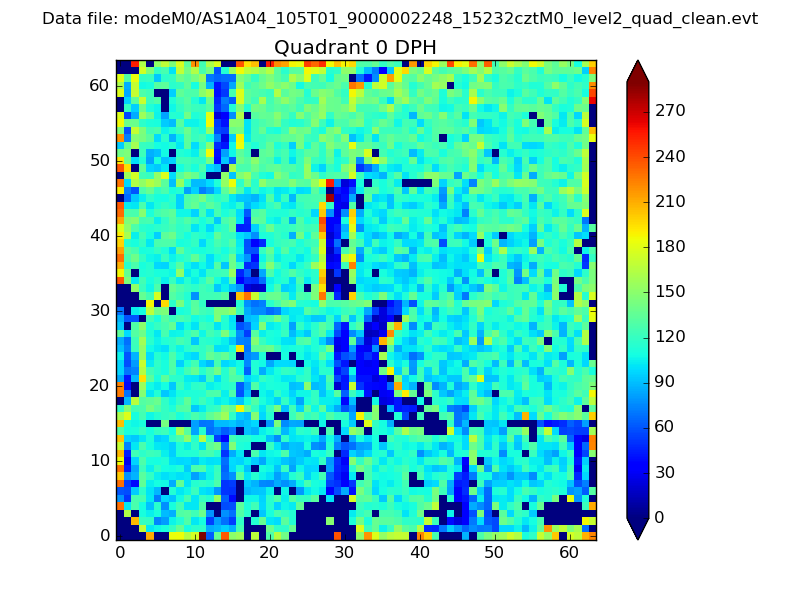 |
 |
Quadrant B |
|---|---|---|---|
| Quadrant D | 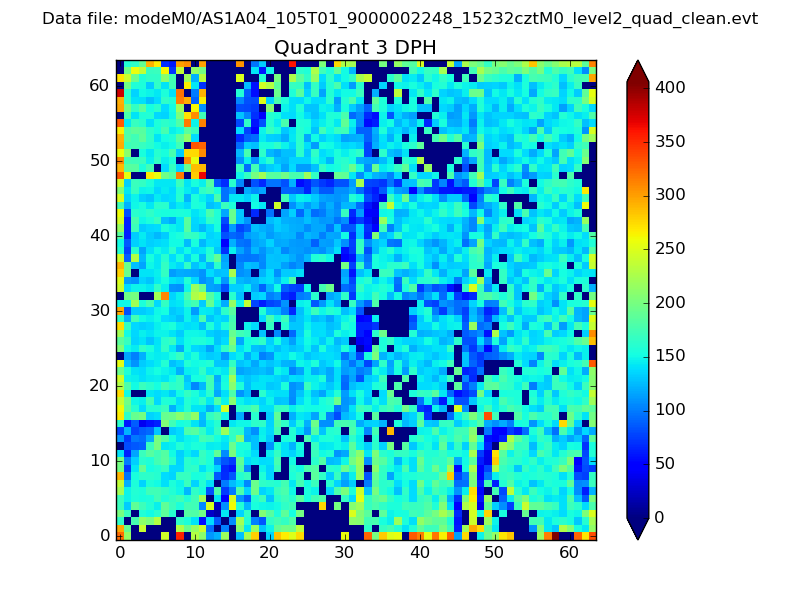 |
 |
Quadrant C |
| Plot type | Count rate plots | Images |
|---|---|---|
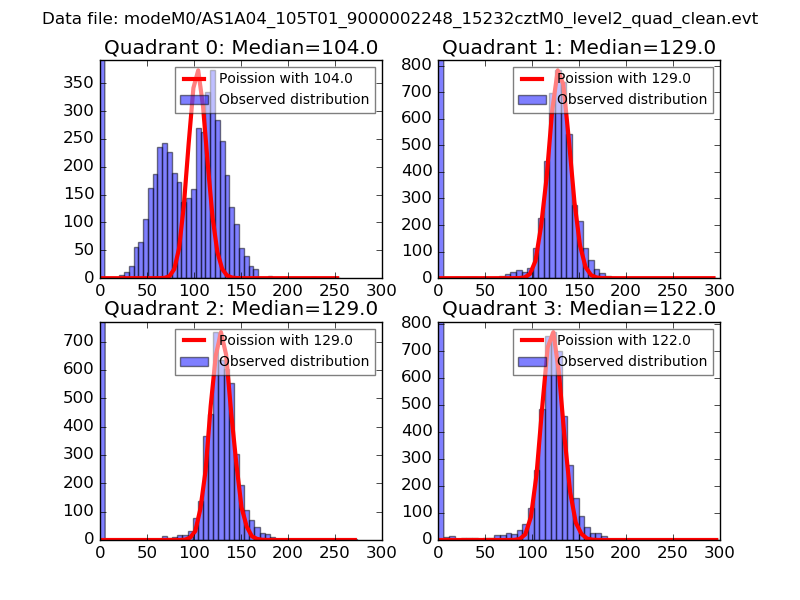
| Comparison with Poisson distribution Blue bars denote a histogram of data divided into 1 sec bins. Red curve is a Poisson curve with rate = median count rate of data. |
 |
 |
| Quadrant-wise count rates Data is divided into 100 sec bins |
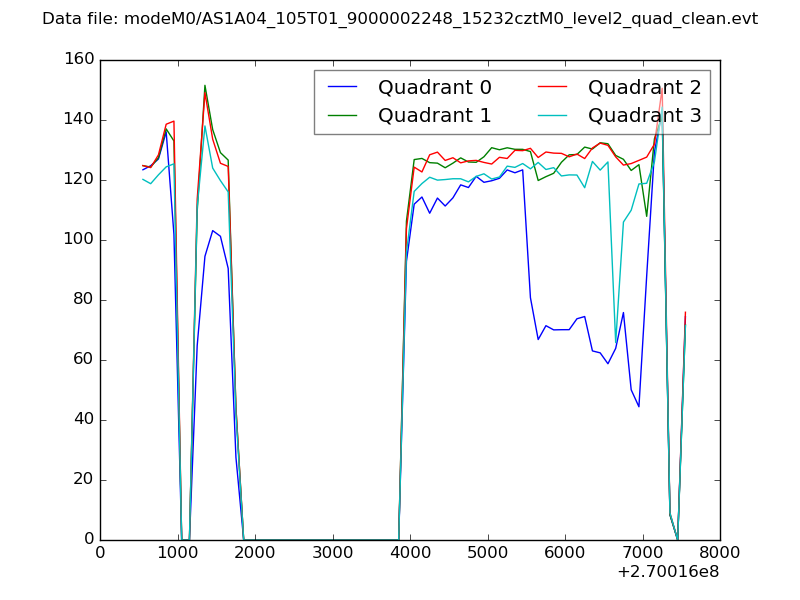 |
|
| Module-wise count rates for Quadrant A Data is divided into 100 sec bins |
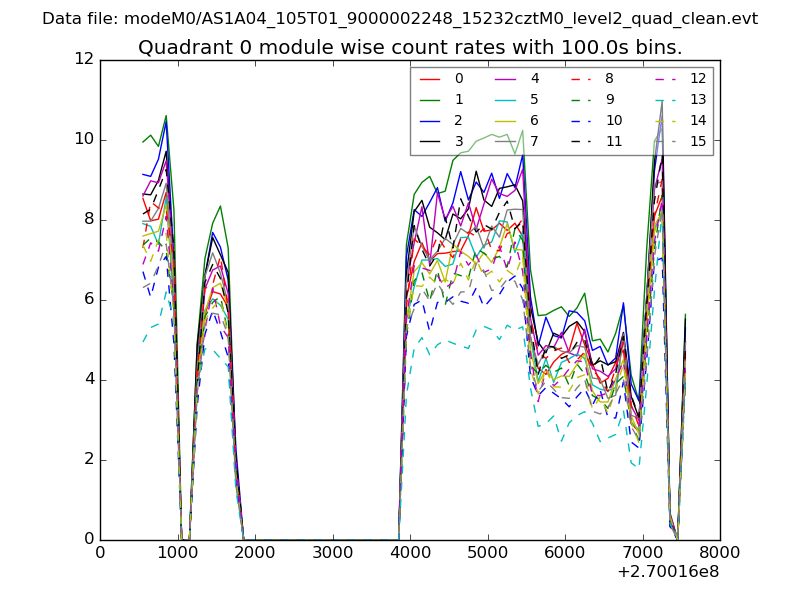 |
 |
| Module-wise count rates for Quadrant B Data is divided into 100 sec bins |
 |
 |
| Module-wise count rates for Quadrant C Data is divided into 100 sec bins |
 |
 |
| Module-wise count rates for Quadrant D Data is divided into 100 sec bins |
 |
 |
| Parameter | Plot |
|---|---|
| CZT HV Monitor | 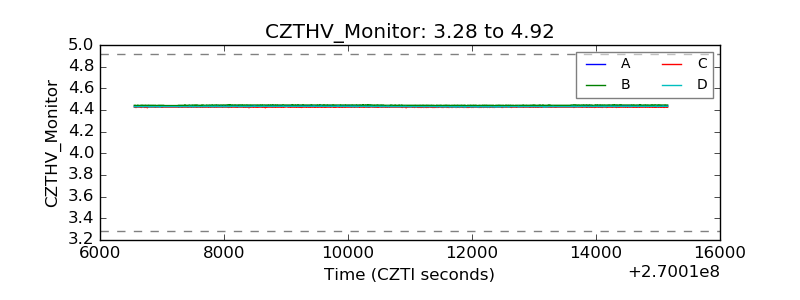 |
| D_VDD | 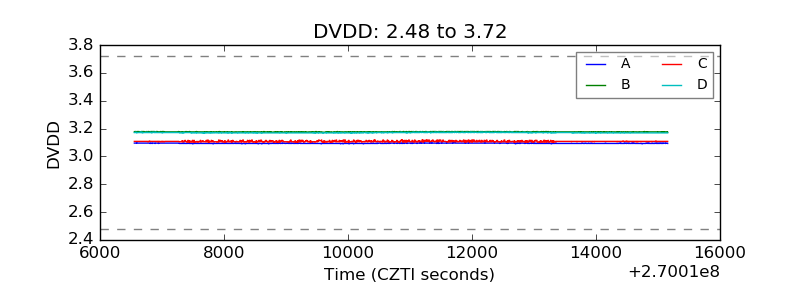 |
| Temperature 1 | 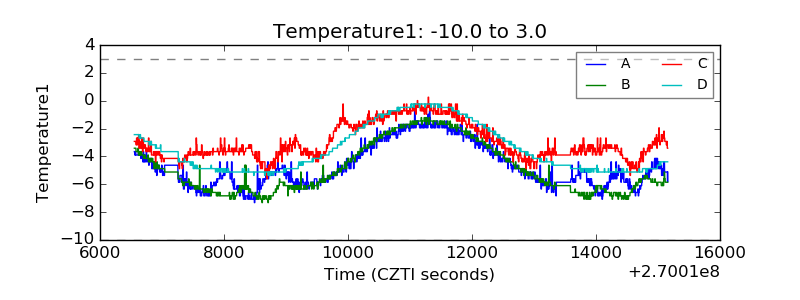 |
| Veto HV Monitor | 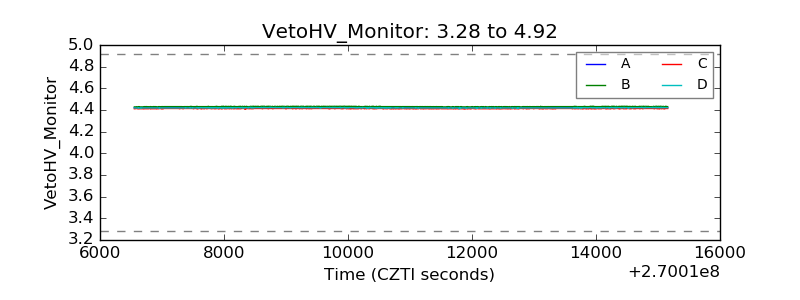 |
| Veto LLD | 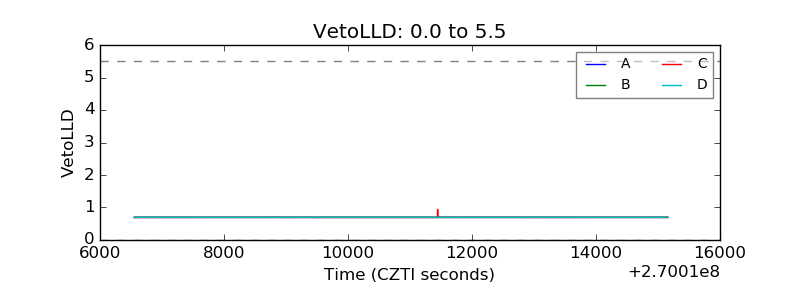 |
| Alpha Counter | 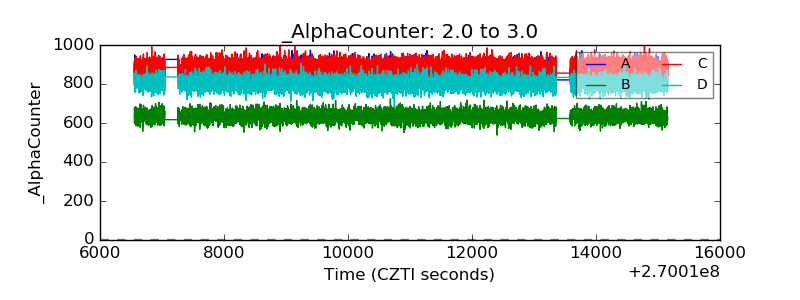 |
| _CPM_Rate | 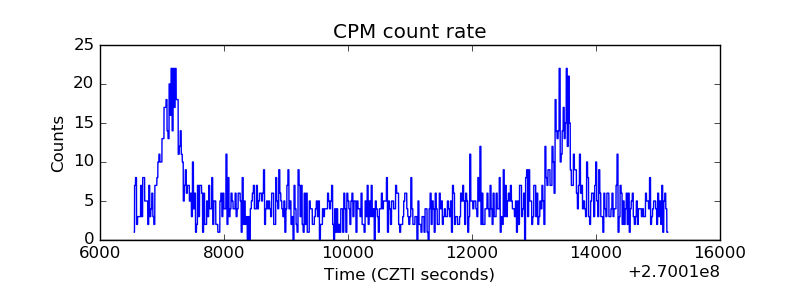 |
| CZT Counter | 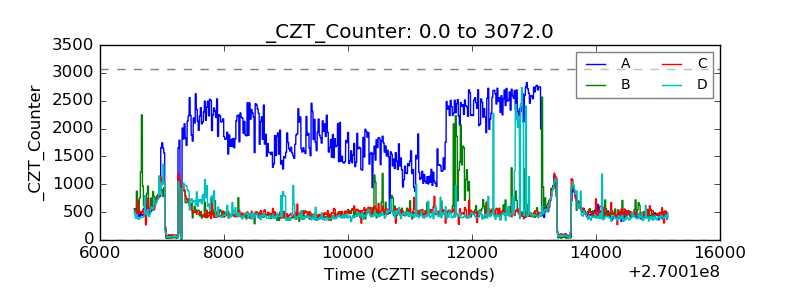 |
| +2.5 Volts monitor |  |
| +5 Volts monitor |  |
| _ROLL_ROT | 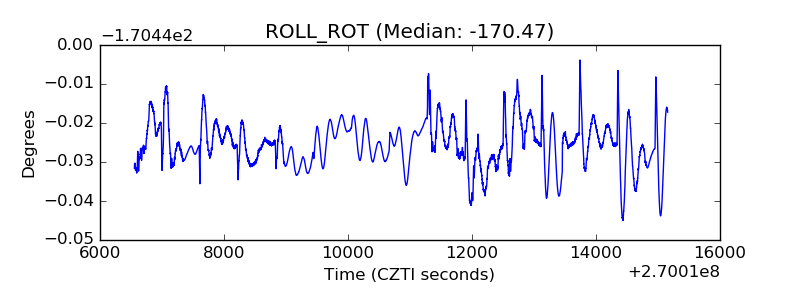 |
| _Roll_DEC | 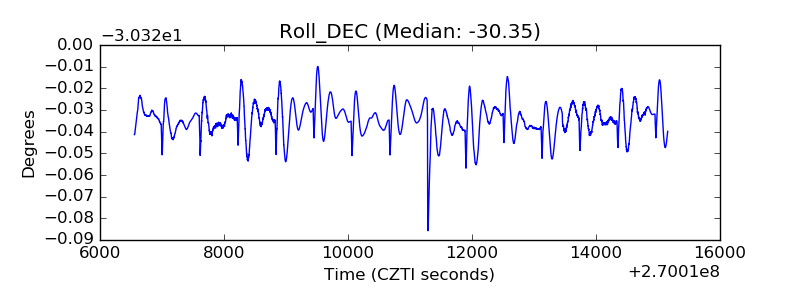 |
| _Roll_RA | 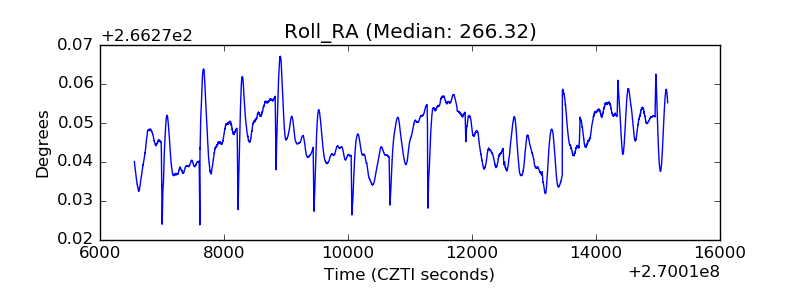 |
| Veto Counter | 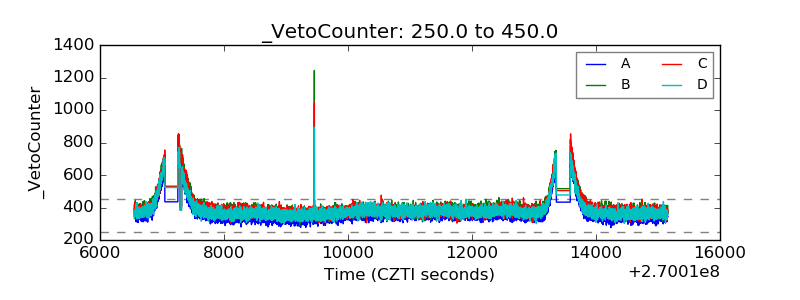 |