| Param | Original file | Final file |
|---|---|---|
| Filename | modeM0/AS1A04_105T01_9000002248_15235cztM0_level2.evt | modeM0/AS1A04_105T01_9000002248_15235cztM0_level2_quad_clean.evt |
| Size (bytes) | 1,487,620,800 | 230,849,280 |
| Size | 1.4 GB | 220.2 MB |
| Events in quadrant A | 13,210,520 | 1,416,288 |
| Events in quadrant B | 9,606,672 | 1,466,105 |
| Events in quadrant C | 10,809,352 | 1,449,412 |
| Events in quadrant D | 10,171,771 | 1,378,447 |
| Mode M9 | |||
|---|---|---|---|
| Quadrant | BADHDUFLAG | Total packets | Discarded packets |
| A | 0 | 17 | 0 |
| B | 0 | 17 | 0 |
| C | 0 | 17 | 0 |
| D | 0 | 17 | 0 |
| Mode SS | |||
|---|---|---|---|
| Quadrant | BADHDUFLAG | Total packets | Discarded packets |
| A | 0 | 378 | 0 |
| B | 0 | 378 | 0 |
| C | 0 | 378 | 0 |
| D | 0 | 378 | 0 |
| Mode M0 | |||
|---|---|---|---|
| Quadrant | BADHDUFLAG | Total packets | Discarded packets |
| A | 0 | 51553 | 4 |
| B | 0 | 40038 | 3 |
| C | 0 | 42975 | 3 |
| D | 0 | 43234 | 3 |
| Quadrant | Total seconds | Saturated seconds | Saturation percentage |
|---|---|---|---|
| A | 18596 | 535 | 2.876963% |
| B | 18596 | 369 | 1.984298% |
| C | 18596 | 466 | 2.505915% |
| D | 18596 | 578 | 3.108195% |
Noise dominated data is calculated using 1-second bins in cleaned event files. If a bin has >2000 counts, and if more than 50% of those come from <1% of pixels, then it is considered to be noise-dominated and hence unusable.
| Quadrant | # 1 sec bins | Bins with >0 counts | Bins with >2000 counts | High rate bins dominated by noise | Noise dominated (total time) | Noise dominated (detector-on time) | Marked lightcurve |
|---|---|---|---|---|---|---|---|
| A | 20307 | 18597 | 169 | 169 | 0.83% | 0.91% | 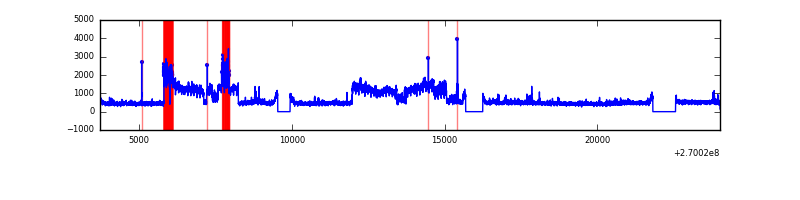 |
| B | 20307 | 18597 | 93 | 93 | 0.46% | 0.50% | 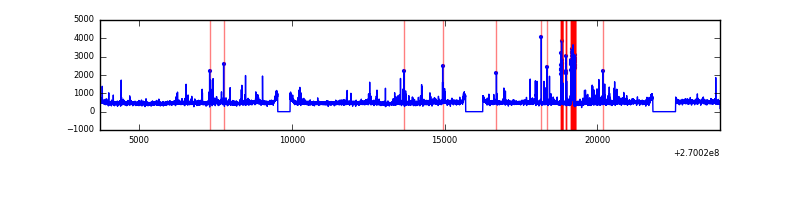 |
| C | 20307 | 18597 | 220 | 220 | 1.08% | 1.18% | 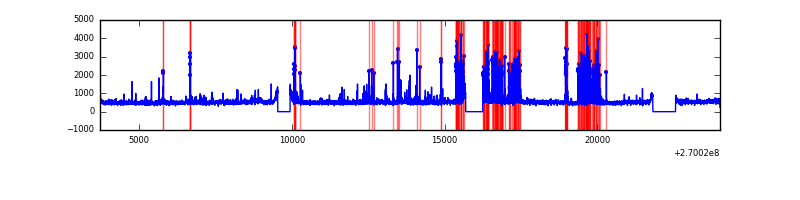 |
| D | 20307 | 18597 | 345 | 345 | 1.70% | 1.86% | 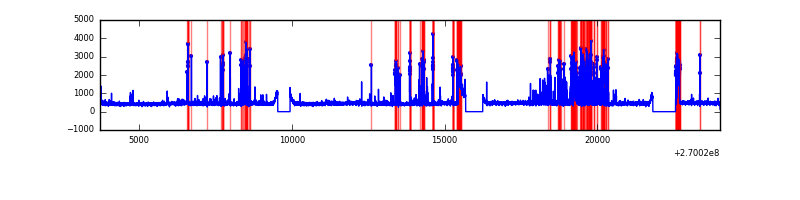 |
Top three noisy pixels from each quadrant. If the there are fewer than three noisy pixels in the level2.evt file, extra rows are filled as -1
| Pixel properties | Quadrant properties | ||||||
|---|---|---|---|---|---|---|---|
| Quadrant | DetID | PixID | Counts | Sigma | Mean | Median | Sigma |
| A | 0 | 253 | 4221092 | 9439.17 | 2210 | 2166 | 447.0 |
| A | 12 | 189 | 426705 | 949.84 | 2210 | 2166 | 447.0 |
| A | 9 | 143 | 30479 | 63.35 | 2210 | 2166 | 447.0 |
| B | 10 | 16 | 309107 | 726.37 | 2221 | 2163 | 422.6 |
| B | 0 | 229 | 152650 | 356.12 | 2221 | 2163 | 422.6 |
| B | 3 | 64 | 120881 | 280.94 | 2221 | 2163 | 422.6 |
| C | 4 | 254 | 1278784 | 2565.0 | 2145 | 2160 | 497.7 |
| C | 3 | 233 | 1080698 | 2167.01 | 2145 | 2160 | 497.7 |
| C | 10 | 22 | 40441 | 76.91 | 2145 | 2160 | 497.7 |
| D | 5 | 222 | 790317 | 1515.3 | 2138 | 2073 | 520.2 |
| D | 1 | 255 | 566410 | 1084.86 | 2138 | 2073 | 520.2 |
| D | 7 | 38 | 427768 | 818.34 | 2138 | 2073 | 520.2 |
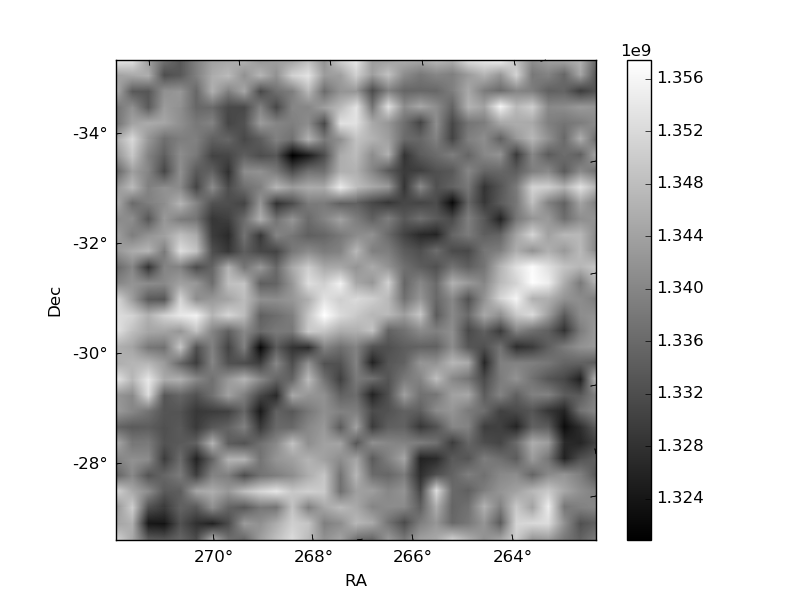
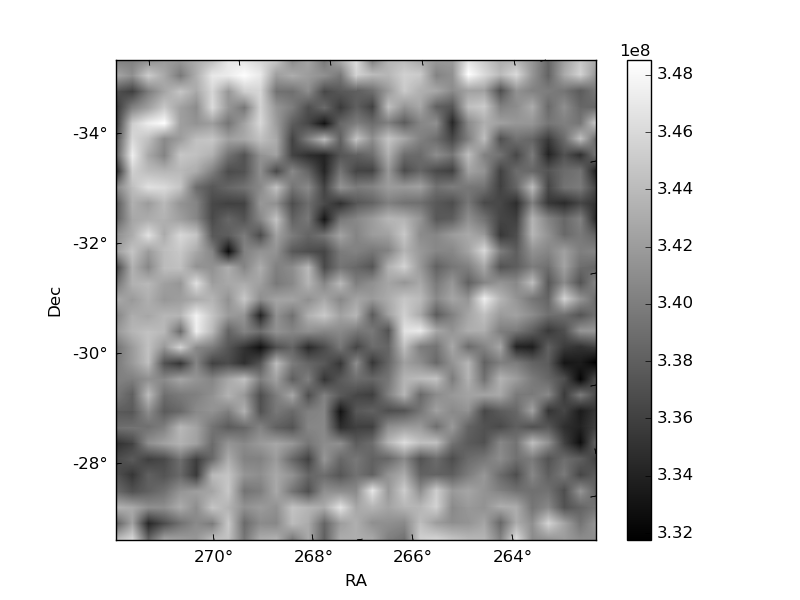
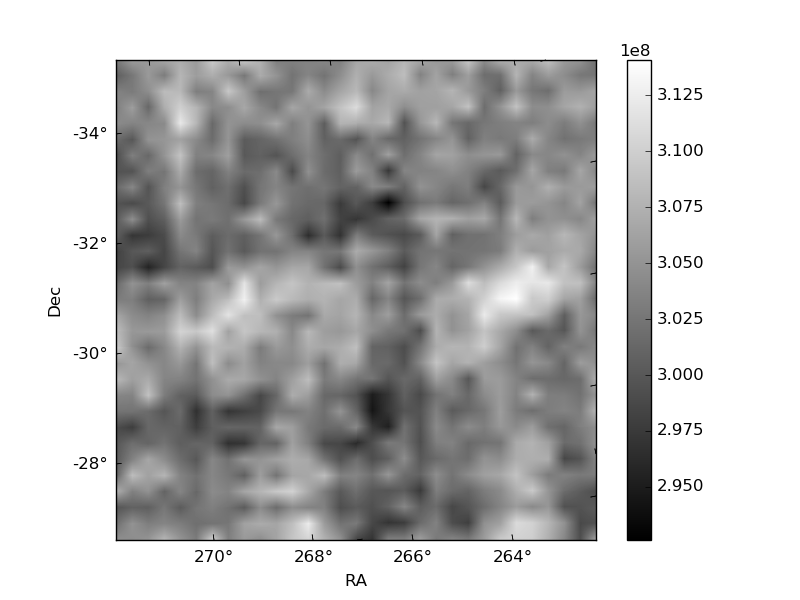
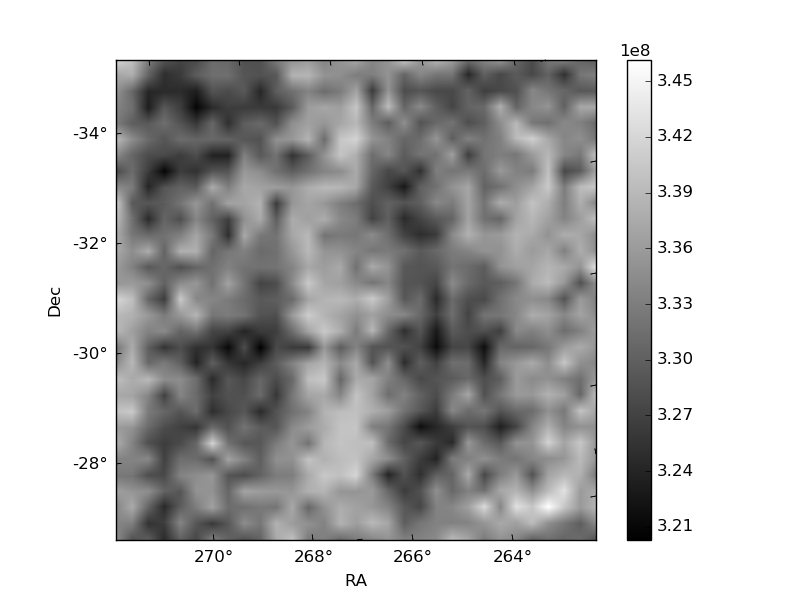
Histogram calculated using DETX and DETY for each event in the final _common_clean file
| Quadrant A | 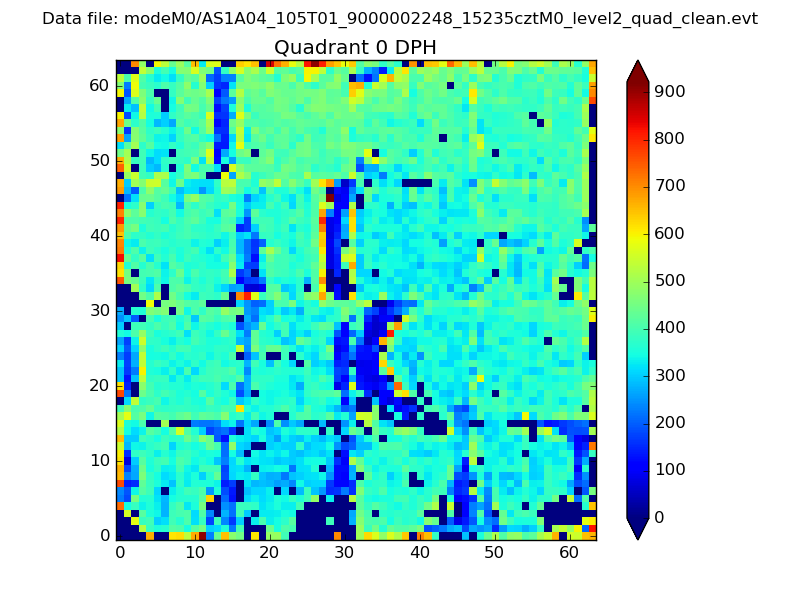 |
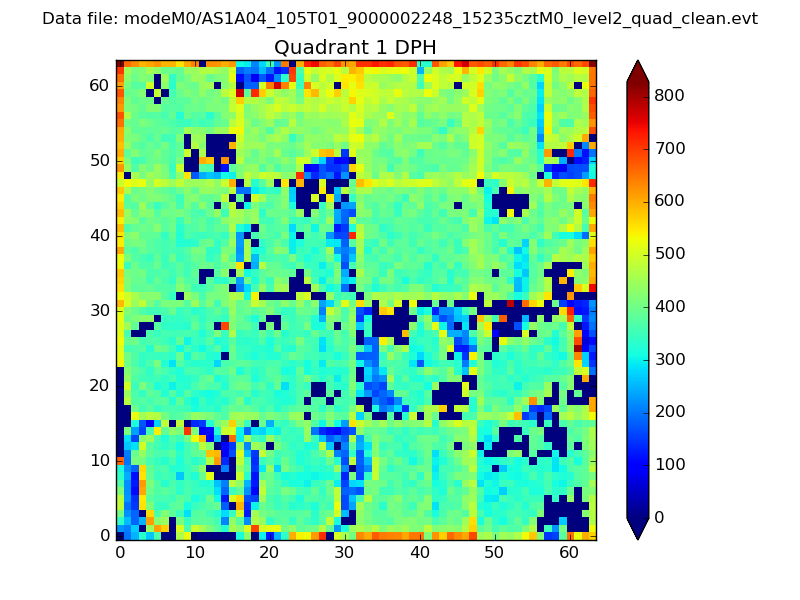 |
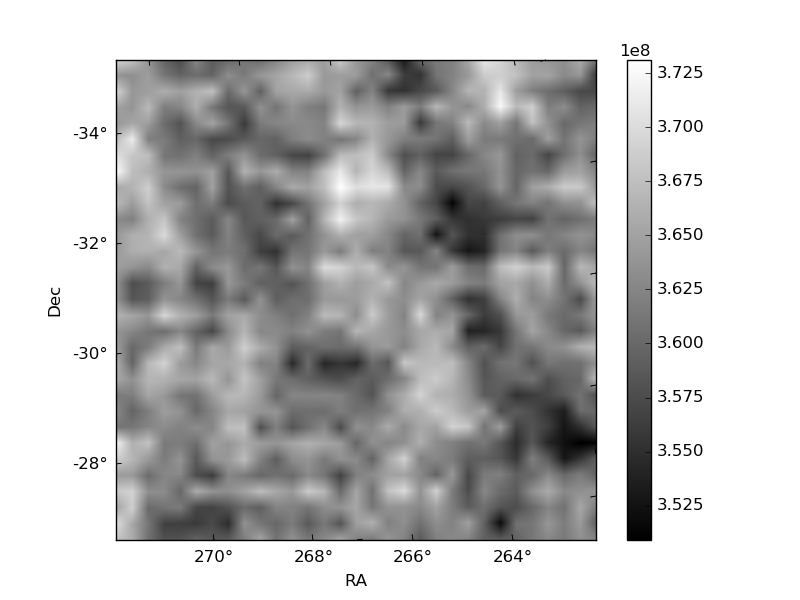
Quadrant B |
|---|---|---|---|
| Quadrant D | 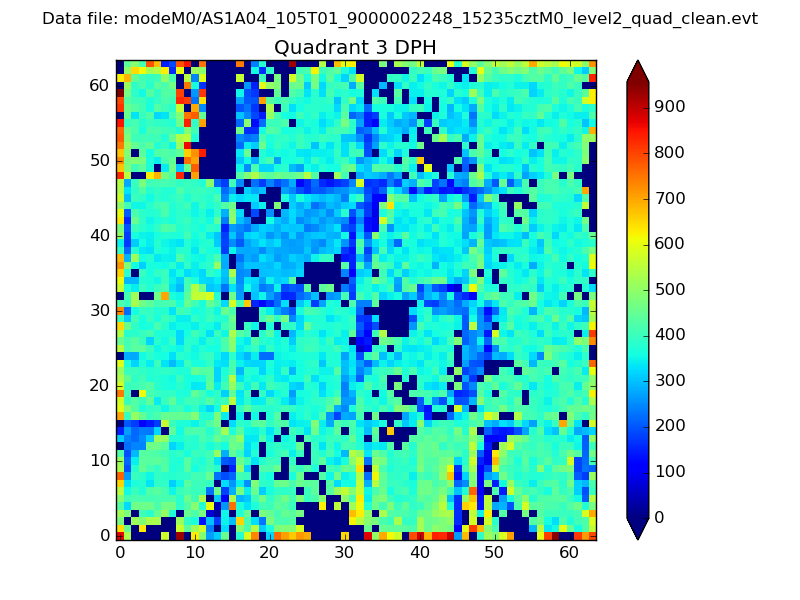 |
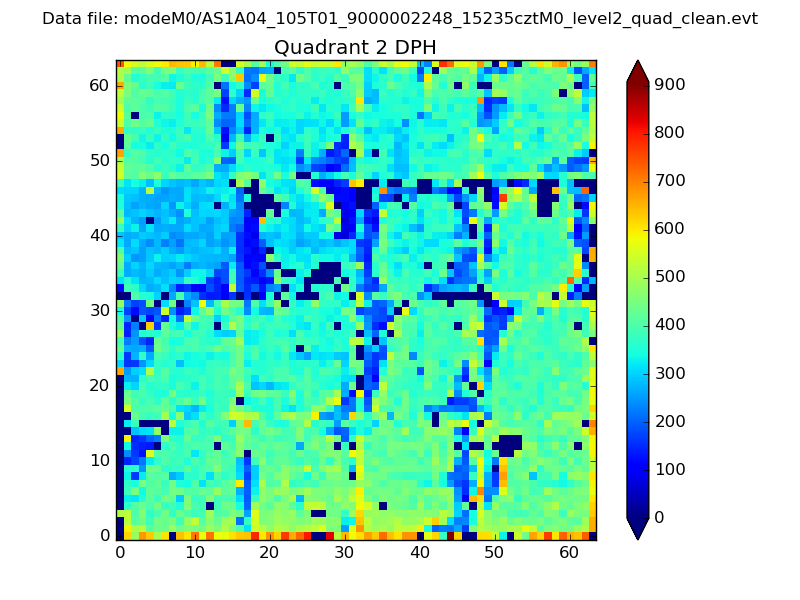 |
Quadrant C |
| Plot type | Count rate plots | Images |
|---|---|---|
| Comparison with Poisson distribution Blue bars denote a histogram of data divided into 1 sec bins. Red curve is a Poisson curve with rate = median count rate of data. |
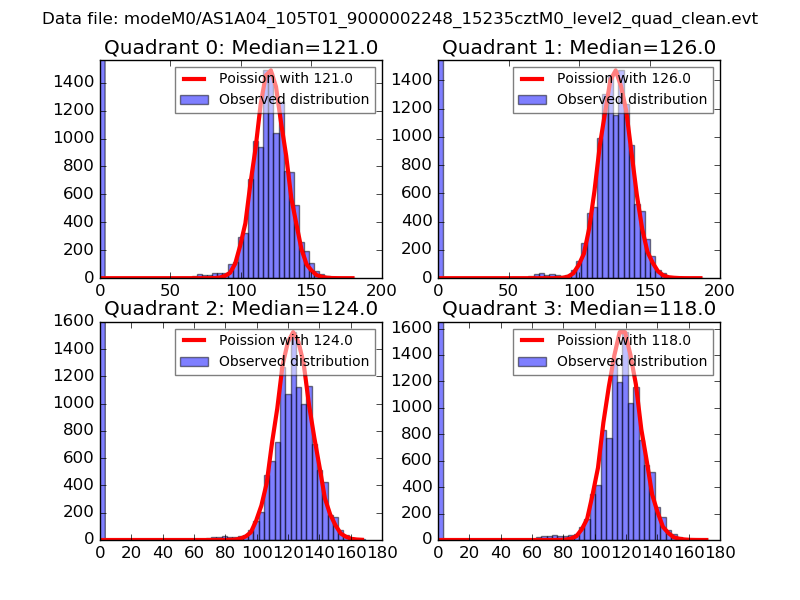 |
 |
| Quadrant-wise count rates Data is divided into 100 sec bins |
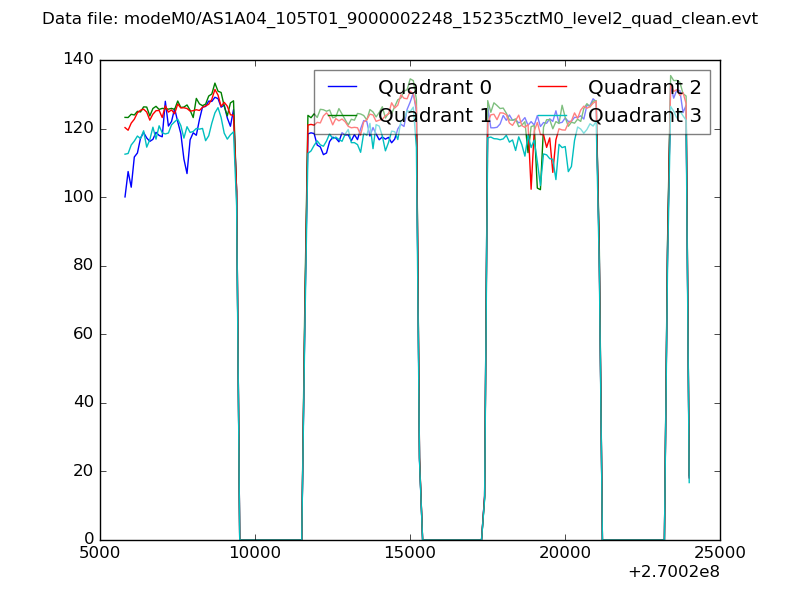 |
|
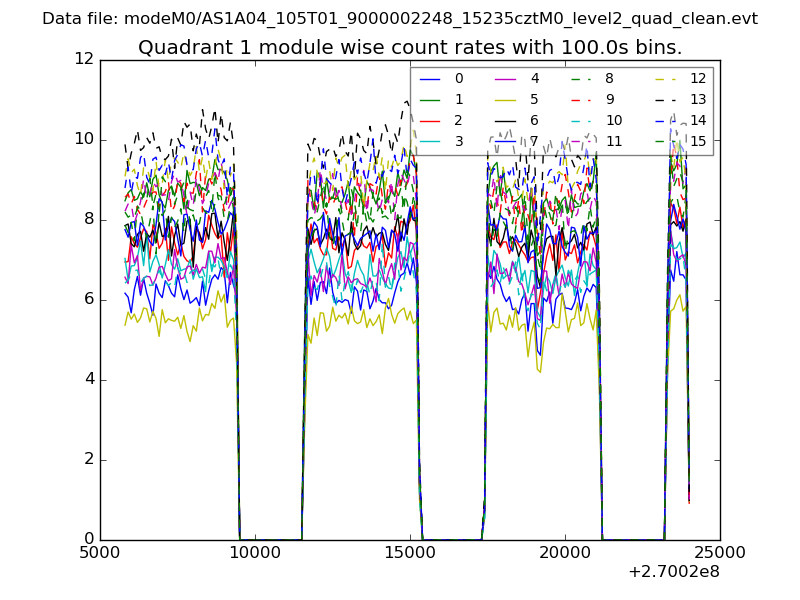
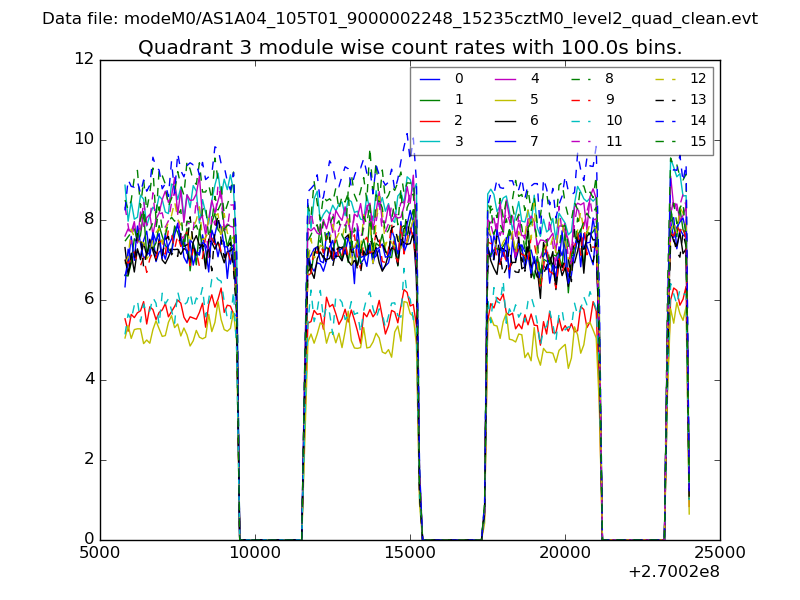
| Module-wise count rates for Quadrant A Data is divided into 100 sec bins |
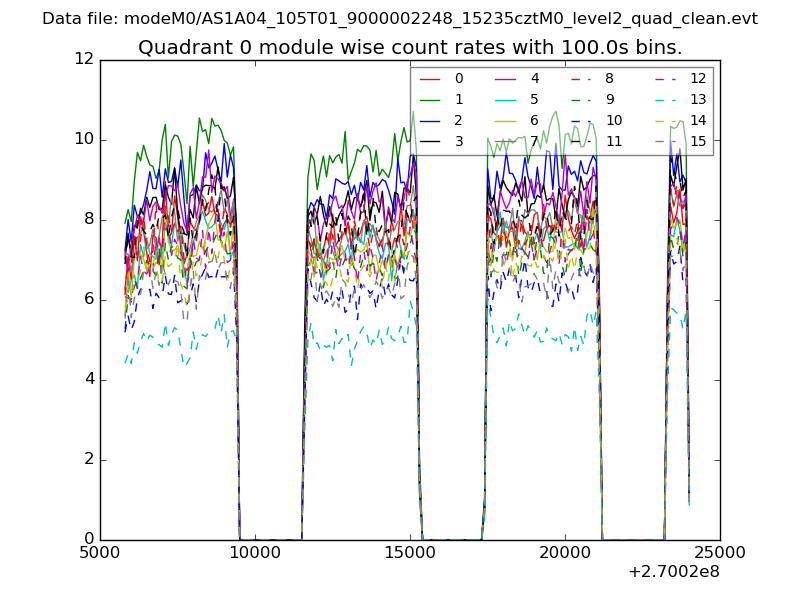 |
 |
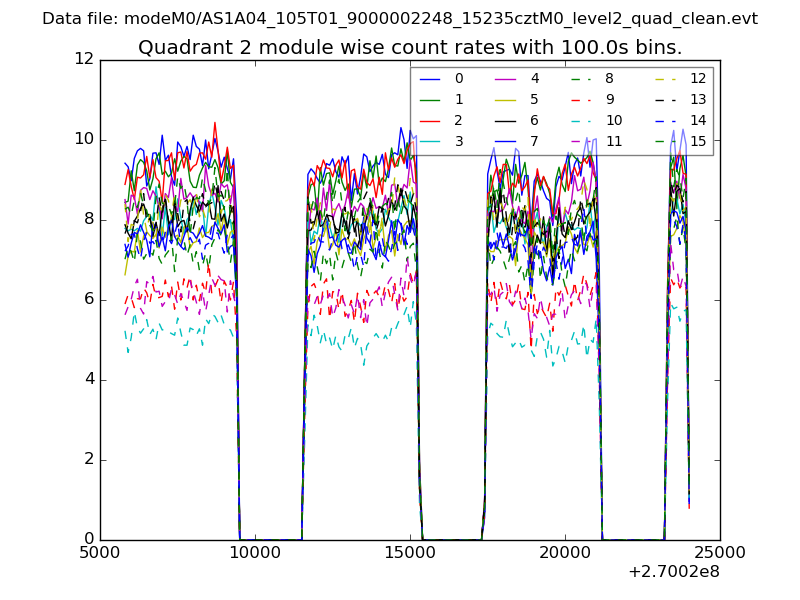
| Module-wise count rates for Quadrant B Data is divided into 100 sec bins |
 |
 |
| Module-wise count rates for Quadrant C Data is divided into 100 sec bins |
 |
 |
| Module-wise count rates for Quadrant D Data is divided into 100 sec bins |
 |
 |
| Parameter | Plot |
|---|---|
| CZT HV Monitor | 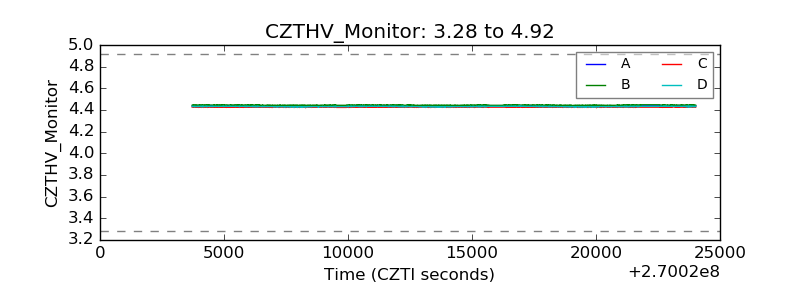 |
| D_VDD | 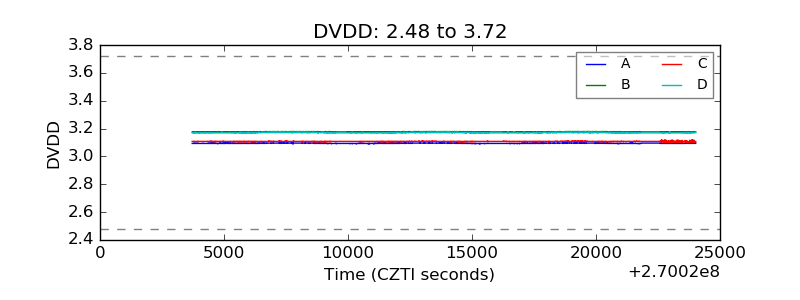 |
| Temperature 1 | 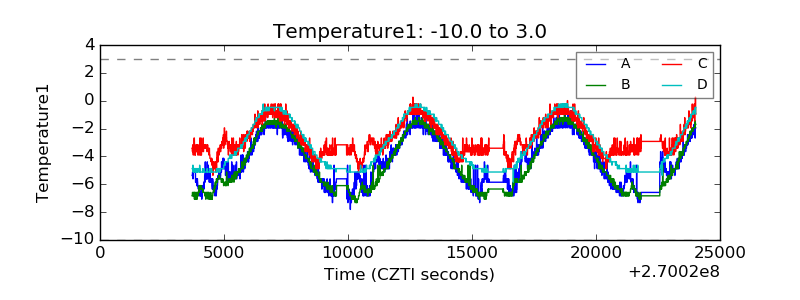 |
| Veto HV Monitor | 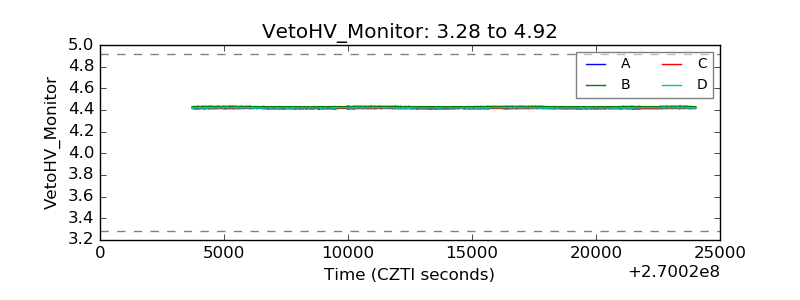 |
| Veto LLD | 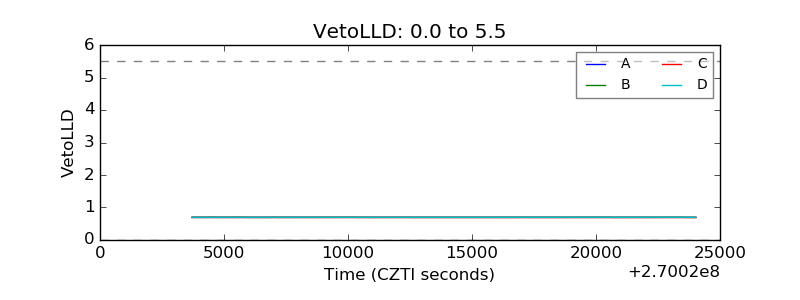 |
| Alpha Counter | 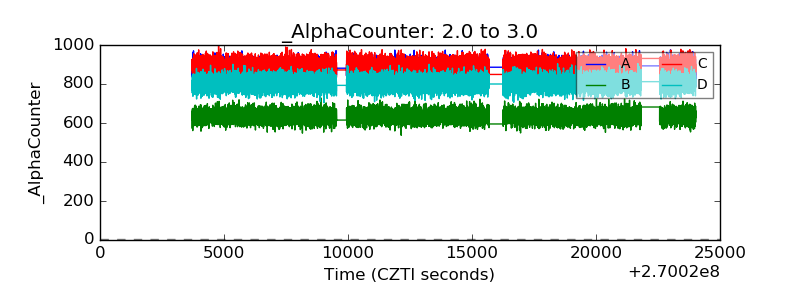 |
| _CPM_Rate | 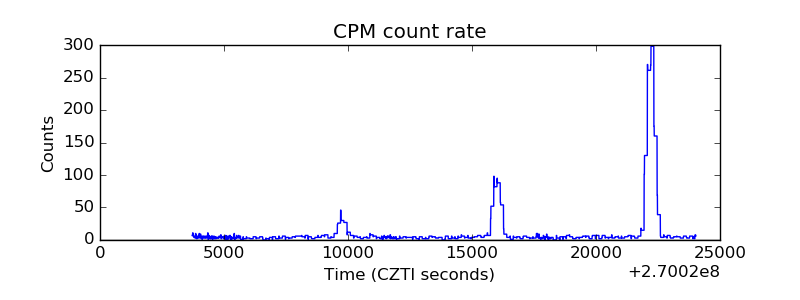 |
| CZT Counter | 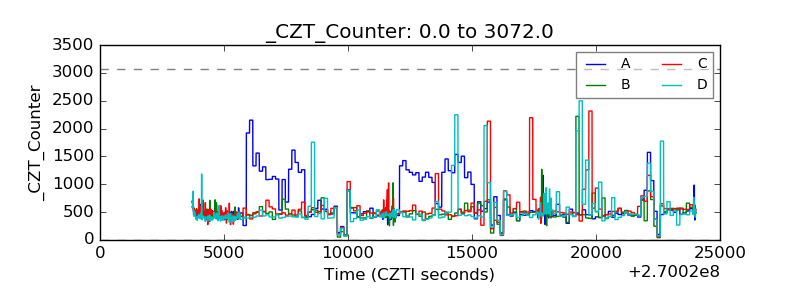 |
| +2.5 Volts monitor |  |
| +5 Volts monitor |  |
| _ROLL_ROT | 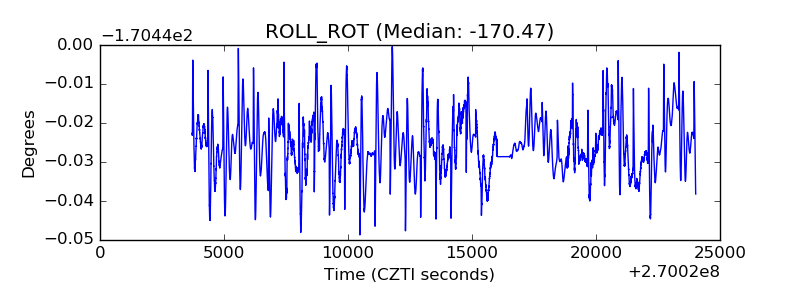 |
| _Roll_DEC | 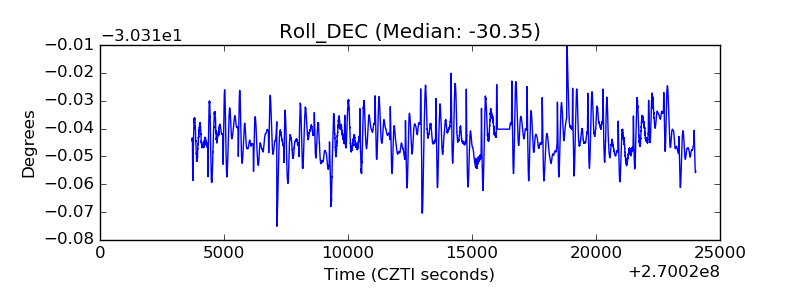 |
| _Roll_RA | 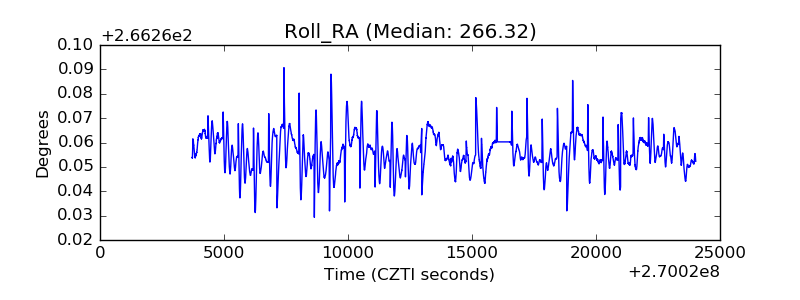 |
| Veto Counter | 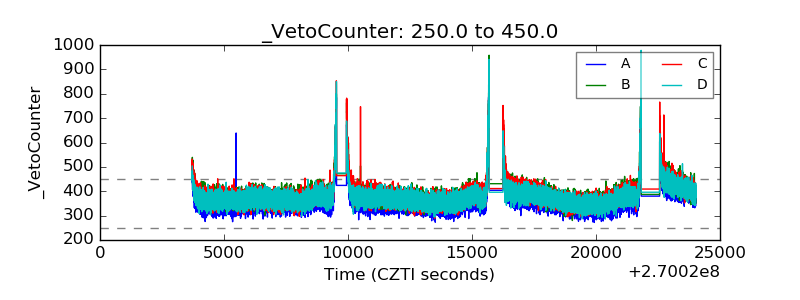 |