| Param | Original file | Final file |
|---|---|---|
| Filename | modeM0/AS1A04_105T01_9000002248_15236cztM0_level2.evt | modeM0/AS1A04_105T01_9000002248_15236cztM0_level2_quad_clean.evt |
| Size (bytes) | 509,569,920 | 95,045,760 |
| Size | 486.0 MB | 90.6 MB |
| Events in quadrant A | 3,553,012 | 601,169 |
| Events in quadrant B | 3,651,494 | 609,324 |
| Events in quadrant C | 4,013,642 | 599,182 |
| Events in quadrant D | 3,733,427 | 575,699 |
| Mode M9 | |||
|---|---|---|---|
| Quadrant | BADHDUFLAG | Total packets | Discarded packets |
| A | 0 | 16 | 0 |
| B | 0 | 16 | 0 |
| C | 0 | 16 | 0 |
| D | 0 | 16 | 0 |
| Mode SS | |||
|---|---|---|---|
| Quadrant | BADHDUFLAG | Total packets | Discarded packets |
| A | 0 | 146 | 0 |
| B | 0 | 146 | 0 |
| C | 0 | 146 | 0 |
| D | 0 | 146 | 0 |
| Mode M0 | |||
|---|---|---|---|
| Quadrant | BADHDUFLAG | Total packets | Discarded packets |
| A | 0 | 15108 | 3 |
| B | 0 | 15248 | 2 |
| C | 0 | 16079 | 2 |
| D | 0 | 15892 | 2 |
| Quadrant | Total seconds | Saturated seconds | Saturation percentage |
|---|---|---|---|
| A | 7078 | 122 | 1.723651% |
| B | 7078 | 139 | 1.963832% |
| C | 7078 | 112 | 1.582368% |
| D | 7078 | 250 | 3.532071% |
Noise dominated data is calculated using 1-second bins in cleaned event files. If a bin has >2000 counts, and if more than 50% of those come from <1% of pixels, then it is considered to be noise-dominated and hence unusable.
| Quadrant | # 1 sec bins | Bins with >0 counts | Bins with >2000 counts | High rate bins dominated by noise | Noise dominated (total time) | Noise dominated (detector-on time) | Marked lightcurve |
|---|---|---|---|---|---|---|---|
| A | 8739 | 7079 | 0 | 0 | 0.00% | 0.00% | 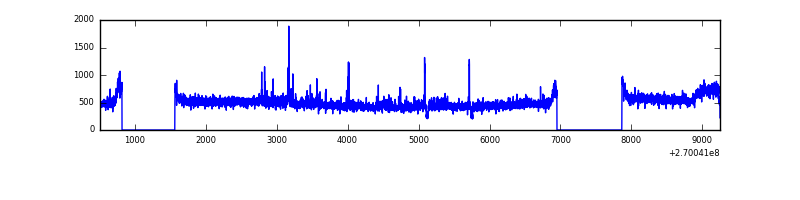 |
| B | 8739 | 7079 | 7 | 7 | 0.08% | 0.10% |  |
| C | 8739 | 7080 | 7 | 7 | 0.08% | 0.10% | 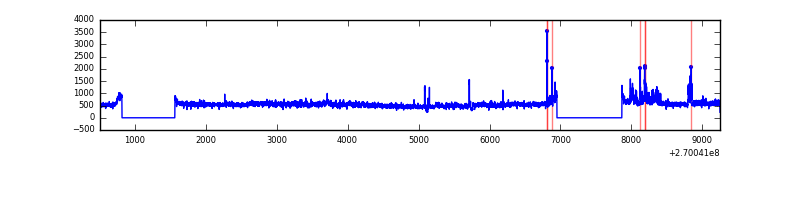 |
| D | 8739 | 7079 | 108 | 108 | 1.24% | 1.53% | 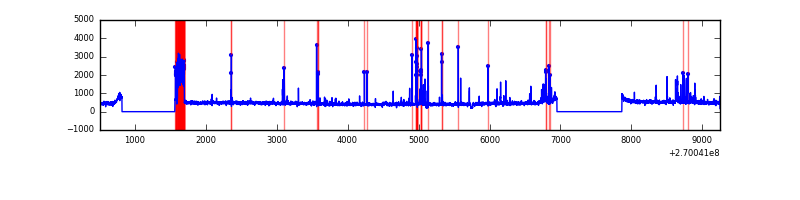 |
Top three noisy pixels from each quadrant. If the there are fewer than three noisy pixels in the level2.evt file, extra rows are filled as -1
| Pixel properties | Quadrant properties | ||||||
|---|---|---|---|---|---|---|---|
| Quadrant | DetID | PixID | Counts | Sigma | Mean | Median | Sigma |
| A | 12 | 189 | 68145 | 374.02 | 882 | 862 | 179.9 |
| A | 0 | 253 | 67501 | 370.44 | 882 | 862 | 179.9 |
| A | 15 | 233 | 10643 | 54.37 | 882 | 862 | 179.9 |
| B | 0 | 229 | 37484 | 217.41 | 878 | 856 | 168.5 |
| B | 4 | 142 | 27997 | 161.1 | 878 | 856 | 168.5 |
| B | 0 | 205 | 24675 | 141.38 | 878 | 856 | 168.5 |
| C | 3 | 233 | 516985 | 2619.84 | 851 | 856 | 197.0 |
| C | 0 | 207 | 151465 | 764.48 | 851 | 856 | 197.0 |
| C | 8 | 128 | 10380 | 48.34 | 851 | 856 | 197.0 |
| D | 1 | 255 | 218876 | 1051.91 | 850 | 825 | 207.3 |
| D | 2 | 33 | 139114 | 667.13 | 850 | 825 | 207.3 |
| D | 7 | 38 | 77277 | 368.82 | 850 | 825 | 207.3 |
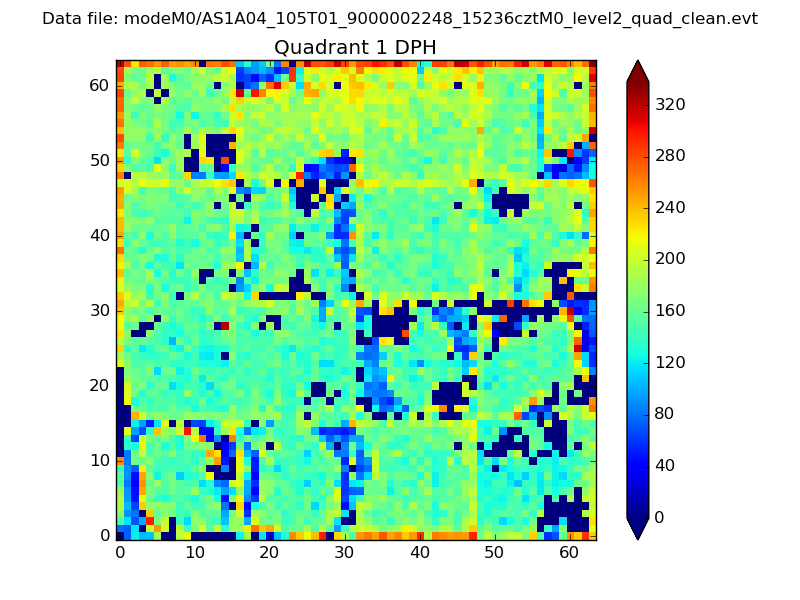
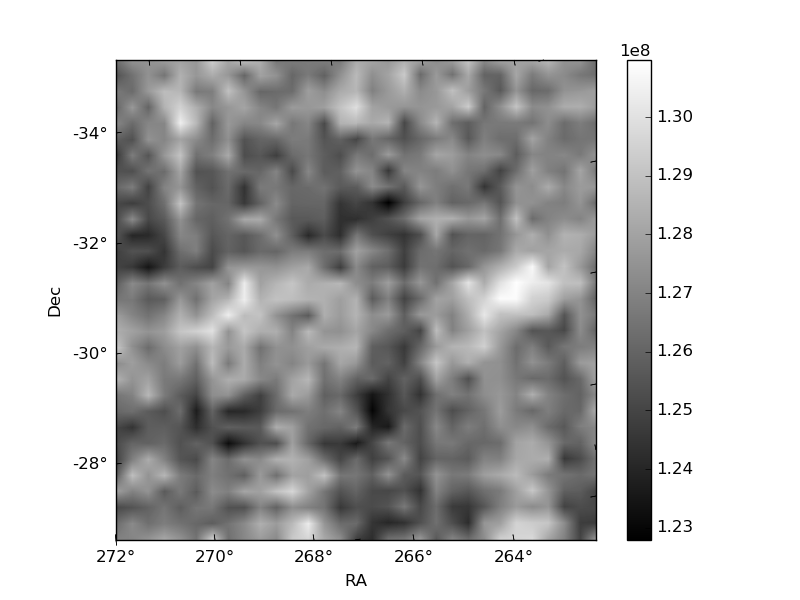
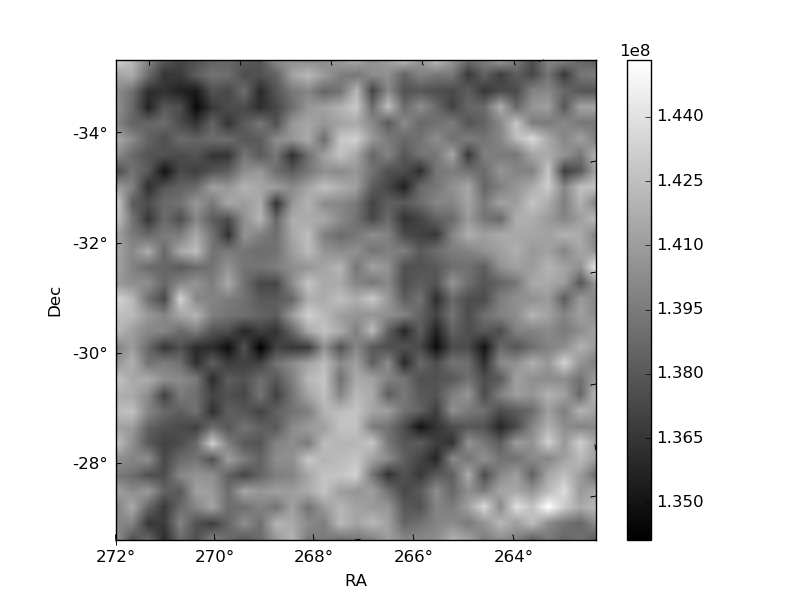
Histogram calculated using DETX and DETY for each event in the final _common_clean file
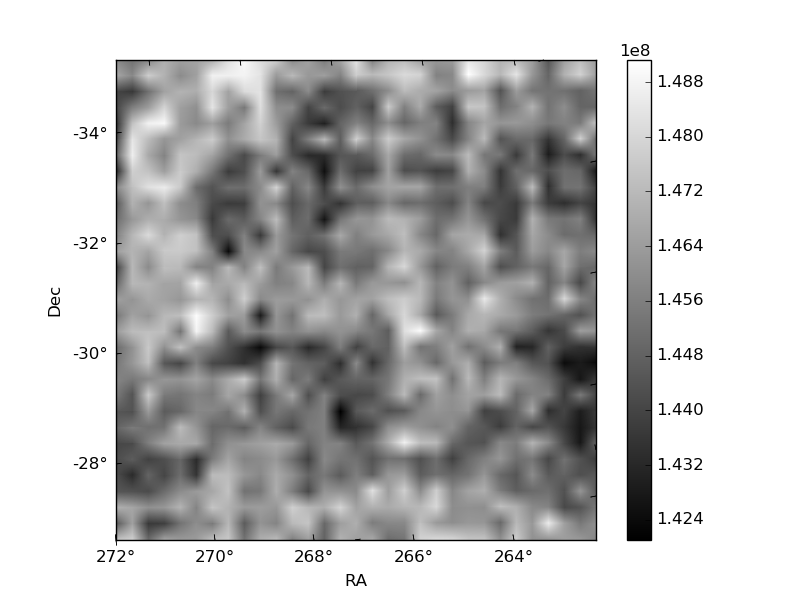
| Quadrant A | 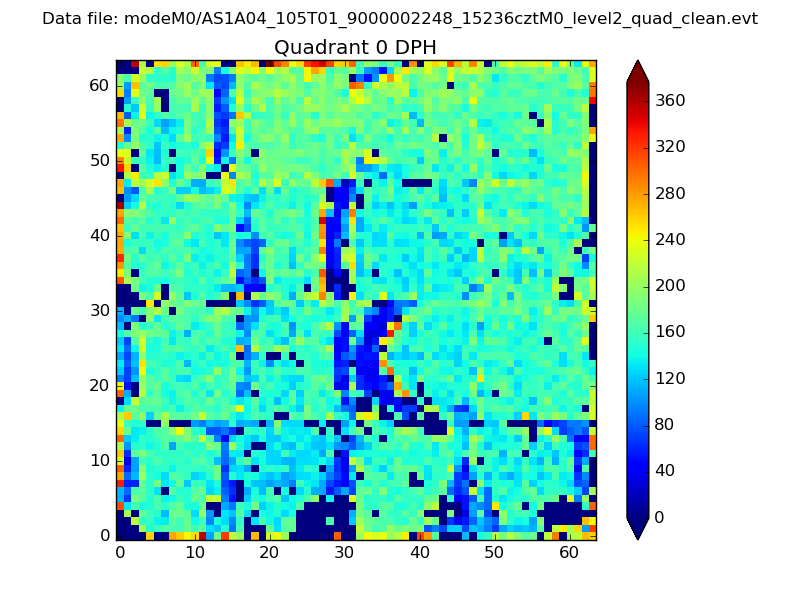 |
 |
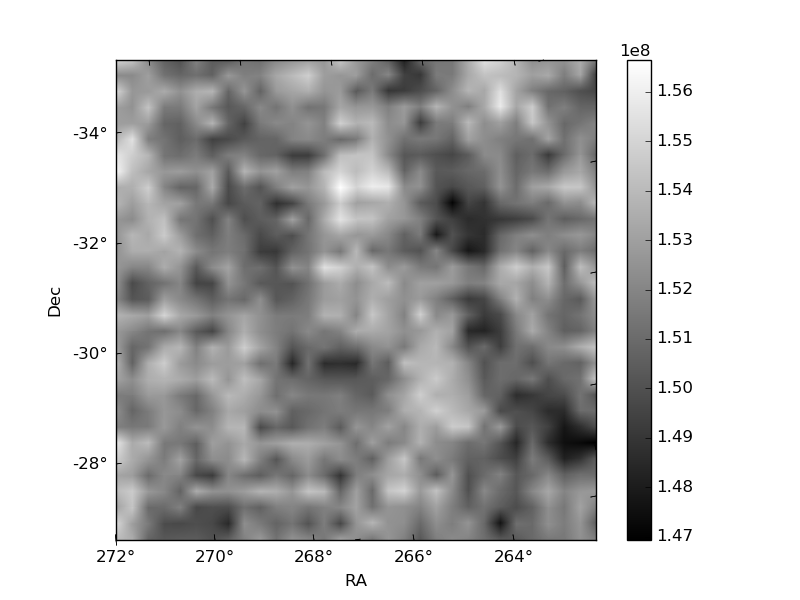
Quadrant B |
|---|---|---|---|
| Quadrant D | 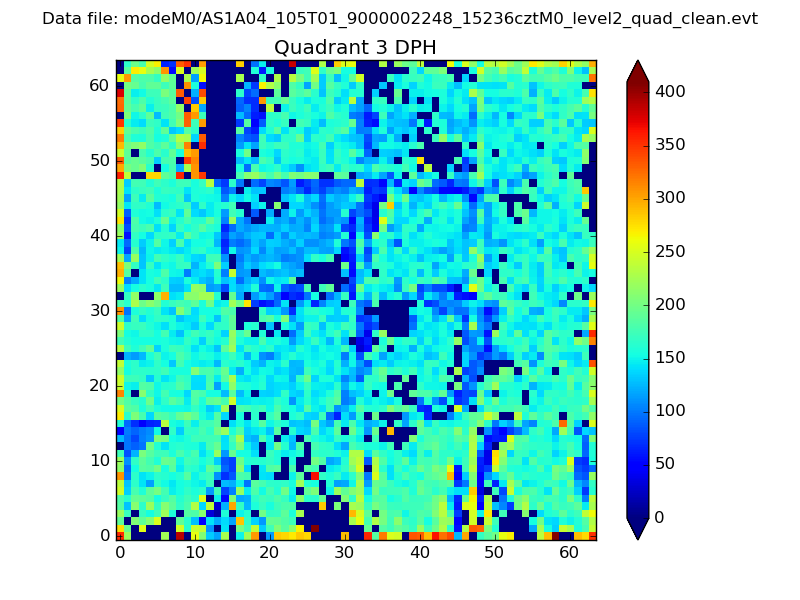 |
 |
Quadrant C |
| Plot type | Count rate plots | Images |
|---|---|---|
| Comparison with Poisson distribution Blue bars denote a histogram of data divided into 1 sec bins. Red curve is a Poisson curve with rate = median count rate of data. |
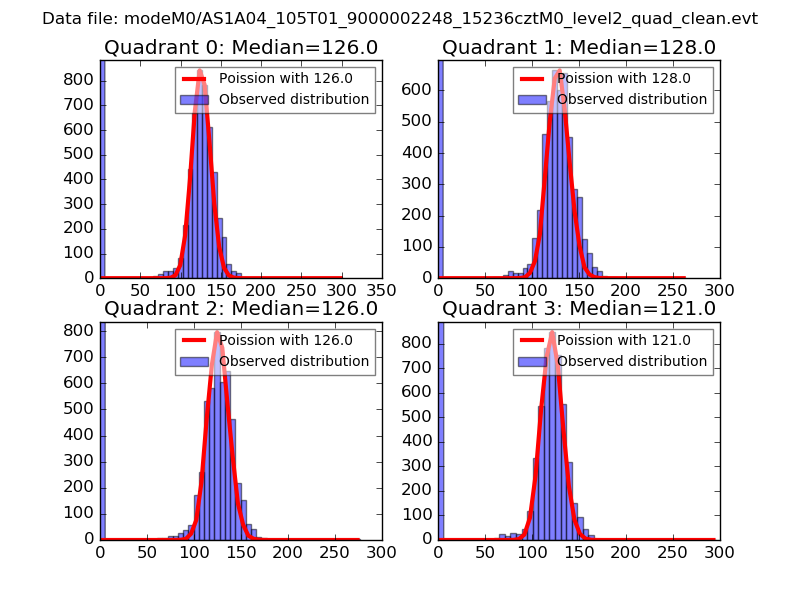 |
 |
| Quadrant-wise count rates Data is divided into 100 sec bins |
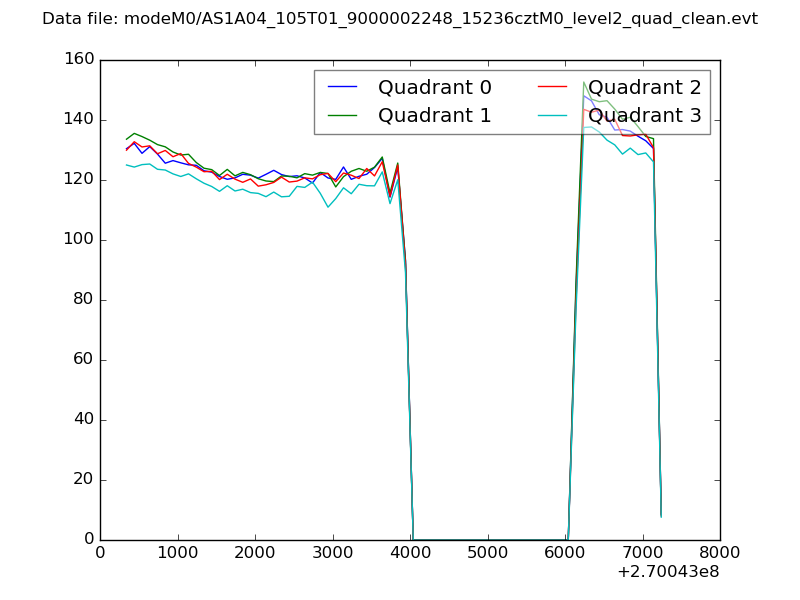 |
|
| Module-wise count rates for Quadrant A Data is divided into 100 sec bins |
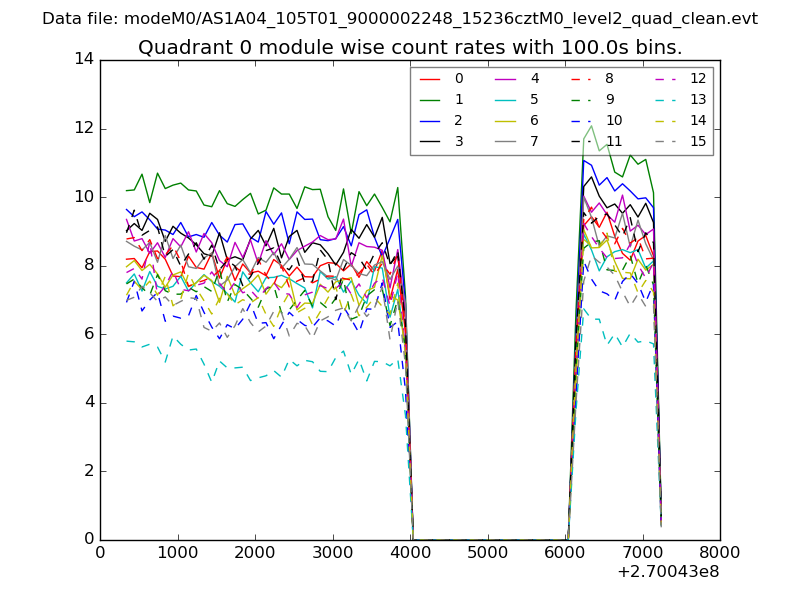 |
 |
| Module-wise count rates for Quadrant B Data is divided into 100 sec bins |
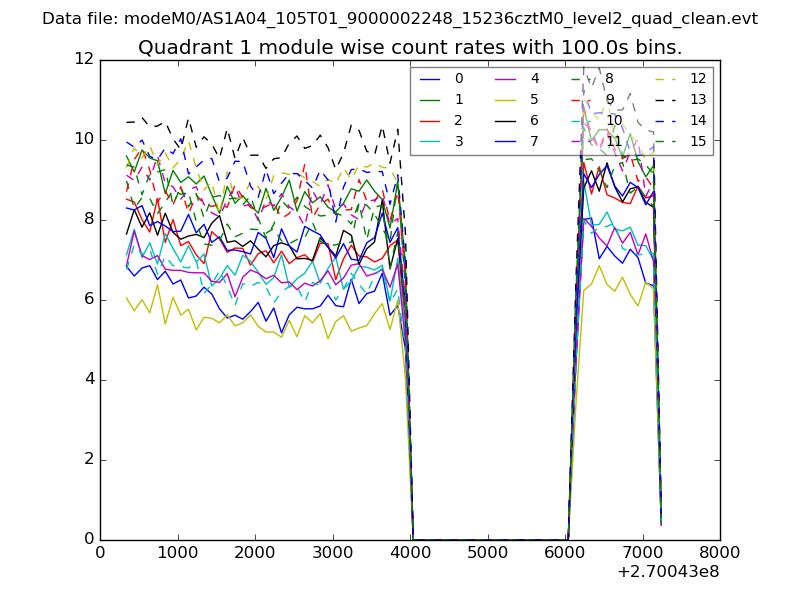 |
 |
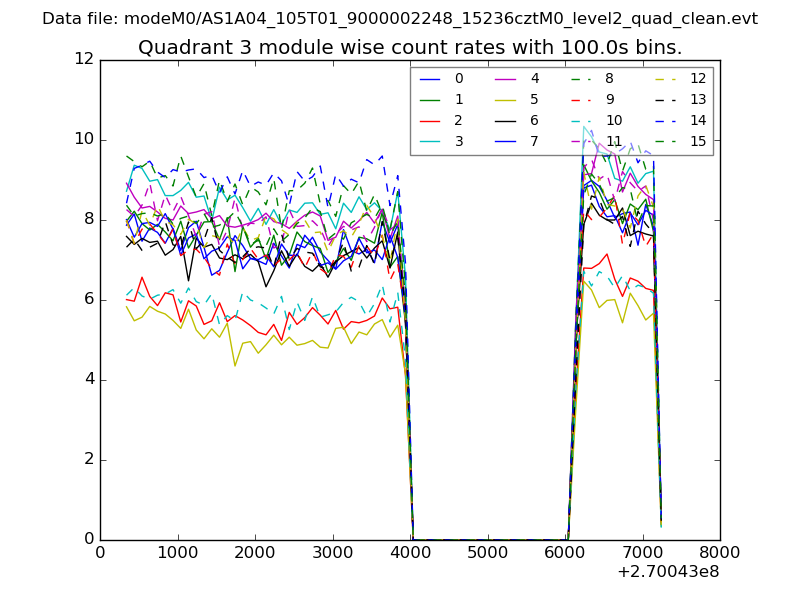
| Module-wise count rates for Quadrant C Data is divided into 100 sec bins |
 |
 |
| Module-wise count rates for Quadrant D Data is divided into 100 sec bins |
 |
 |
| Parameter | Plot |
|---|---|
| CZT HV Monitor | 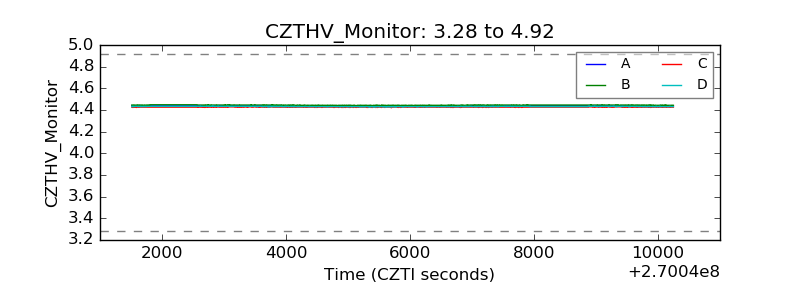 |
| D_VDD | 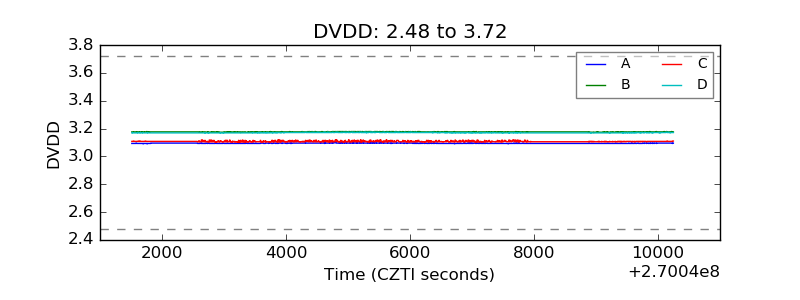 |
| Temperature 1 | 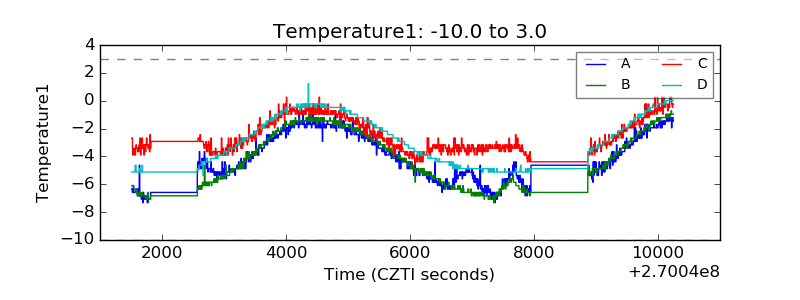 |
| Veto HV Monitor | 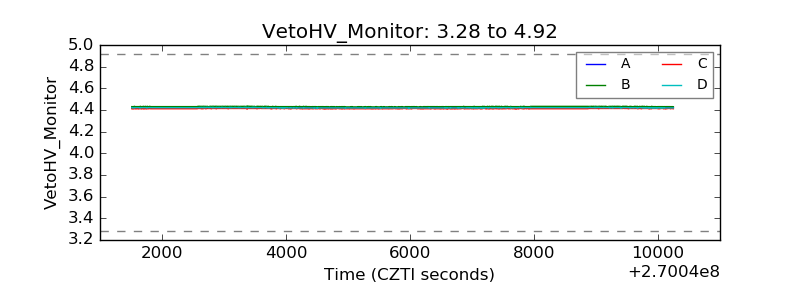 |
| Veto LLD | 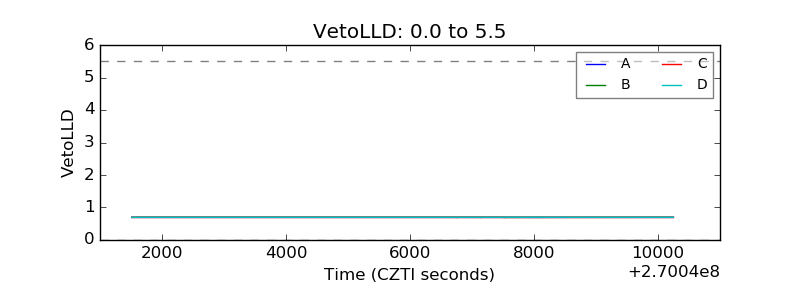 |
| Alpha Counter | 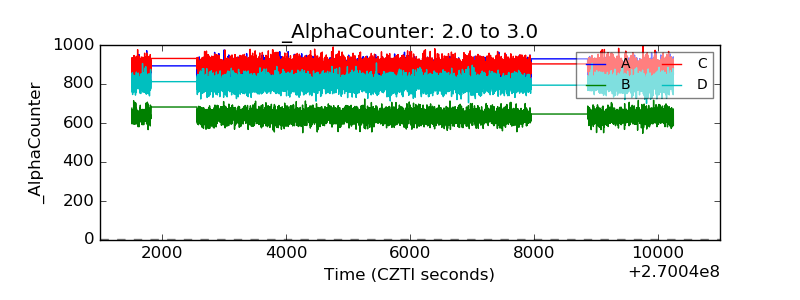 |
| _CPM_Rate | 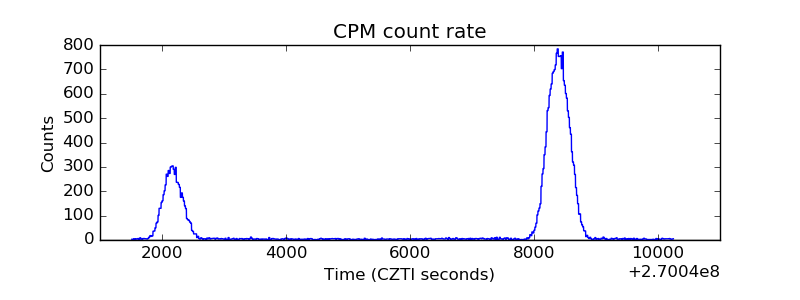 |
| CZT Counter |  |
| +2.5 Volts monitor | 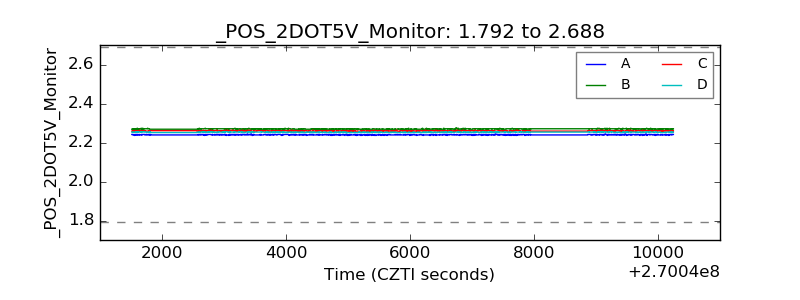 |
| +5 Volts monitor |  |
| _ROLL_ROT | 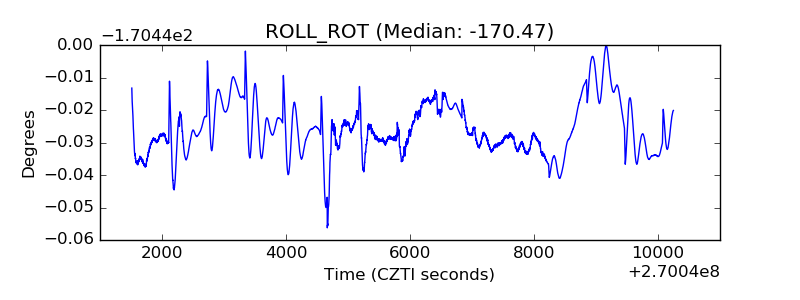 |
| _Roll_DEC | 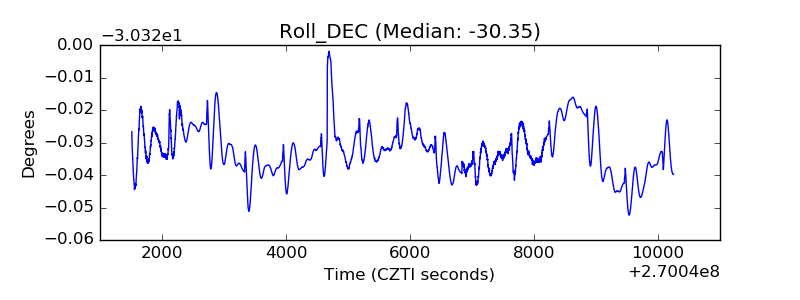 |
| _Roll_RA |  |
| Veto Counter | 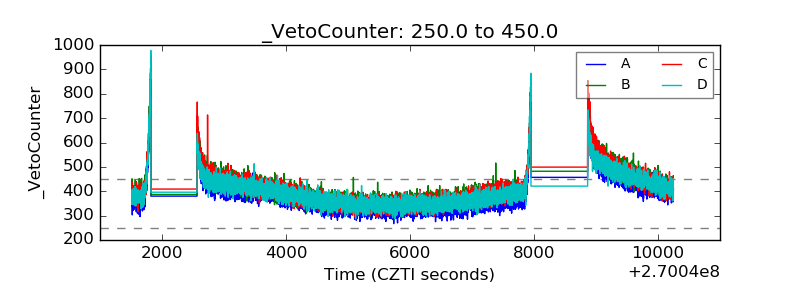 |