| Param | Original file | Final file |
|---|---|---|
| Filename | modeM0/AS1A04_105T01_9000002248_15239cztM0_level2.evt | modeM0/AS1A04_105T01_9000002248_15239cztM0_level2_quad_clean.evt |
| Size (bytes) | 466,591,680 | 95,976,000 |
| Size | 445.0 MB | 91.5 MB |
| Events in quadrant A | 3,102,831 | 634,628 |
| Events in quadrant B | 3,219,717 | 643,269 |
| Events in quadrant C | 4,493,631 | 606,526 |
| Events in quadrant D | 2,909,760 | 605,626 |
| Mode M9 | |||
|---|---|---|---|
| Quadrant | BADHDUFLAG | Total packets | Discarded packets |
| A | 0 | 11 | 0 |
| B | 0 | 11 | 0 |
| C | 0 | 11 | 0 |
| D | 0 | 11 | 0 |
| Mode SS | |||
|---|---|---|---|
| Quadrant | BADHDUFLAG | Total packets | Discarded packets |
| A | 0 | 122 | 0 |
| B | 0 | 122 | 0 |
| C | 0 | 122 | 0 |
| D | 0 | 122 | 0 |
| Mode M0 | |||
|---|---|---|---|
| Quadrant | BADHDUFLAG | Total packets | Discarded packets |
| A | 0 | 13258 | 1 |
| B | 0 | 13417 | 1 |
| C | 0 | 17390 | 1 |
| D | 0 | 12796 | 1 |
| Quadrant | Total seconds | Saturated seconds | Saturation percentage |
|---|---|---|---|
| A | 5961 | 68 | 1.140748% |
| B | 5961 | 68 | 1.140748% |
| C | 5961 | 373 | 6.257339% |
| D | 5961 | 59 | 0.989767% |
Noise dominated data is calculated using 1-second bins in cleaned event files. If a bin has >2000 counts, and if more than 50% of those come from <1% of pixels, then it is considered to be noise-dominated and hence unusable.
| Quadrant | # 1 sec bins | Bins with >0 counts | Bins with >2000 counts | High rate bins dominated by noise | Noise dominated (total time) | Noise dominated (detector-on time) | Marked lightcurve |
|---|---|---|---|---|---|---|---|
| A | 7047 | 5962 | 11 | 11 | 0.16% | 0.18% | 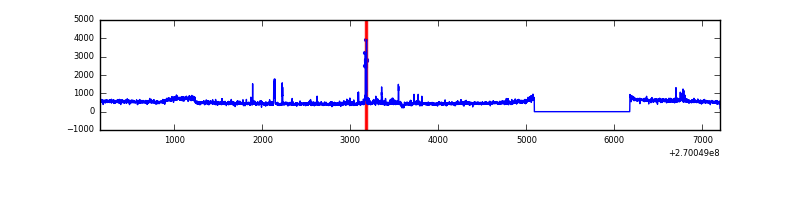 |
| B | 7047 | 5962 | 8 | 8 | 0.11% | 0.13% | 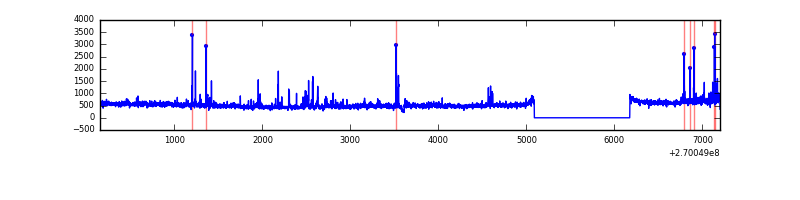 |
| C | 7047 | 5962 | 204 | 204 | 2.89% | 3.42% | 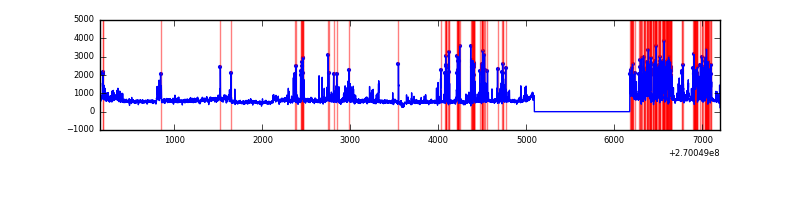 |
| D | 7047 | 5962 | 13 | 13 | 0.18% | 0.22% | 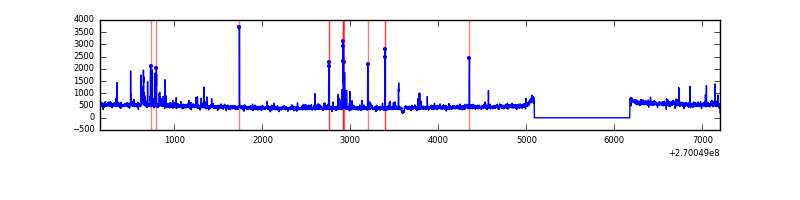 |
Top three noisy pixels from each quadrant. If the there are fewer than three noisy pixels in the level2.evt file, extra rows are filled as -1
| Pixel properties | Quadrant properties | ||||||
|---|---|---|---|---|---|---|---|
| Quadrant | DetID | PixID | Counts | Sigma | Mean | Median | Sigma |
| A | 12 | 189 | 107411 | 699.54 | 744 | 729 | 152.5 |
| A | 0 | 253 | 67803 | 439.82 | 744 | 729 | 152.5 |
| A | 9 | 143 | 51034 | 329.86 | 744 | 729 | 152.5 |
| B | 3 | 64 | 118208 | 826.74 | 741 | 723 | 142.1 |
| B | 10 | 16 | 49753 | 345.02 | 741 | 723 | 142.1 |
| B | 0 | 229 | 37099 | 255.98 | 741 | 723 | 142.1 |
| C | 4 | 254 | 986055 | 6153.13 | 694 | 700 | 160.1 |
| C | 3 | 233 | 533756 | 3328.71 | 694 | 700 | 160.1 |
| C | 7 | 247 | 159805 | 993.54 | 694 | 700 | 160.1 |
| D | 2 | 33 | 66065 | 371.2 | 721 | 701 | 176.1 |
| D | 7 | 38 | 50819 | 284.62 | 721 | 701 | 176.1 |
| D | 2 | 234 | 26173 | 144.65 | 721 | 701 | 176.1 |
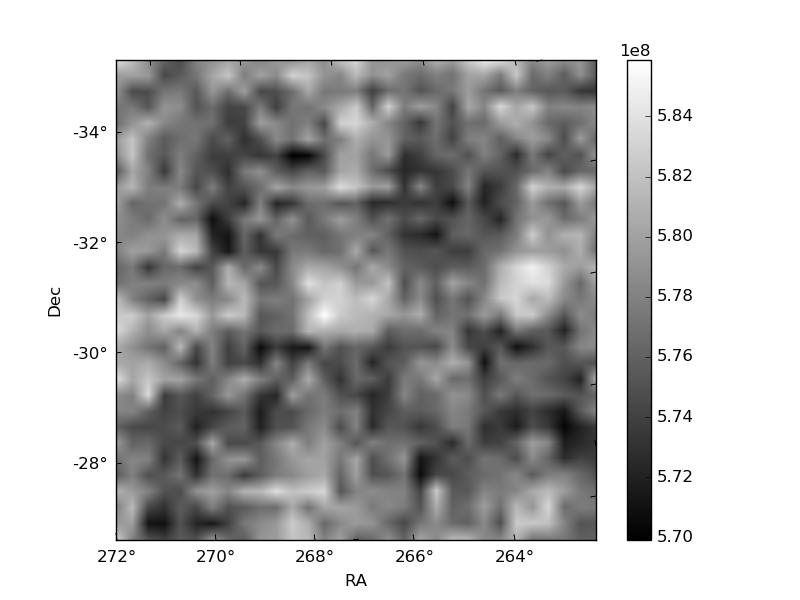
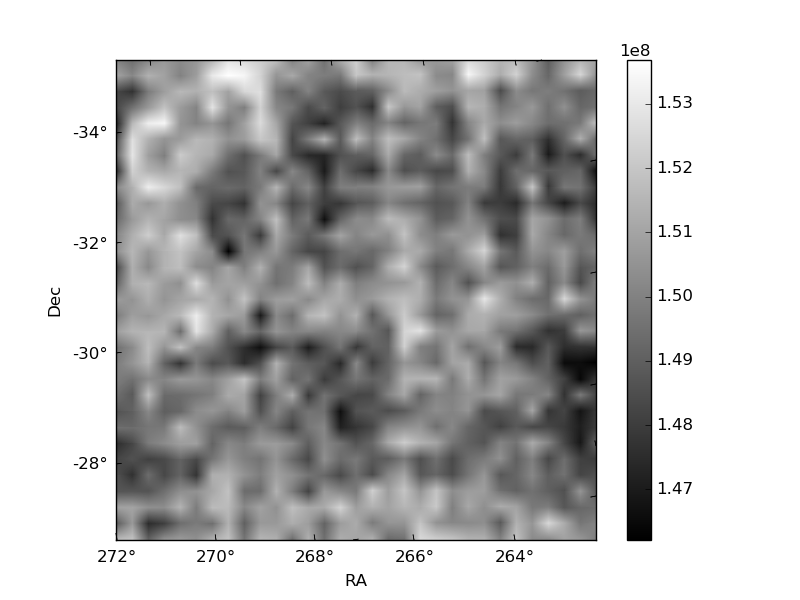
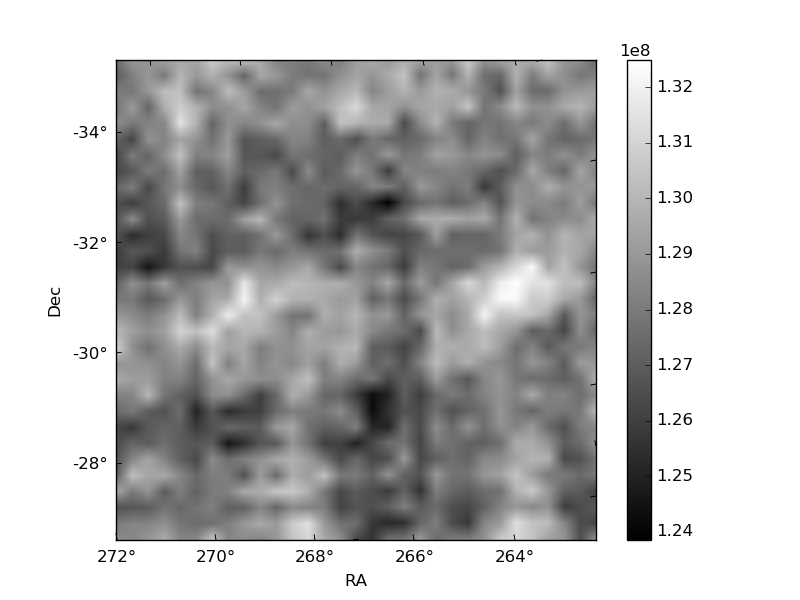
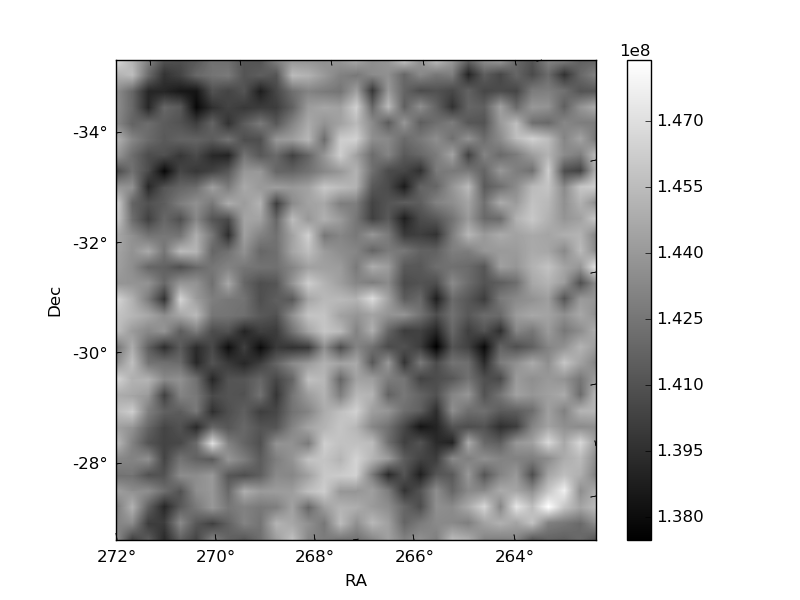
Histogram calculated using DETX and DETY for each event in the final _common_clean file
| Quadrant A | 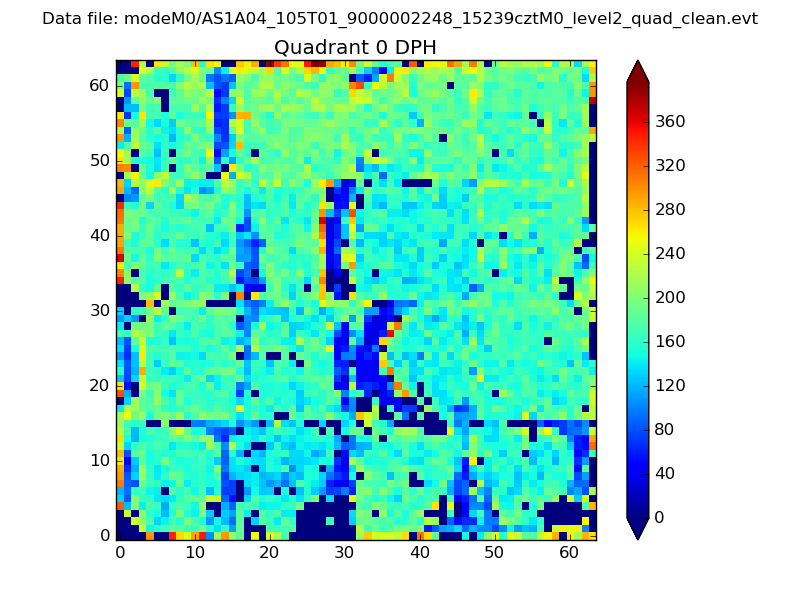 |
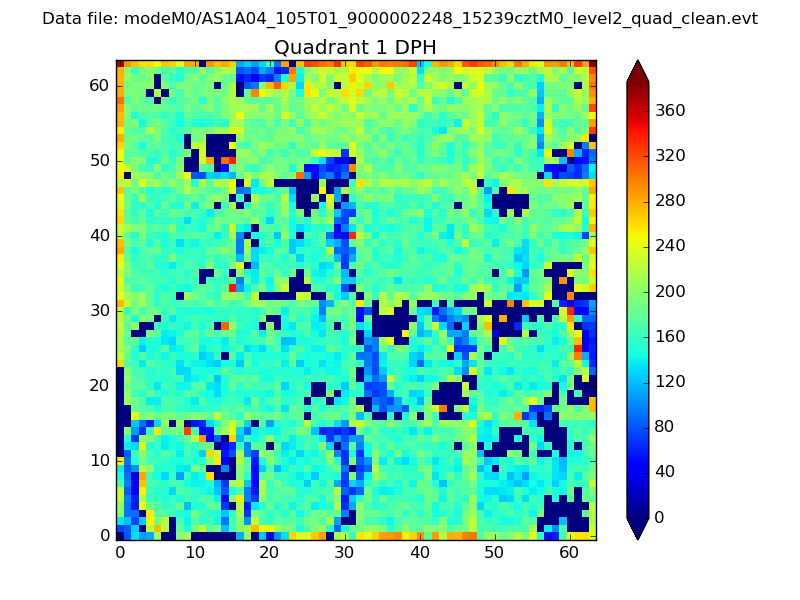 |
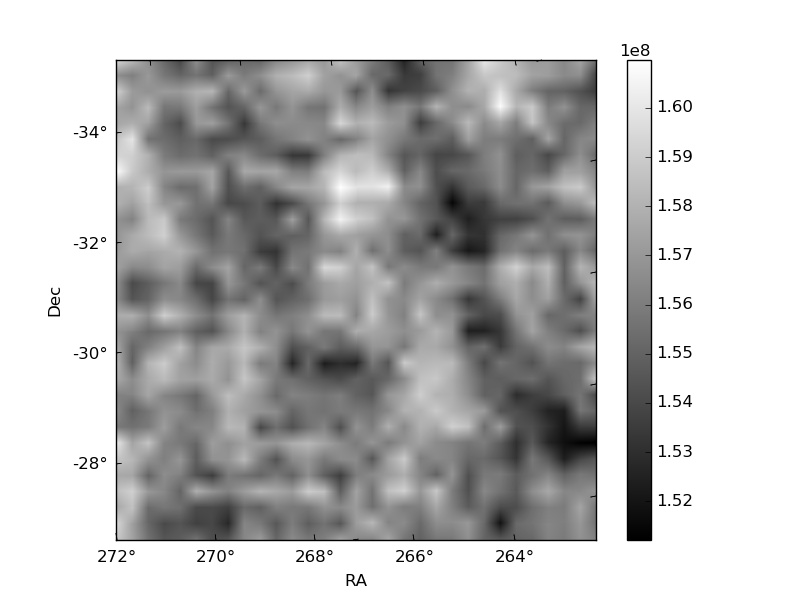
Quadrant B |
|---|---|---|---|
| Quadrant D | 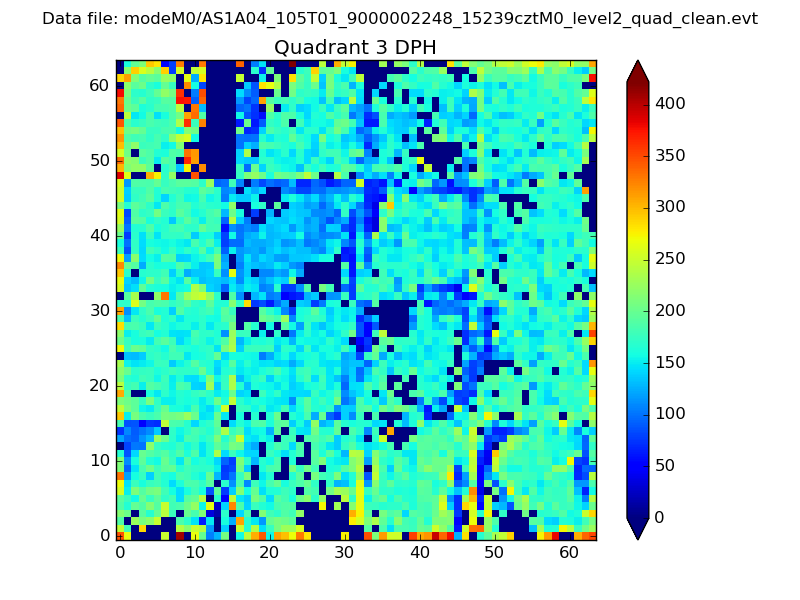 |
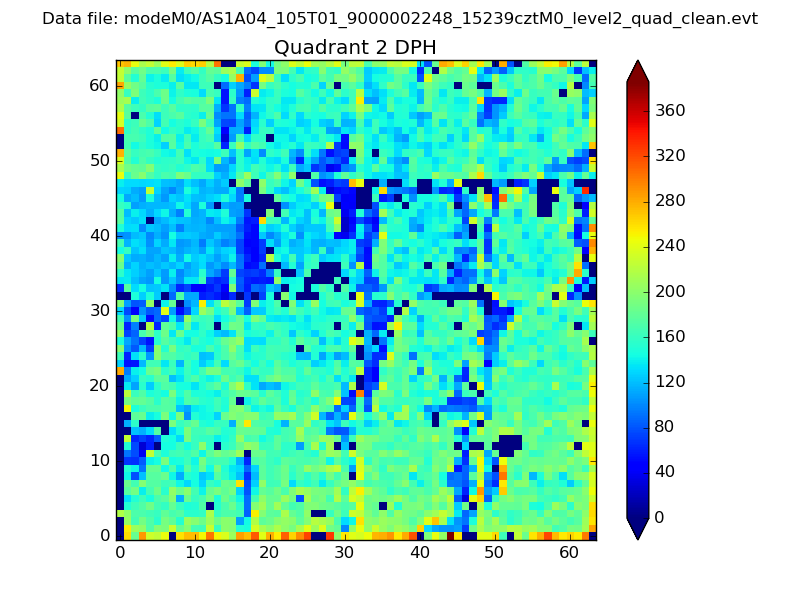 |
Quadrant C |
| Plot type | Count rate plots | Images |
|---|---|---|
| Comparison with Poisson distribution Blue bars denote a histogram of data divided into 1 sec bins. Red curve is a Poisson curve with rate = median count rate of data. |
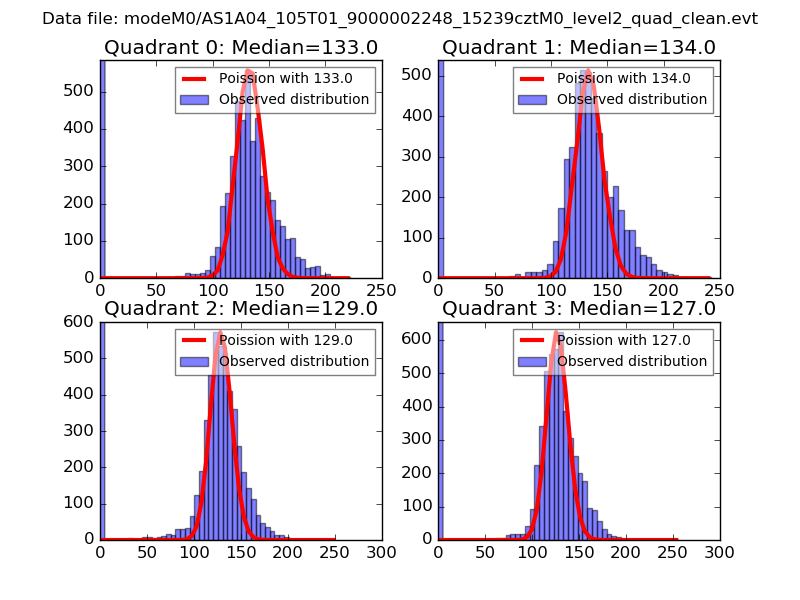 |
 |
| Quadrant-wise count rates Data is divided into 100 sec bins |
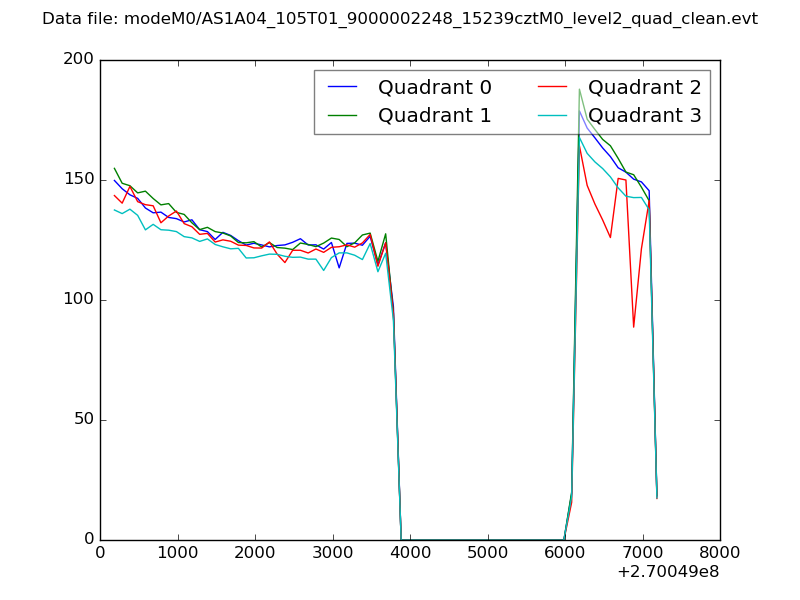 |
|
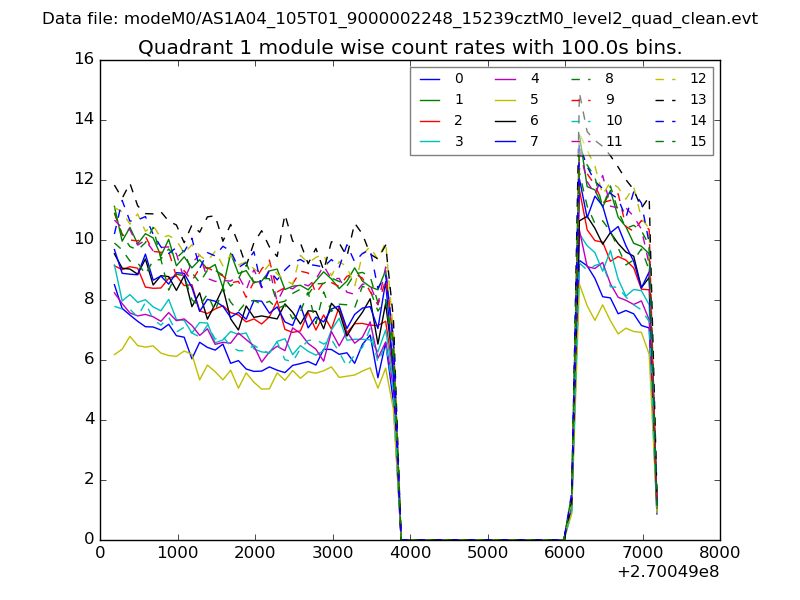
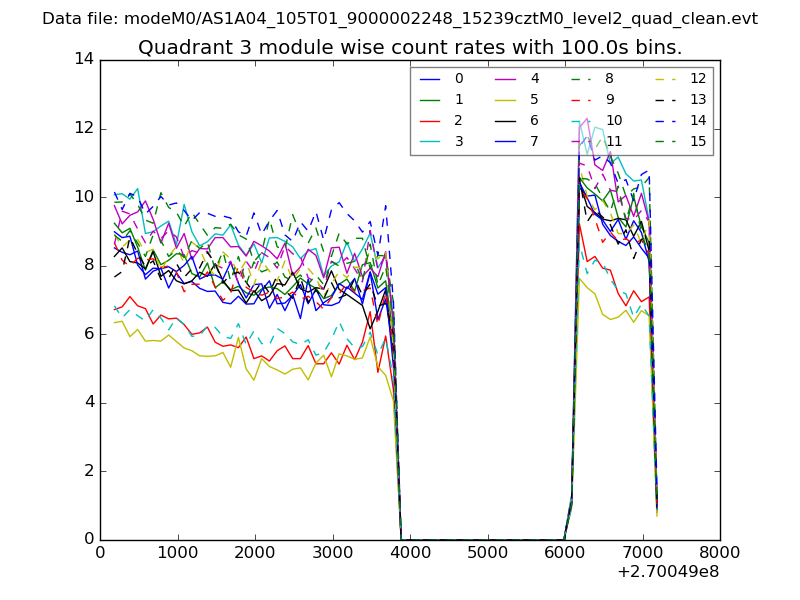
| Module-wise count rates for Quadrant A Data is divided into 100 sec bins |
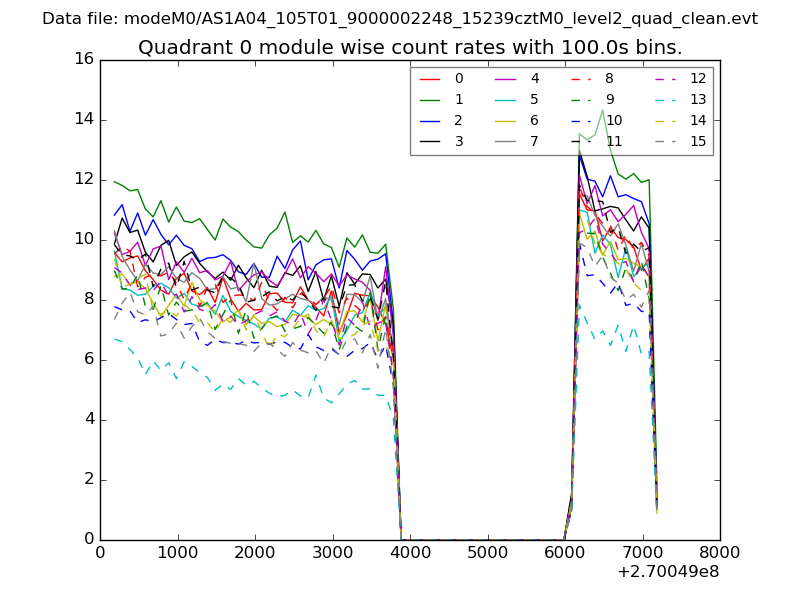 |
 |
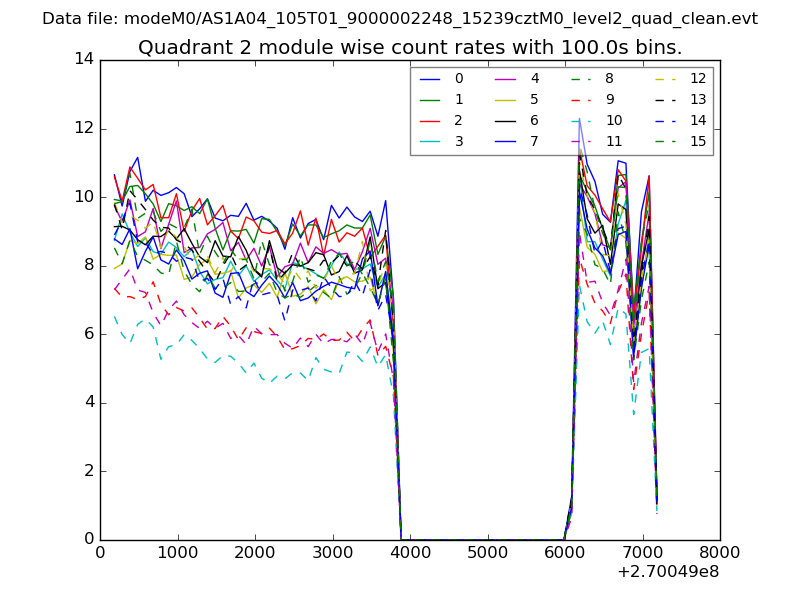
| Module-wise count rates for Quadrant B Data is divided into 100 sec bins |
 |
 |
| Module-wise count rates for Quadrant C Data is divided into 100 sec bins |
 |
 |
| Module-wise count rates for Quadrant D Data is divided into 100 sec bins |
 |
 |
| Parameter | Plot |
|---|---|
| CZT HV Monitor | 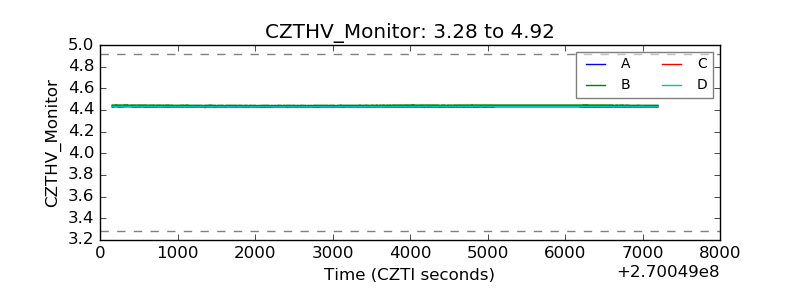 |
| D_VDD | 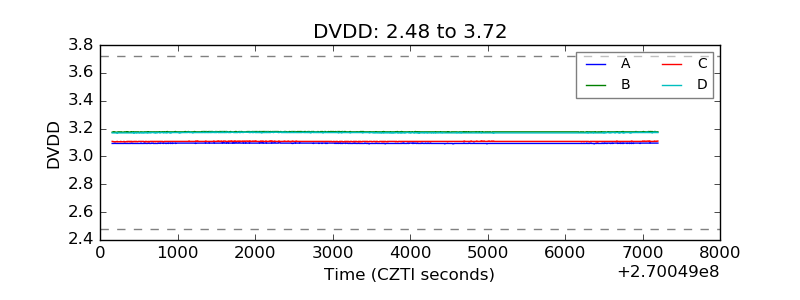 |
| Temperature 1 | 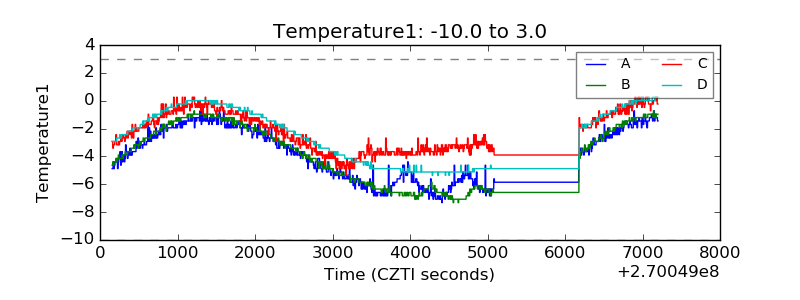 |
| Veto HV Monitor | 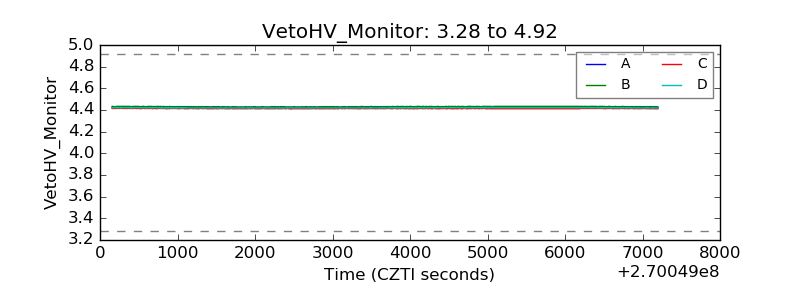 |
| Veto LLD | 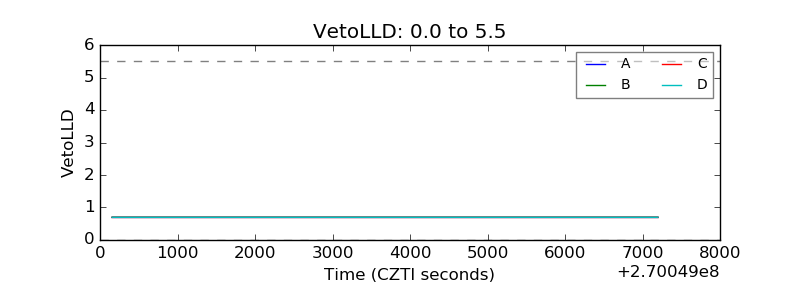 |
| Alpha Counter | 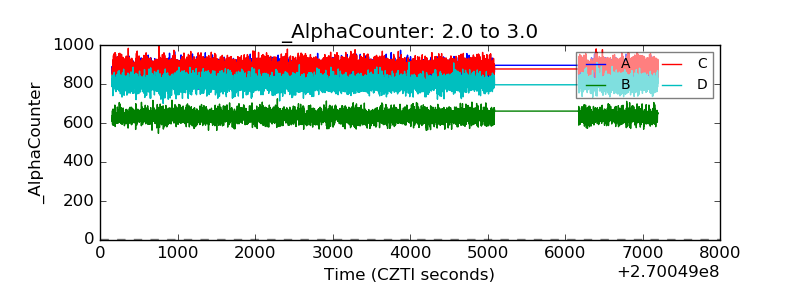 |
| _CPM_Rate | 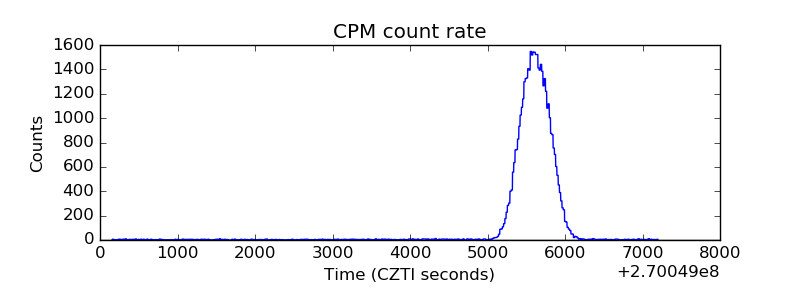 |
| CZT Counter | 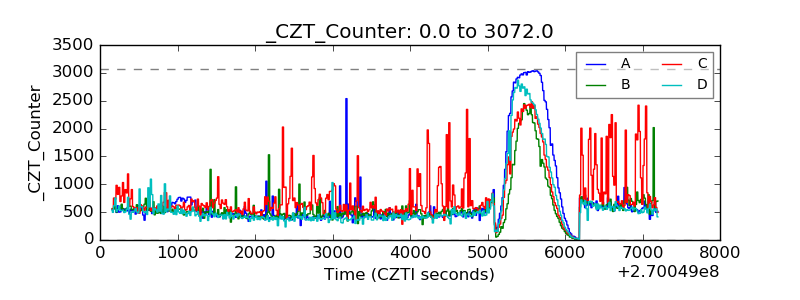 |
| +2.5 Volts monitor |  |
| +5 Volts monitor |  |
| _ROLL_ROT | 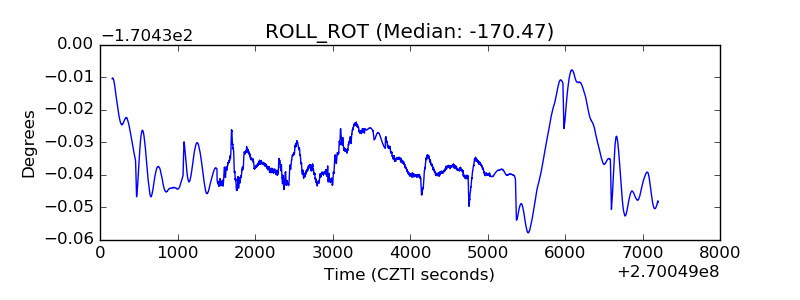 |
| _Roll_DEC | 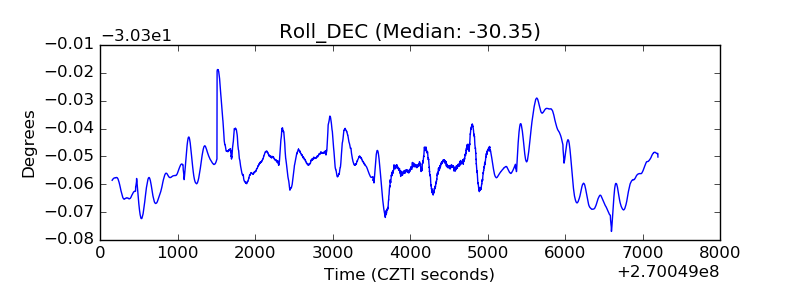 |
| _Roll_RA | 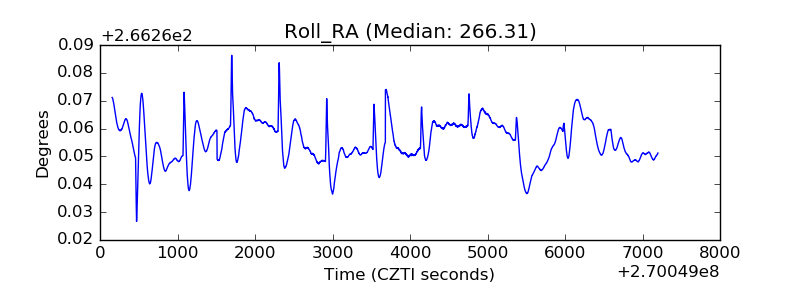 |
| Veto Counter | 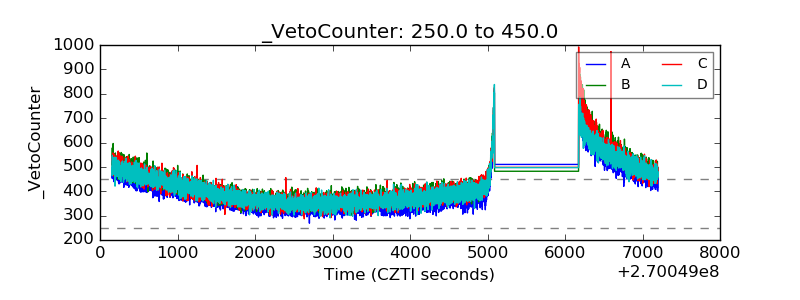 |