| Param | Original file | Final file |
|---|---|---|
| Filename | modeM0/AS1T02_072T01_9000002250cztM0_level2.fits | modeM0/AS1T02_072T01_9000002250cztM0_level2_quad_clean.evt |
| Size (bytes) | 485,841,600 | 632,401,920 |
| Size | 463.3 MB | 603.1 MB |
| Events in quadrant A | 2,966,700 | 4,102,083 |
| Events in quadrant B | 2,848,362 | 4,098,428 |
| Events in quadrant C | 2,854,960 | 3,800,001 |
| Events in quadrant D | 2,536,794 | 3,648,131 |
| Mode M9 | |||
|---|---|---|---|
| Quadrant | BADHDUFLAG | Total packets | Discarded packets |
| A | 0 | 81 | 0 |
| B | 0 | 81 | 0 |
| C | 0 | 81 | 0 |
| D | 0 | 81 | 0 |
| Mode SS | |||
|---|---|---|---|
| Quadrant | BADHDUFLAG | Total packets | Discarded packets |
| A | 0 | 1042 | 0 |
| B | 0 | 1042 | 0 |
| C | 0 | 1042 | 0 |
| D | 0 | 1042 | 0 |
| Mode M0 | |||
|---|---|---|---|
| Quadrant | BADHDUFLAG | Total packets | Discarded packets |
| A | 0 | 108414 | 0 |
| B | 0 | 116707 | 0 |
| C | 0 | 136168 | 0 |
| D | 0 | 115462 | 0 |
| Quadrant | Total seconds | Saturated seconds | Saturation percentage |
|---|---|---|---|
| A | 51083 | 452 | 0.884834% |
| B | 51083 | 1236 | 2.419592% |
| C | 51083 | 2772 | 5.426463% |
| D | 51083 | 663 | 1.297888% |
Noise dominated data is calculated using 1-second bins in cleaned event files. If a bin has >2000 counts, and if more than 50% of those come from <1% of pixels, then it is considered to be noise-dominated and hence unusable.
| Quadrant | # 1 sec bins | Bins with >0 counts | Bins with >2000 counts | High rate bins dominated by noise | Noise dominated (total time) | Noise dominated (detector-on time) | Marked lightcurve |
|---|---|---|---|---|---|---|---|
| A | 59263 | 51057 | 0 | 0 | 0.00% | 0.00% |  |
| B | 59263 | 51057 | 0 | 0 | 0.00% | 0.00% |  |
| C | 59263 | 51031 | 0 | 0 | 0.00% | 0.00% |  |
| D | 59263 | 51059 | 0 | 0 | 0.00% | 0.00% |  |
Top three noisy pixels from each quadrant. If the there are fewer than three noisy pixels in the level2.evt file, extra rows are filled as -1
| Pixel properties | Quadrant properties | ||||||
|---|---|---|---|---|---|---|---|
| Quadrant | DetID | PixID | Counts | Sigma | Mean | Median | Sigma |
| A | 0 | 29 | 2912 | 11.39 | 773 | 729 | 191.7 |
| A | 7 | 110 | 2389 | 8.66 | 773 | 729 | 191.7 |
| A | 0 | 30 | 2235 | 7.86 | 773 | 729 | 191.7 |
| B | 2 | 9 | 2441 | 12.08 | 752 | 721 | 142.3 |
| B | 2 | 8 | 1956 | 8.68 | 752 | 721 | 142.3 |
| B | 14 | 254 | 1922 | 8.44 | 752 | 721 | 142.3 |
| C | 1 | 81 | 2223 | 7.89 | 752 | 705 | 192.4 |
| C | 1 | 80 | 2185 | 7.69 | 752 | 705 | 192.4 |
| C | 12 | 241 | 1997 | 6.71 | 752 | 705 | 192.4 |
| D | 3 | 14 | 1843 | 6.11 | 723 | 658 | 194.1 |
| D | 10 | 189 | 1816 | 5.97 | 723 | 658 | 194.1 |
| D | 6 | 67 | 1784 | 5.8 | 723 | 658 | 194.1 |
Histogram calculated using DETX and DETY for each event in the final _common_clean file
| Quadrant A | 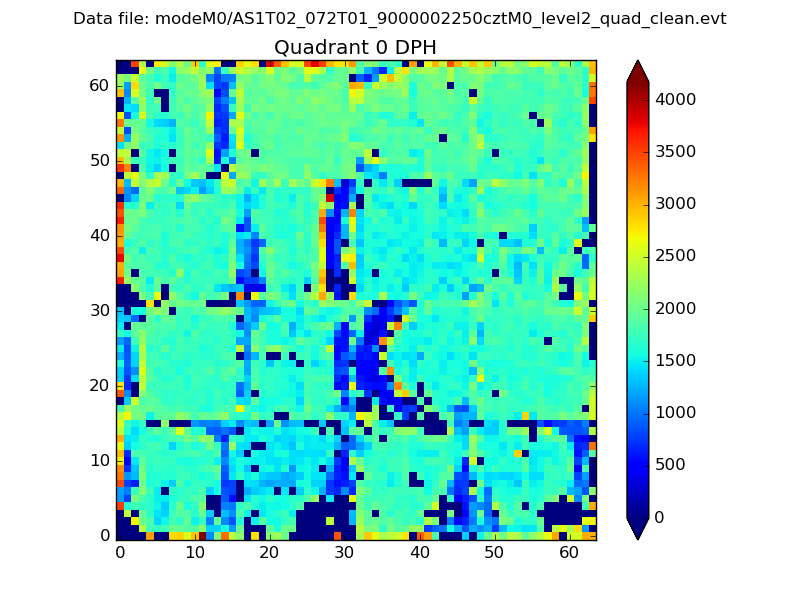 |
 |
Quadrant B |
|---|---|---|---|
| Quadrant D | 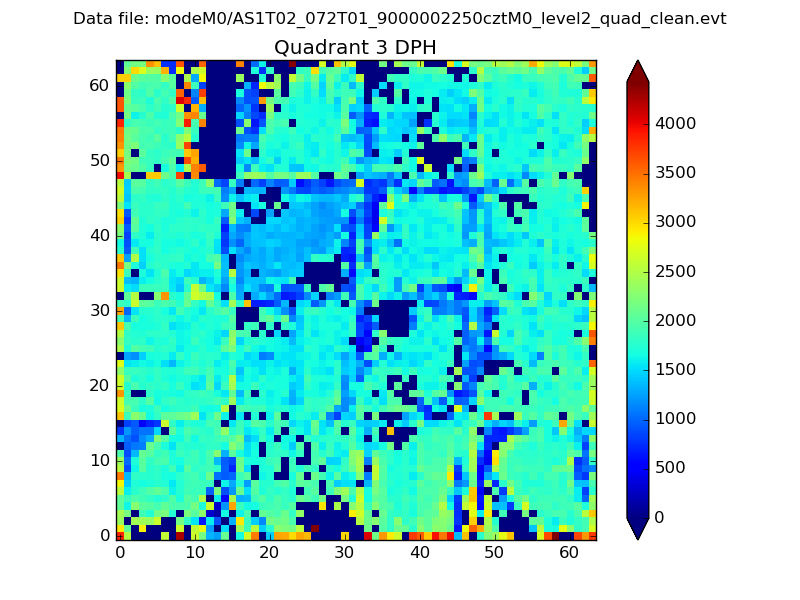 |
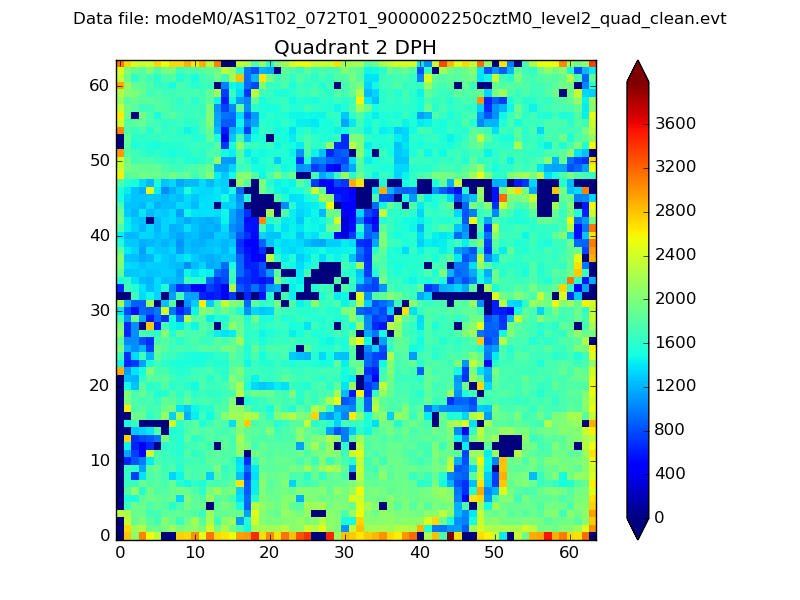 |
Quadrant C |
| Plot type | Count rate plots | Images |
|---|---|---|
| Comparison with Poisson distribution Blue bars denote a histogram of data divided into 1 sec bins. Red curve is a Poisson curve with rate = median count rate of data. |
 |
 |
| Quadrant-wise count rates Data is divided into 100 sec bins |
 |
|
| Module-wise count rates for Quadrant A Data is divided into 100 sec bins |
 |
 |
| Module-wise count rates for Quadrant B Data is divided into 100 sec bins |
 |
 |
| Module-wise count rates for Quadrant C Data is divided into 100 sec bins |
 |
 |
| Module-wise count rates for Quadrant D Data is divided into 100 sec bins |
 |
 |
| Parameter | Plot |
|---|---|
| CZT HV Monitor |  |
| D_VDD | 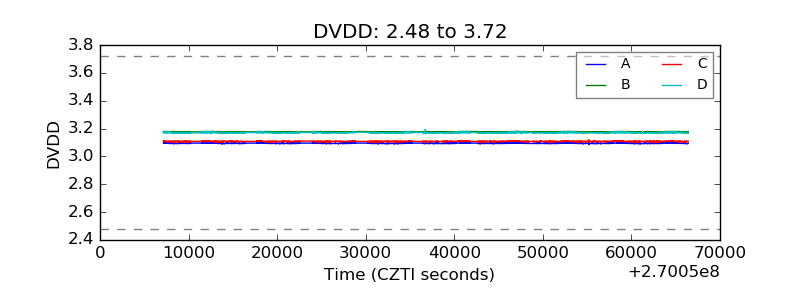 |
| Temperature 1 |  |
| Veto HV Monitor |  |
| Veto LLD |  |
| Alpha Counter |  |
| _CPM_Rate |  |
| CZT Counter |  |
| +2.5 Volts monitor |  |
| +5 Volts monitor |  |
| _ROLL_ROT |  |
| _Roll_DEC |  |
| _Roll_RA |  |
| Veto Counter |  |