| Param | Original file | Final file |
|---|---|---|
| Filename | modeM0/AS1T02_072T01_9000002250_15239cztM0_level2.evt | modeM0/AS1T02_072T01_9000002250_15239cztM0_level2_quad_clean.evt |
| Size (bytes) | 359,778,240 | 86,520,960 |
| Size | 343.1 MB | 82.5 MB |
| Events in quadrant A | 2,182,634 | 593,632 |
| Events in quadrant B | 2,498,830 | 593,650 |
| Events in quadrant C | 3,013,503 | 572,876 |
| Events in quadrant D | 2,907,082 | 556,004 |
| Mode M9 | |||
|---|---|---|---|
| Quadrant | BADHDUFLAG | Total packets | Discarded packets |
| A | 0 | 12 | 0 |
| B | 0 | 12 | 0 |
| C | 0 | 12 | 0 |
| D | 0 | 12 | 0 |
| Mode SS | |||
|---|---|---|---|
| Quadrant | BADHDUFLAG | Total packets | Discarded packets |
| A | 0 | 88 | 0 |
| B | 0 | 88 | 0 |
| C | 0 | 88 | 0 |
| D | 0 | 88 | 0 |
| Mode M0 | |||
|---|---|---|---|
| Quadrant | BADHDUFLAG | Total packets | Discarded packets |
| A | 0 | 9396 | 2 |
| B | 0 | 10269 | 1 |
| C | 0 | 11788 | 1 |
| D | 0 | 11645 | 1 |
| Quadrant | Total seconds | Saturated seconds | Saturation percentage |
|---|---|---|---|
| A | 4321 | 44 | 1.018283% |
| B | 4321 | 108 | 2.499421% |
| C | 4321 | 150 | 3.471419% |
| D | 4321 | 60 | 1.388567% |
Noise dominated data is calculated using 1-second bins in cleaned event files. If a bin has >2000 counts, and if more than 50% of those come from <1% of pixels, then it is considered to be noise-dominated and hence unusable.
| Quadrant | # 1 sec bins | Bins with >0 counts | Bins with >2000 counts | High rate bins dominated by noise | Noise dominated (total time) | Noise dominated (detector-on time) | Marked lightcurve |
|---|---|---|---|---|---|---|---|
| A | 5527 | 4322 | 0 | 0 | 0.00% | 0.00% | 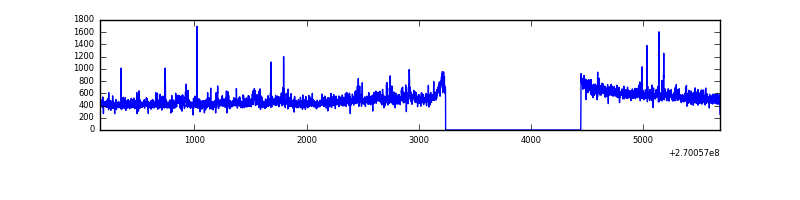 |
| B | 5527 | 4322 | 41 | 41 | 0.74% | 0.95% | 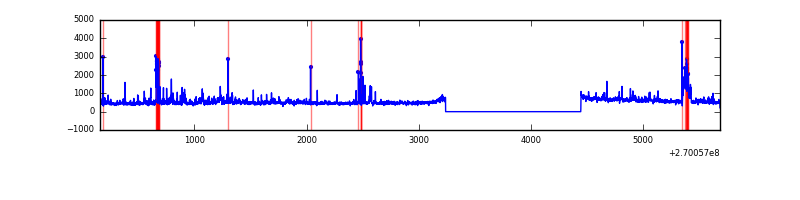 |
| C | 5527 | 4323 | 108 | 108 | 1.95% | 2.50% | 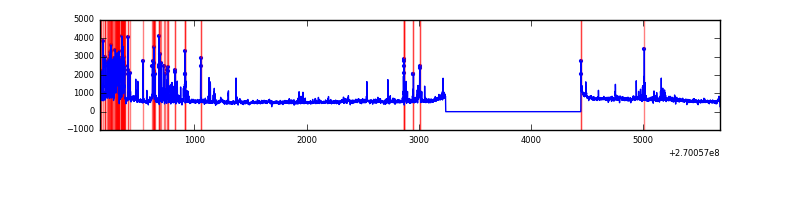 |
| D | 5527 | 4322 | 15 | 15 | 0.27% | 0.35% | 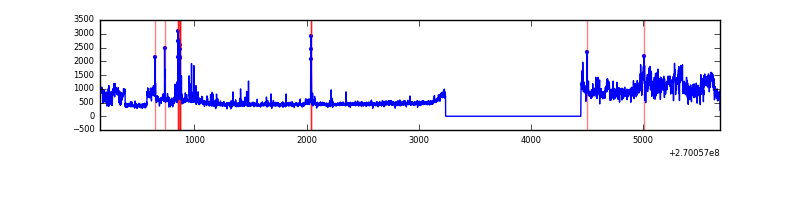 |
Top three noisy pixels from each quadrant. If the there are fewer than three noisy pixels in the level2.evt file, extra rows are filled as -1
| Pixel properties | Quadrant properties | ||||||
|---|---|---|---|---|---|---|---|
| Quadrant | DetID | PixID | Counts | Sigma | Mean | Median | Sigma |
| A | 12 | 189 | 121829 | 1123.93 | 531 | 520 | 107.9 |
| A | 9 | 143 | 6613 | 56.45 | 531 | 520 | 107.9 |
| A | 2 | 79 | 4949 | 41.03 | 531 | 520 | 107.9 |
| B | 3 | 64 | 204293 | 2052.83 | 530 | 517 | 99.3 |
| B | 10 | 245 | 69250 | 692.41 | 530 | 517 | 99.3 |
| B | 10 | 16 | 56323 | 562.19 | 530 | 517 | 99.3 |
| C | 4 | 254 | 521815 | 4492.38 | 508 | 511 | 116.0 |
| C | 3 | 233 | 484510 | 4170.9 | 508 | 511 | 116.0 |
| C | 7 | 247 | 13843 | 114.89 | 508 | 511 | 116.0 |
| D | 2 | 16 | 807724 | 6490.94 | 512 | 496 | 124.4 |
| D | 7 | 38 | 53143 | 423.34 | 512 | 496 | 124.4 |
| D | 1 | 255 | 43783 | 348.07 | 512 | 496 | 124.4 |
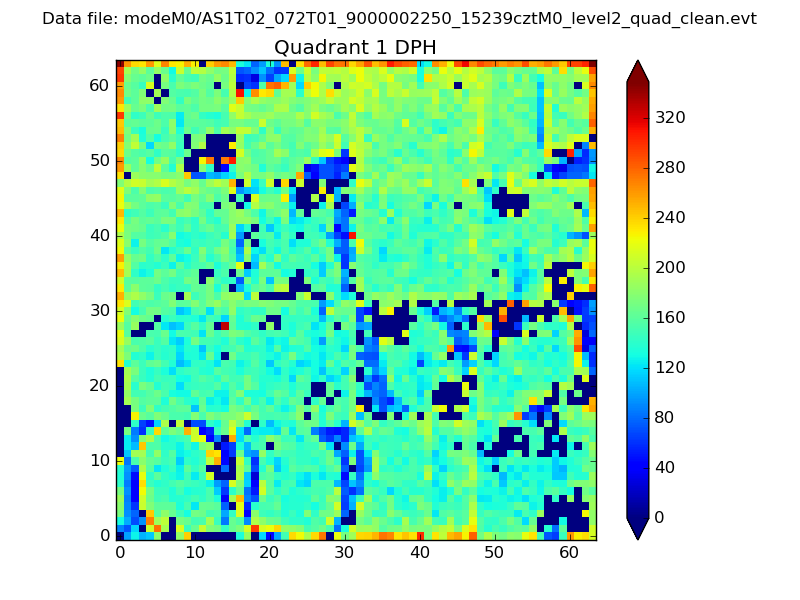
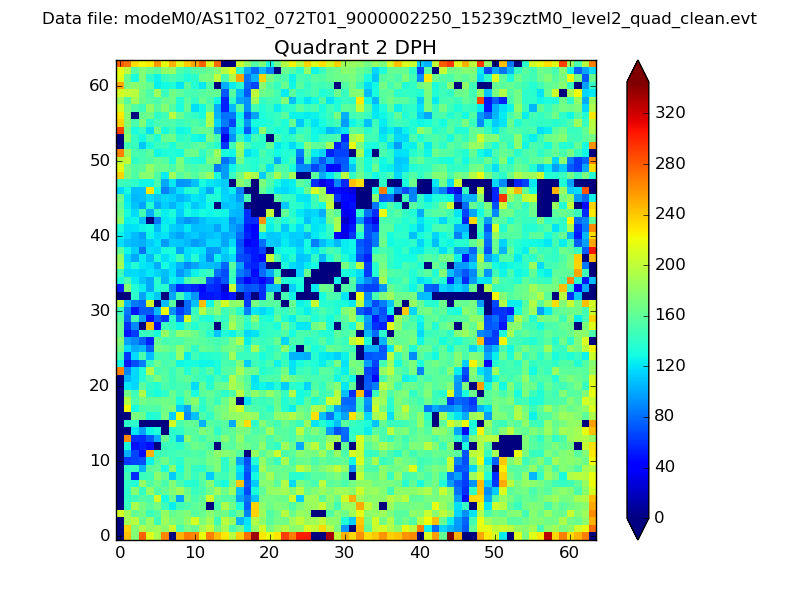
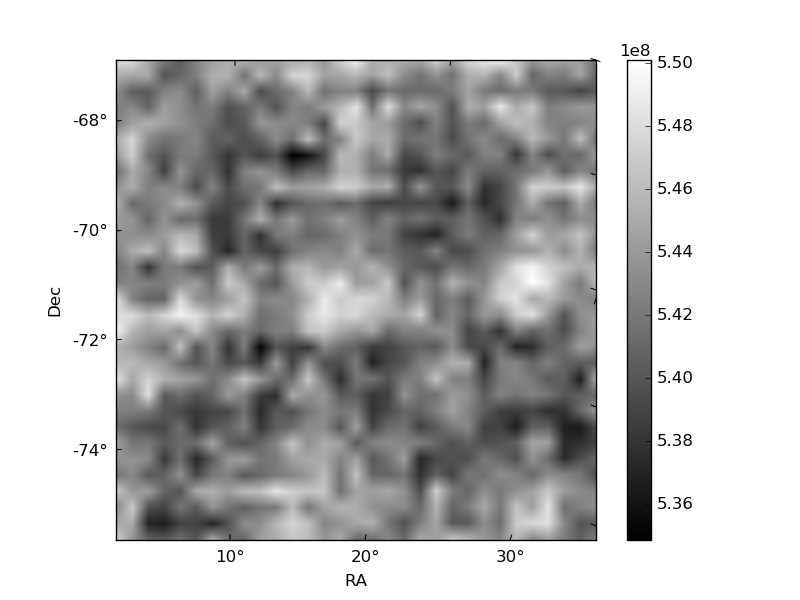
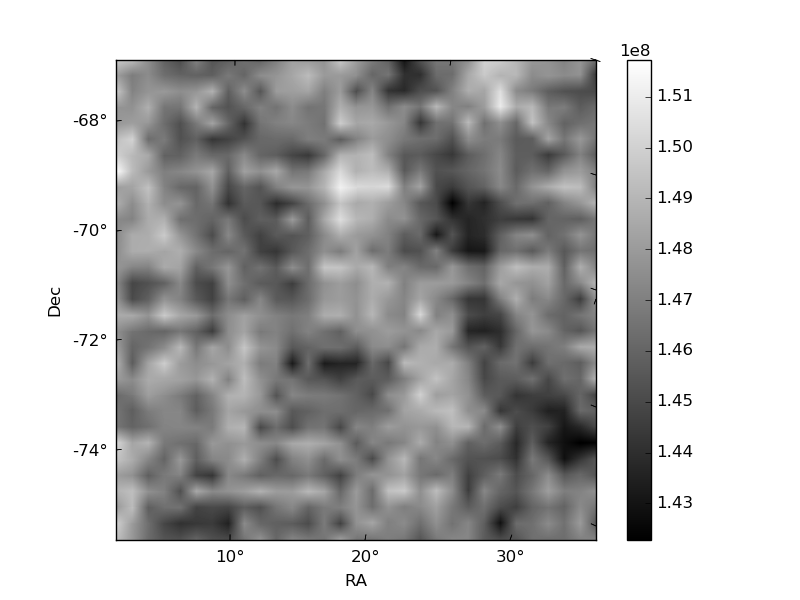
Histogram calculated using DETX and DETY for each event in the final _common_clean file
| Quadrant A |  |
 |
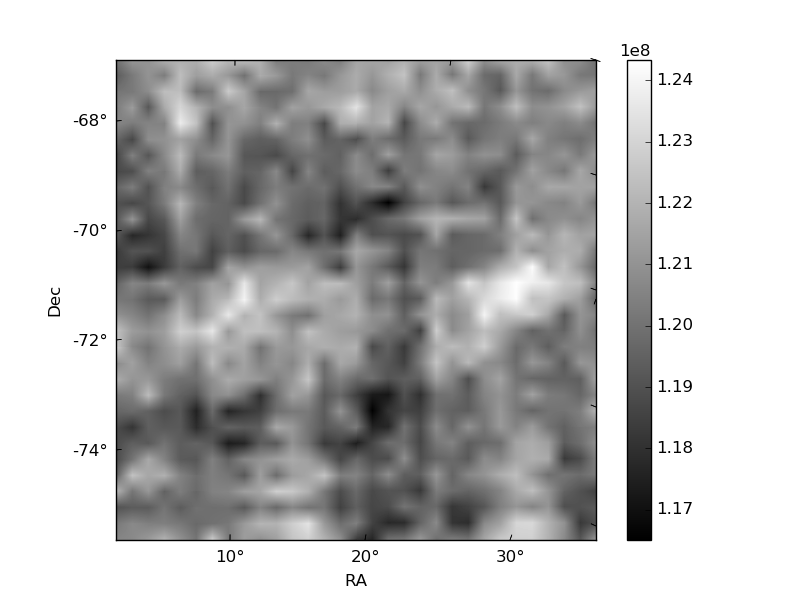
Quadrant B |
|---|---|---|---|
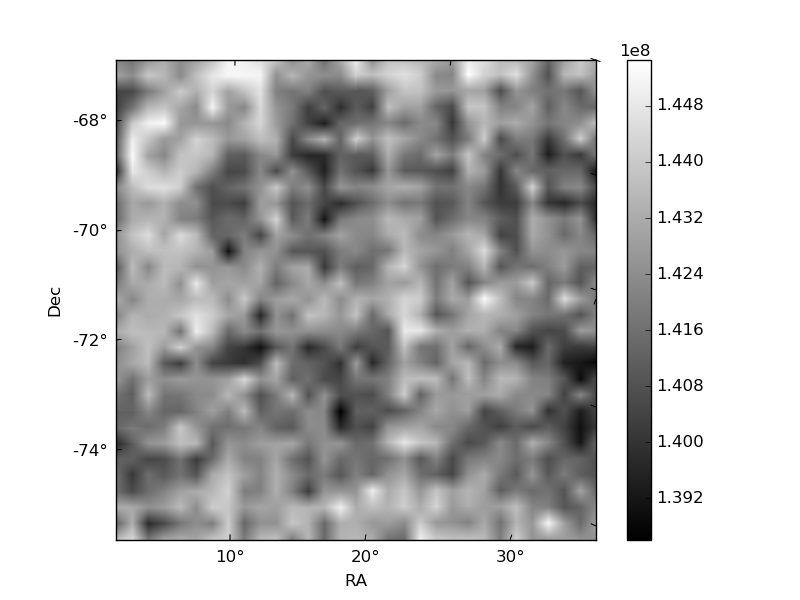
| Quadrant D | 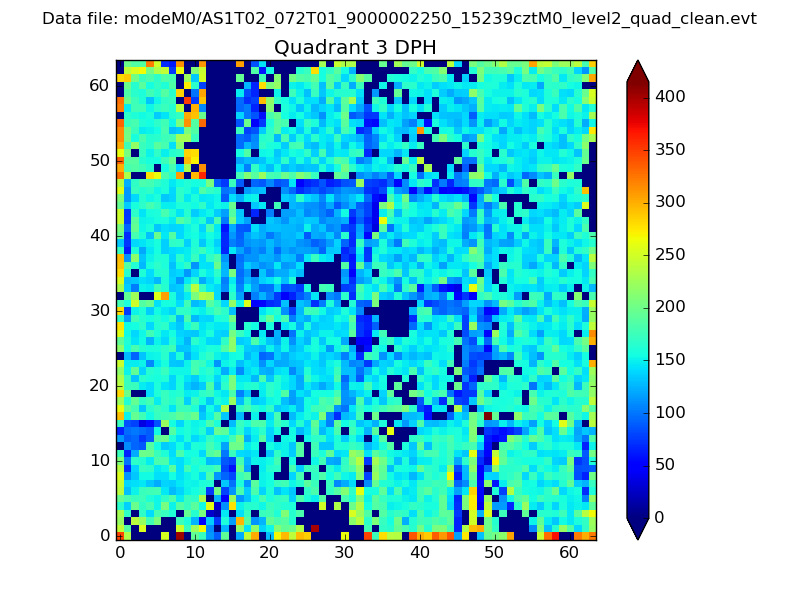 |
 |
Quadrant C |
| Plot type | Count rate plots | Images |
|---|---|---|
| Comparison with Poisson distribution Blue bars denote a histogram of data divided into 1 sec bins. Red curve is a Poisson curve with rate = median count rate of data. |
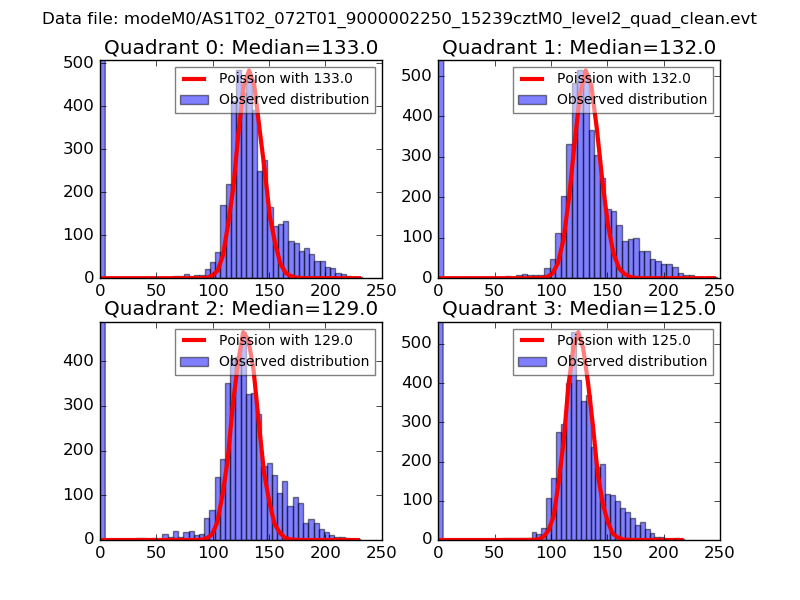 |
 |
| Quadrant-wise count rates Data is divided into 100 sec bins |
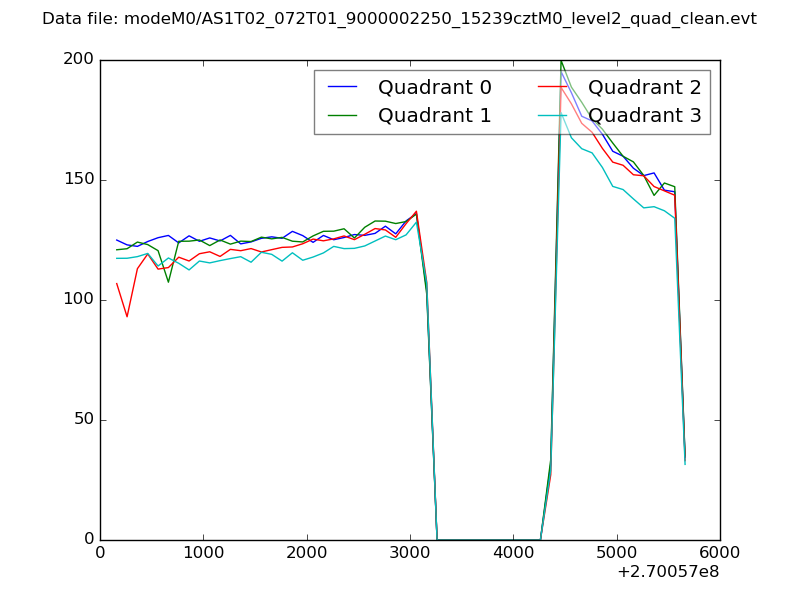 |
|
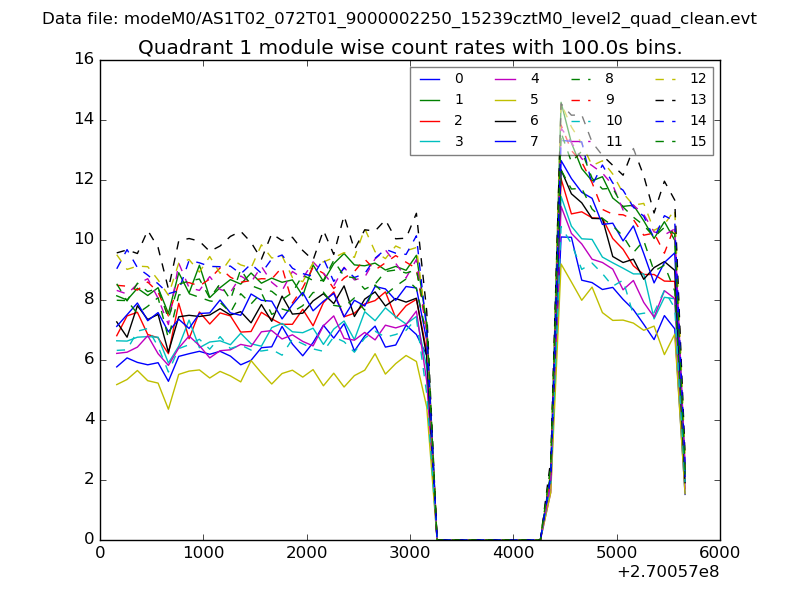
| Module-wise count rates for Quadrant A Data is divided into 100 sec bins |
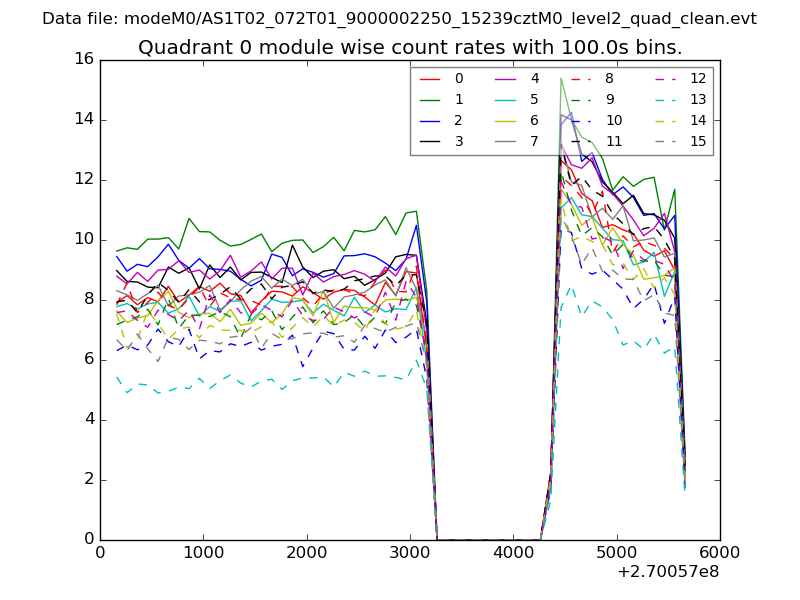 |
 |
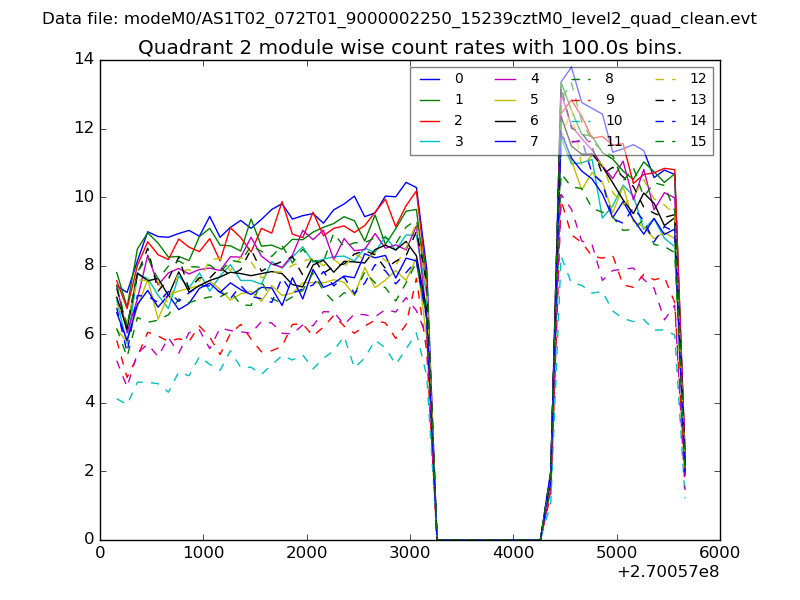
| Module-wise count rates for Quadrant B Data is divided into 100 sec bins |
 |
 |
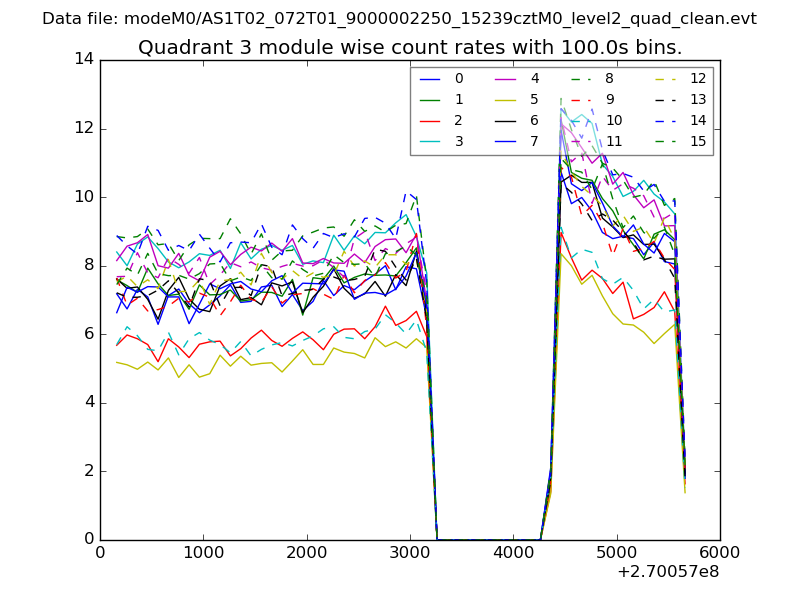
| Module-wise count rates for Quadrant C Data is divided into 100 sec bins |
 |
 |
| Module-wise count rates for Quadrant D Data is divided into 100 sec bins |
 |
 |
| Parameter | Plot |
|---|---|
| CZT HV Monitor | 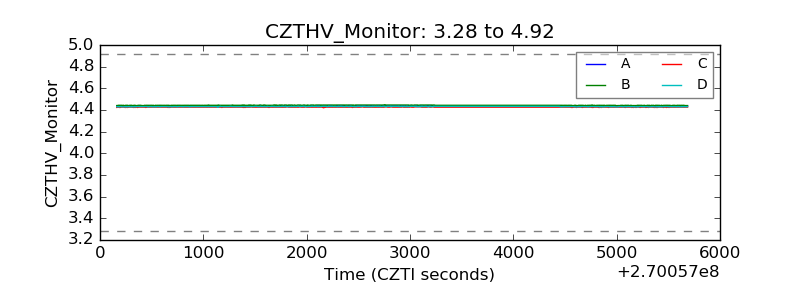 |
| D_VDD | 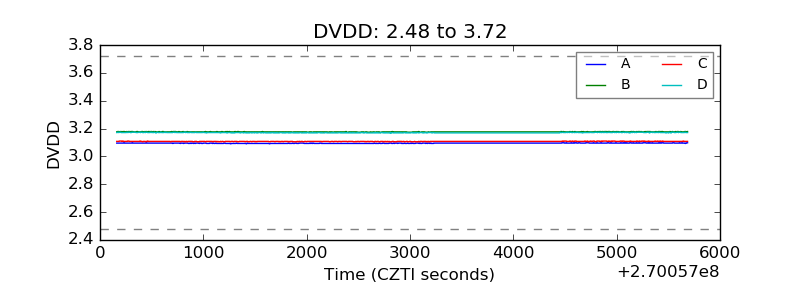 |
| Temperature 1 | 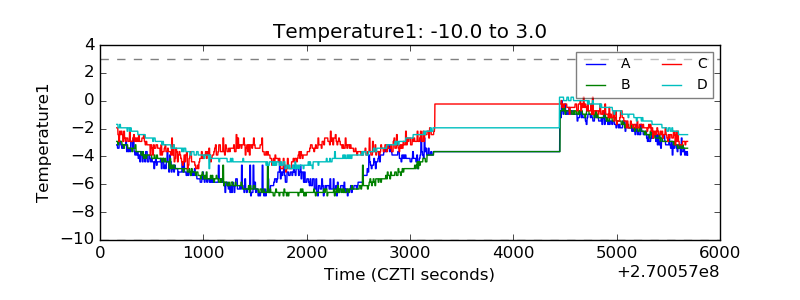 |
| Veto HV Monitor | 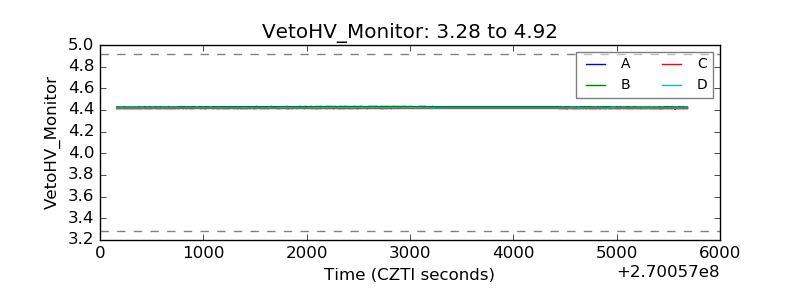 |
| Veto LLD | 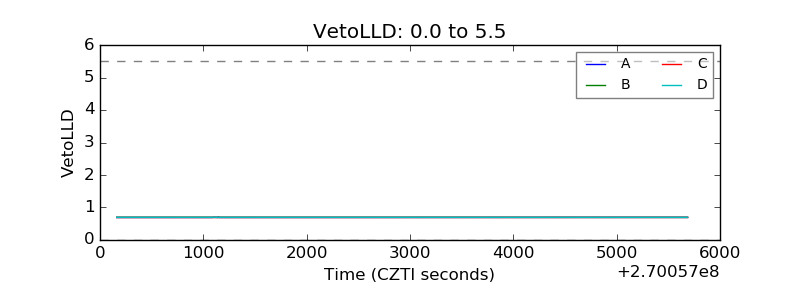 |
| Alpha Counter | 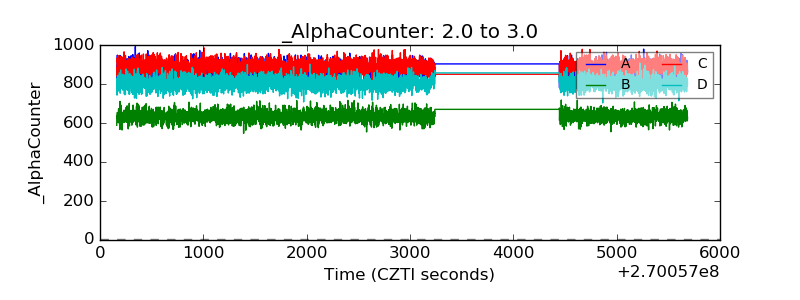 |
| _CPM_Rate | 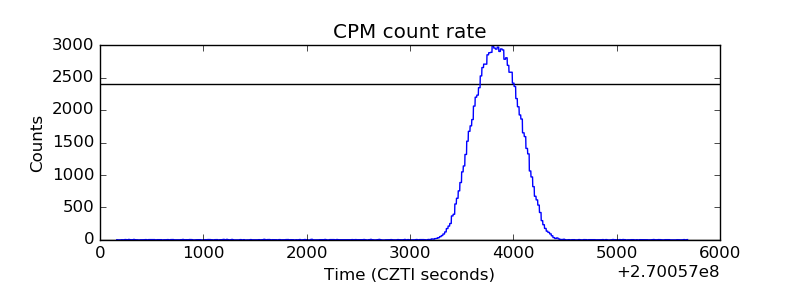 |
| CZT Counter | 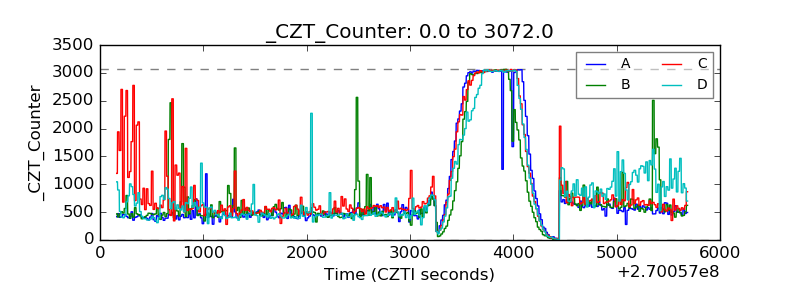 |
| +2.5 Volts monitor |  |
| +5 Volts monitor |  |
| _ROLL_ROT | 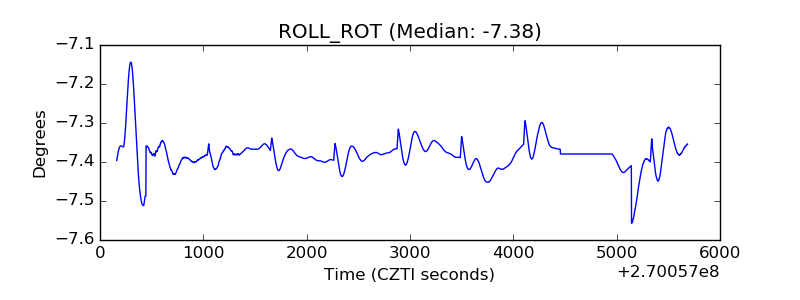 |
| _Roll_DEC |  |
| _Roll_RA |  |
| Veto Counter | 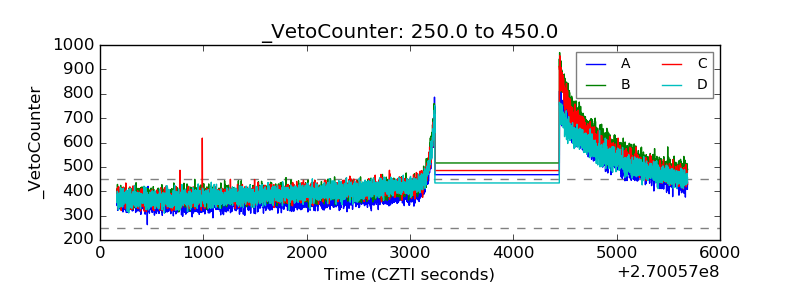 |